Offensive Strategy — Spread Offense Diagram
American football is about using so-called defensive, offensive and special team players as well as the execution of the plays in the sport game of the American football, where there is a vast array of positions, strategies, plays, types of play calling systems and formations utilized. Such term as a "game plan" is simply a strategy for a particular game.
The objective of each of the used offenses is to simply score the points. Thus, the players and coaches plan is based on a variety of factors, involving the players, the opponent's defensive strategy, the number of points needed in order to win the game and the amount of time remaining before the end or the halftime of the game.
The offense is known to be able to prolong their possession of the ball for preventing the opponent from scoring, involving three types of players: receivers, linemen and backs, whose duties and positions on the field vary, depending on the offensive scheme.
The position names vary from one team's playbook to another. The most commonly used are Linemen, who can be Center, Guard or Tackle. The Center is known to be a player snapping the ball to the so-called “quarterback”, “running blocking” in a way of pushing the defenders away from the ball carrier on a running play, and “passing the blocking” by stopping the defenders from tackling the quarterback or simply disrupting. Being responsible for calling the blocking schemes on the line, the “center” Linemen are those who are telling the other linemen which of the defenders have to be blocked.
The Guards are known to be lining up on both sides from the center, being usually bigger than the center and so better run blockers rather than the so-called “pass blockers”. And the Tackles are the "bookends" of the offensive line, who are simply the biggest offensive linemen, having the great foot and hand coordination for being able to successfully protecting against the pass rushes. Once some team has a right-handed quarterback, then the left tackle can be the best pass blocker on the line for a reason of them being responsible for preventing a "blindside" pass rush that the quarterback might miss if it catches him out of the blue.
The “Backs” are the players of the American football named this way because of lining up behind the line of scrimmage at the start of the play. They can be “Quarterbacks”, “Fullbacks” and “Halfbacks”. The Quarterbacks are those who line up directly behind the center of the field, taking the ball from that position to put it back into the play. The quarterback's main responsibility is to pass the ball or to hand the ball to a running back — the one who carries the ball downfield.
Sometimes, the mentioned “quarterbacks” can even act as a receiver for being able to catch a pass thrown by another player during a so-called "trick play". In most of the cases, the quarterback is the one communicating with the other players the play they are going to run. It is very important for all the quarterbacks to be able to throw the ball accurately, “to read” the defenses and make the correct decisions very quickly.
At the same time, the Fullbacks are known to be lining up behind the quarterback, being involved in blocking, running and, sometimes, catching the passes. The fullback in many of the offensive schemes is known to be considered as a running back. But this player is usually more physical and bigger to compare to the other running backs on the team, involved in blocking. Although, the Halfbacks are those, who line up behind the quarterback and sometimes behind the fullback. Their responsibilities are: to run the ball, to catch the passes, to block, and sometimes even to throw the ball on the “trick plays”.
Playing American football, it is important to know about the so-called “offenses”. One of such offenses is called as a “spread offense” — an offensive scheme used at every level of the game. The spread offenses are those placing the quarterback in the shotgun formation. Many of them also employ a so-called “no-huddle approach”, and some use the so-called “read option running play” for putting the pressure on both sides of the defense itself.
And even if you know a lot about American football and the mentioned offensive strategies, in particular, it is still very important to keep a track of them mentioning the existing ones in a way of a drawing — for example, a scheme or a plan created in the appropriate drawing application, such as a ConceptDraw DIAGRAM one. If you feel like you need help in creating such plan, then you can always rely on the developers of ConceptDraw DIAGRAM as they are the IT specialists working for CS Odessa creating the so-called “solutions”, which are all meant to be used for simplifying the ConceptDraw DIAGRAM users work with drawing the mentioned schematics.
Sample 1. Football Solution in ConceptDraw STORE
It is never a problem to find the needed solution as long as you have a new product of CS Odessa — ConceptDraw STORE application. Having the mentioned tool means ensuring yourself in making it possible to create the needed drawing within a short period of time, having the previously made examples of the drawings, which all can be always used for editing and so for making the unique ones based on those already created by the specialists in making such schemes and plans.
How To Create Spread Offense Diagram
Explaining offensive strategies of American Football is practically impossible without drawing a diagram. If you need to do this more than once you have to choose an appropriate tool allows you to change diagrams easily. ConceptDraw DIAGRAM extended with the Football Solution is the best choice for this case.
A combination of the "Football Fields" and "Football Positions" libraries gives you an ability to create a football-related drawing in seconds. Follow next steps to create you own football schema:
- From the "Football Fields" library drop a field object to your document
- From the "Football Positions" library drop all positions object you need to your document
- Place positions on the field according to your drawing idea
- Add arrows or text labels if needed.
Offensive strategies may be hard to explain with a single diagram. In this case you can break your explanation into some stages, and place each stage onto a different page. You don't need to draw from the start point each time, just copy and paste basic drawing to different pages, and then add arrows and text labels in order you talk about them. When you start presenting using F5 button, pages will appear one by one, that allows your audience to understand how players change their positions etc.
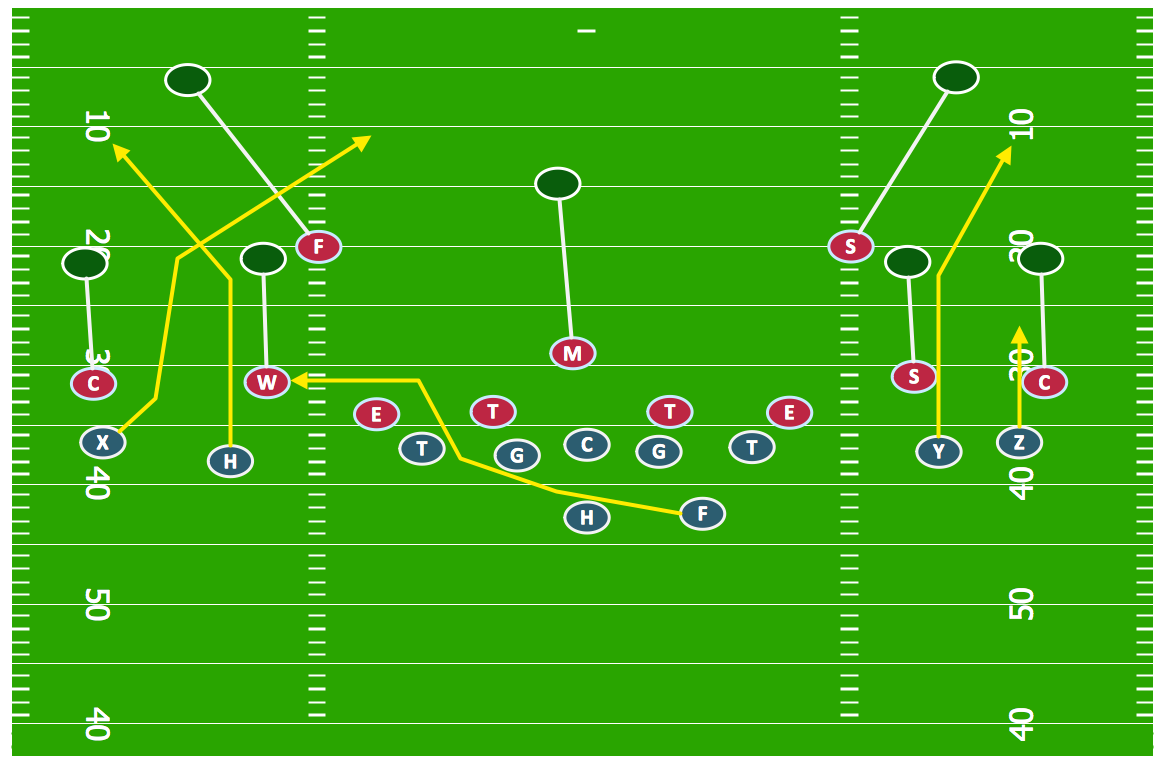
Sample 2. Football — Offensive Strategy — Spread Offense.
To make the plan mentioning the football players positions on the field within only a very short period of time, you should, first of all, to download the ConceptDraw DIAGRAM software from this site (unless you don’t have it downloaded to your computer yet), then to download another product of CS Odessa — ConceptDraw STORE and choose the solution named as “the Football Solution”.
Having the Football Solution means having at least a few libraries, which can be useful for making the football related drawings, as one of them is called the “Football Fields” and another — the “Football Positions”. Thus, any football positions of the football players within the football field can be represented in a way of a smart looking drawing, as well as a professionally looking one in case you have all the mentioned above tools.
TEN RELATED HOW TO's:
Analysis is very important part for every business, as it helps to understand the weakness and to see the opportunities, and SWOT is one of the most effective tools. To illustrate the multifunctionality of this tool, let’s imagine a SWOT sample in area of computers networking, which can be carried out to realize the pros and cons of some equipment, for example. Even a network topology or a administer can be a subject for this analysis.
This SWOT analysis matrix illustrate the sample of using this useful technique for comprehension of Strengths and Weaknesses, and for determining the Opportunities open to business and the Threats it encounters. Used in a business scope, it will help to create a perspective niche in the market for particular business. The ConceptDraw SWOT and TOWS Analysis solution gives a lot of templates of both SWOT and TOWS matrices that allow managers and marketers create custom diagrams to perform SWOT or TOWS analysis in context of a particular business.
Picture: SWOT Sample in Computers
When thinking about data visualization, one of the first tools that comes to mind is a flowchart design. You can find flowchart symbols, shapes, stencils and icons easily on the Internet, but it might take time to systematize this information. Nevertheless, once you start flowcharting, you’ll love its simplicity and efficiency.
This diagram consists from standard flowchart symbols, approved by ANSI (American National Standard Institute) for drawing flowcharts. A flowchart is a diagram that represents a step-by-step algorithm of any process, displaying the process stages as boxes that are connected with arrows. Flowchart design makes it clear and readable.
Flowchart designed using ConceptDraw DIAGRAM flowchart software allows to make attractive and clear process presentation, it makes interpretation of the business process flow fresh and versatile. Great flowchart design view is a big advantage over the diagram created manually on a paper.
Picture: Flowchart Design: Principles, Layout, Symbols and Best Practices
Related Solution:
ConceptDraw DIAGRAM diagramming and vector drawing software enhanced with Fishbone Diagrams solution from the Management area of ConceptDraw Solution Park gives the ability to draw Fishbone diagram, which identifies many possible causes for an effect for problem solving. Fishbone Diagram procedure of creation includes the set of steps easy for execution in ConceptDraw DIAGRAM.
Picture: Fishbone Diagram Procedure
Related Solution:
There are numerous articles about the advantages of flowcharting, creating business graphics and developing different charts. Nevertheless, these articles are almost useless without the main component - the examples of flowcharts, org charts and without a fine example, it is difficult to get all the conveniences of creating diagrams. You can find tons of templates and vivid examples on Solution Park.
This illustration shows a variety of business diagrams that can be created using ConceptDraw DIAGRAM. It comprises a different fields of business activities: management, marketing, networking, software and database development along with design of infographics and business illustrations. ConceptDraw DIAGRAM provides a huge set of sample drawings including business process modeling diagrams,, network diagrams, UML diagrams, orgcharts, DFD, flowcharts, ERD, geographical maps and more.
Picture: Examples of Flowcharts, Org Charts and More
Related Solution:
How to make great presentation via Skype - It let presenter to control over the slide-show process which plays on each computer of Skype conference call participants synchronously.
Another great feature, at the end of presentation each participant of conference call have the copy of presentation document file. It saves in Presentation History folder. Later, its very easy to return back to presentation history and view it again or show for other team.
Picture: How to make great presentation via Skype? ...how it works with ConceptDraw MINDMAP?
Related Solutions:
Collaborative business with ConceptDraw.
Collaborative-business strategies - the sharing of business information and ideas among partners, suppliers and customers can help increase sales, improve service, and decrease costs.
Picture: Collaborative business with ConceptDraw DIAGRAM
In case you need to make a plan for your own future hotel or to do it for someone else, then you can always find the way to make such template very quickly and to have a very good looking result in the end. Whichever type of the hotels you want to illustrate in a way of a floor plan, you can always do it with ConceptDraw DIAGRAM drawing application.
Picture: Hotel Plan. Hotel Plan Examples
Related Solution:
ConceptDraw DIAGRAM extended with Matrices Solution from the Marketing Area of ConceptDraw Solution Park is a powerful software for drawing various types of Marketing Matrices: Ansoff Matrix, BCG Matrix, Deployment Chart, Feature Comparison Chart, Competitive Strategies Matrix, Flow Process Chart, Porter's Value Chain Diagram, Positioning Map, and many others.
Picture: Matrices
Related Solution:
How to draw a Process Flow Chart? It's very fast and easy to draw any Process Flow Chart using the tools of special Process Flow Chart software free.
Flowcharts Solution offers wide set of useful drawing tools, collection of samples, ready-to-use template and 2 libraries with predesigned vector elements which will help facilitate drawing process and designing professional looking process flow chart, process flow scheme, process block diagram, etc.
Picture: Process Flow Chart Software Free
Related Solution:
When trying to figure out the nature of the problems occurring within a project, there are many ways to develop such understanding. One of the most common ways to document processes for further improvement is to draw a process flowchart, which depicts the activities of the process arranged in sequential order — this is business process management. ConceptDraw DIAGRAM is business process mapping software with impressive range of productivity features for business process management and classic project management. This business process management software is helpful for many purposes from different payment processes, or manufacturing processes to chemical processes. Business process mapping flowcharts helps clarify the actual workflow of different people engaged in the same process. This samples were made with ConceptDraw DIAGRAM — business process mapping software for flowcharting and used as classic visio alternative because its briefly named "visio for mac" and for windows, this sort of software named the business process management tools.
This flowchart diagram shows a process flow of project management. The diagram that is presented here depicts the project life cycle that is basic for the most of project management methods. Breaking a project into phases allows to track it in the proper manner. Through separation on phases, the total workflow of a project is divided into some foreseeable components, thus making it easier to follow the project status. A project life cycle commonly includes: initiation, definition, design, development and implementation phases. Distinguished method to show parallel and interdependent processes, as well as project life cycle relationships. A flowchart diagram is often used as visual guide to project. For instance, it used by marketing project management software for visualizing stages of marketing activities or as project management workflow tools. Created with ConceptDraw DIAGRAM — business process mapping software which is flowcharting visio alternative or shortly its visio for mac, this sort of software platform often named the business process management tools.
Picture: Process Flowchart: A Step-by-Step Comprehensive Guide
Related Solution: