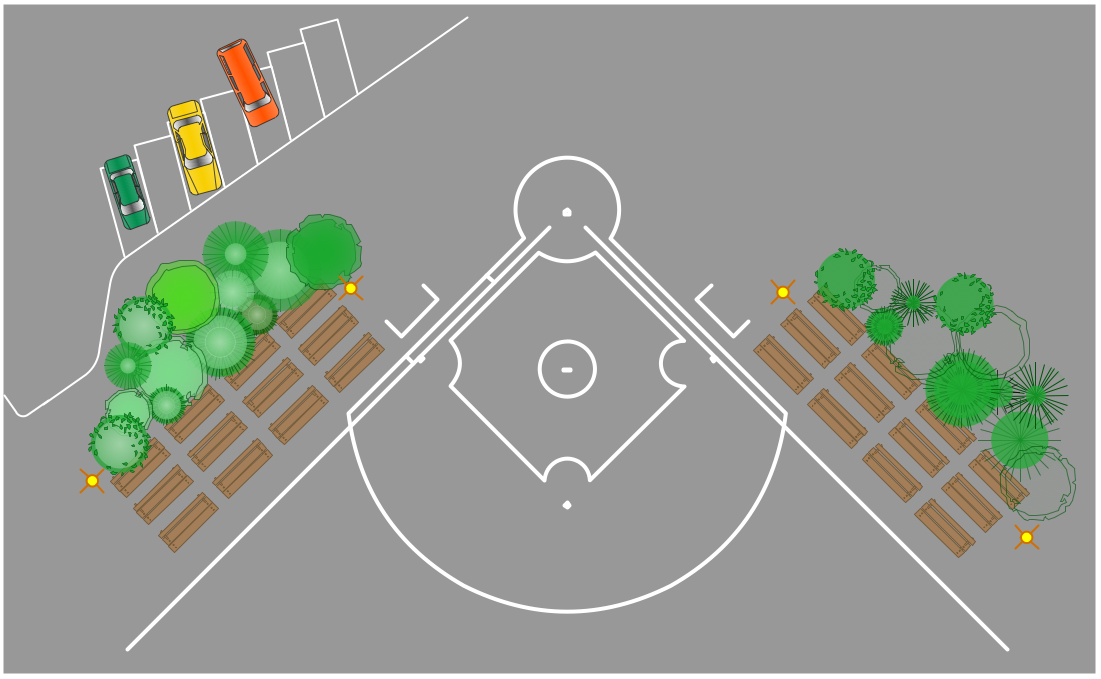
Baseball Diagram – Colored Baseball Field
There are many nuances the baseball players know very well, but the beginners who want to start playing this game professionally have no idea about just yet. That’s why we can explain some of the terms, used in baseball, such as, for example, the “coach's box” as well as how to create a great looking colored baseball field plan.
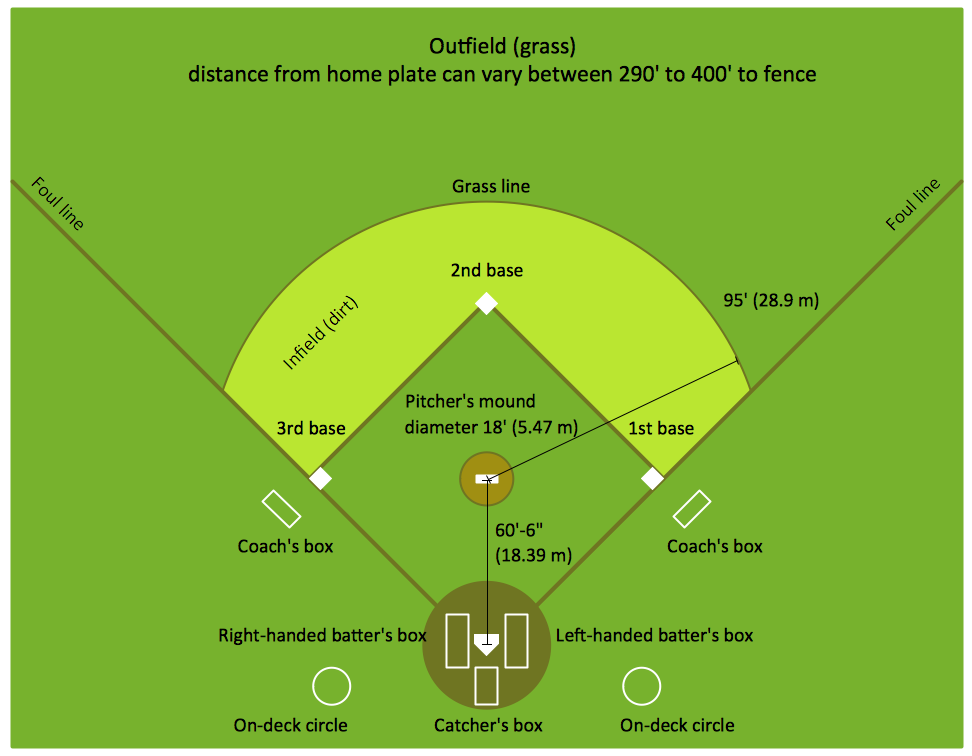
The coach's box is known to be a term used in many different kinds sports, such as baseball, where it is the space for the third base coach and first base coach to stand. It is a well-known practice for a coach having a play at his base leaving the coach’s box to signal the player to slide, return or advance to a base, which is allowed by the so called “umpire” if the coach does not interfere with the play. Thus, the so called “coach’s boxes”, located behind third and first base, are where those base coaches are meant to be standing. Although coaches often stand outside the box. The mentioned coach's boxes are usually marked with chalk, sometimes paint.
There are other “boxes” on the baseball field, such as batter's one, which is a place where “batter” stands when he is ready to receive a pitch. This box is usually also drawn with the use of chalk on the dirt around the so called “home plate”, which is the final base that a player must touch to score. The insides of the boxes are watered down before each game and the chalk lines delineating the two Foul Lines are usually not extended through the batter's boxes as much. The mentioned lines exist to be able to judge a batted ball foul or fair, and so they exist for the purpose of the rules pertaining to the “batter's box” as well as the “batter's position”.
There are two batter's boxes, each of which is on each side of the mentioned before “home plate”. They are meant to be 1,8 metres long and 1,2 metres wide, as well as centred lengthwise at the centre of “home plate” with the inside line of each “batter's box” 15,24 centimetres from the nearest edge of “home plate”. The rule for the right-handed batter is for him to stand in the “batter's box” on the left side from the “home plate”, and for the left-handed one to stand in the “batter's box” to their right. It’s batter’s right to occupy the “batter's box”, but only one at a time. Although, he does not have the right to leave the “batter's box” after the pitcher has started his windup or has come set. For the batter to leave the “batter's box”, he can do it once the pitcher has engaged the so called “rubber” (the white rubber strip the front of which is 18,4 metres from the rear point of home plate). A pitcher can push off the rubber with his foot to gain velocity toward home plate while pitching.
There are also foul poles on the baseball field, which are usually much higher than the top of the outfield fence. They also often have a narrow screen running along the fair side of the pole, so once a ball bounces off this screen, it is called as a “home run”. Foul poles are known to be painted in yellow colour. The described foul poles help the judge to find out if a “fly ball” hitting above the fence line is “foul” (which means “out of play”) or “fair” (a “home run”). Those poles are basically a vertical extension of the “foul lines” at the edge of the baseball field, having the outer edge of those foul lines as well as foul poles defining the so called “foul territory”. Both the lines and the poles are known to be in fair territory, which is different in a game of a basketball and football, where the lines mark the playing boundaries being out of bounds.

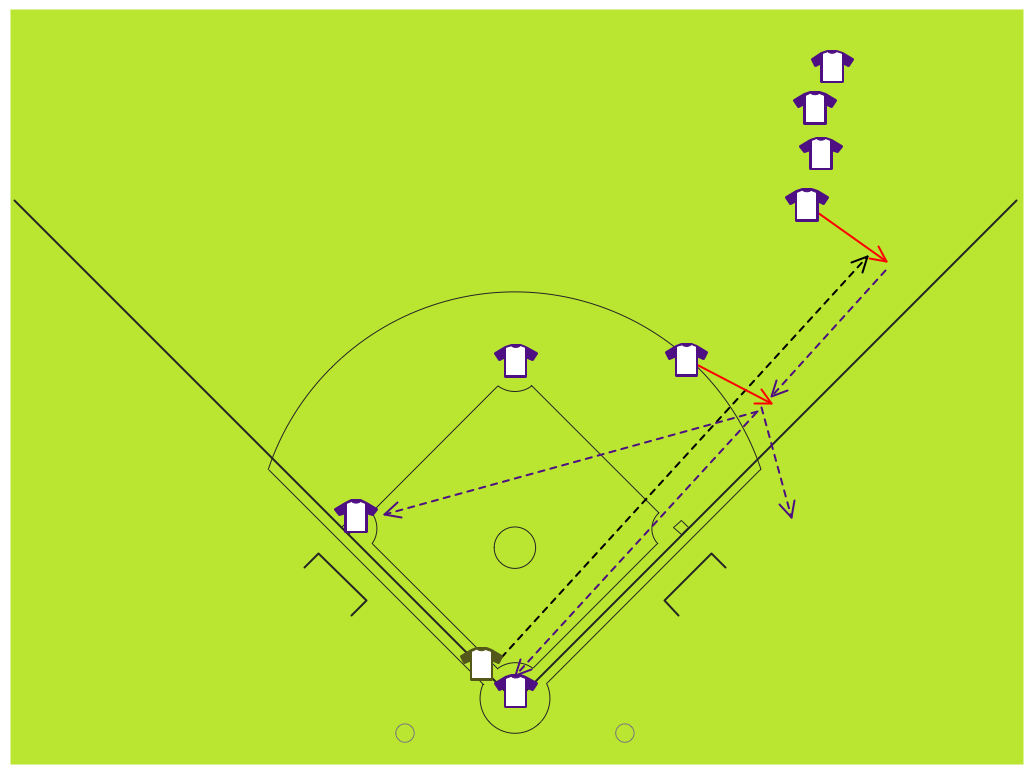
Sample 1. Baseball Diagram — Corner View Baseball Field.
There’s also a so called “regulation mound” on the baseball field, which is 5,5 metres in diameter with the centre 18 metres from the rear point of “home plate” (on the line between “second base” and “home plate”). 15,2 centimetres in front of the pitcher's rubber, the mound starts to slope downward and the front edge of the “pitcher's plate” is 46 centimetres behind the centre of the “mound” (making the front edge's midpoint 18,44 metres from the rear point of “home plate”). The top of the baseball fiend is known to be no higher than 25,4 centimetres above the “home plate”. Also, a higher mound generally favours the pitcher, who can gain more leverage as well as put more downward velocity on the ball.
Doing that he can make it more difficult for the batter to strike the ball squarely with the so called “bat”, which is a smooth contoured round wooden (sometimes metal) rod that is used for hitting the ball, previously thrown by the “pitcher”. A bat's diameter is smaller at one end (at the handle) than at the other (the barrel-end) and the bottom end of the handle is known to be called as the “knob”. A batter is simply a player who uses the “bat” to strike the ball and his task is to try to strike the ball in the sweet spot near the middle of the barrel-end of the bat in order to “bat the ball” (to hit the ball with the bat into foul or fair territory). "Batting around" can be referred "to having every player in the line-up to take a turn at bat during an inning." A team, having many good hitters, might be said to have a lot of "bats", so the players get so many “bats” in their line-up that they're hard to beat if they keep hitting.
A combination of the "Baseball Fields" and "Baseball Positions" libraries gives you an ability to create a baseball-related drawing in seconds. Follow next steps to create you own baseball schema:
- From the "Baseball Fields" library drop a field object to your document
- From the "Baseball Positions" library drop all positions object you need to your document
- Place positions on the field according to your drawing idea
- Add arrows or text labels if needed.
All drawings, schemas and diagrams created in ConceptDraw DIAGRAM are scalable vector graphics that allows print it in any size your printer allows, and get hard copy of a card or a poster. Keep in mind that if you want to place some text labels for yourself, and do not see them on your hard copy, then you should place text labels onto a different layer and then switch "Print" option off for this layer.
Getting Started with ConceptDraw DIAGRAM for Windows (.pdf)
Getting Started with ConceptDraw DIAGRAM for MacOS (.pdf)
Sample 2. Baseball Diagram — Colored Baseball Field.
Talking about the baseball field, it’s important to mention that he plan of such field can be always created in ConceptDraw DIAGRAM using both "Baseball Positions" and "Baseball Fields" libraries available both on this site and in ConceptDraw STORE application. To create the great looking as well as smart and professional baseball-related drawings, you can simply download the mentioned software and use the "Baseball Fields" library as well as the "Baseball Positions" one to drop all the needed positions to your document in order to finish with a good looking plans within only a few hours or even minutes as long as you have the Baseball Solution found and downloaded from the ConceptDraw STORE application, which is another product of CS Odessa, developed to enable the ConceptDraw DIAGRAM users with even more tools, such as the pre-made templates of the sport fields, including the baseball one.
-Sample.png)