Infield Positioning for Baseball Situations
Baseball is very interesting and popular sport game. As each sport game it includes large quantity of game situations, positions and rules. If you are baseball coach or fan, you need convenient and useful software to design the baseball-related diagrams. In this case ConceptDraw DIAGRAM diagramming and vector drawing software is a real godsend for you!
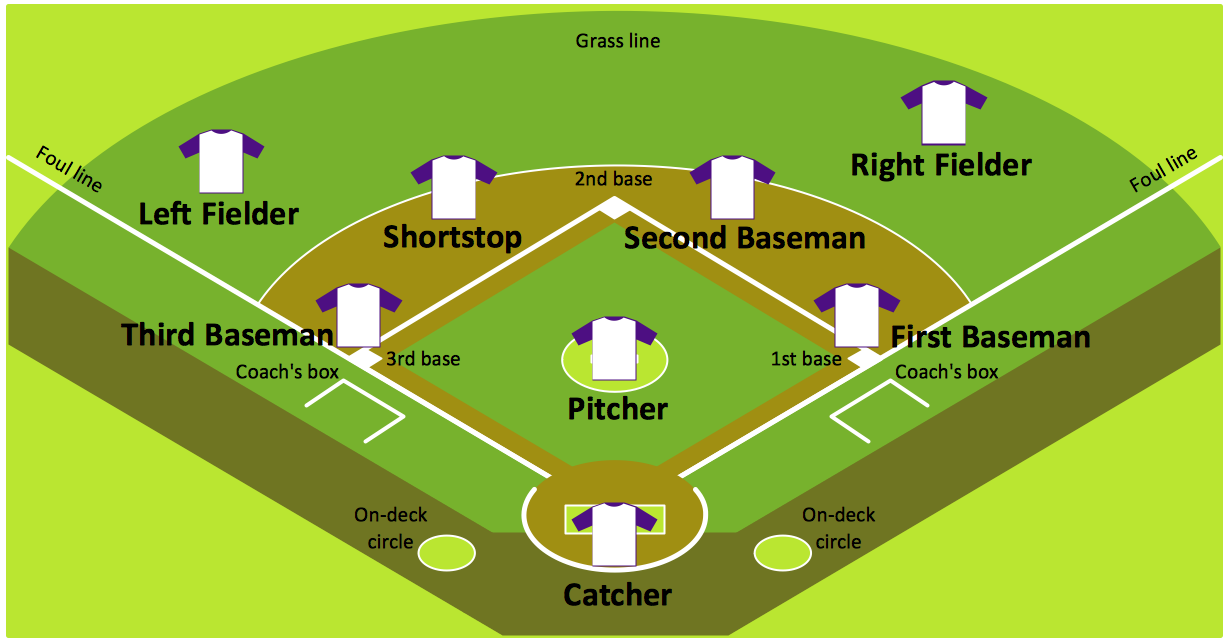
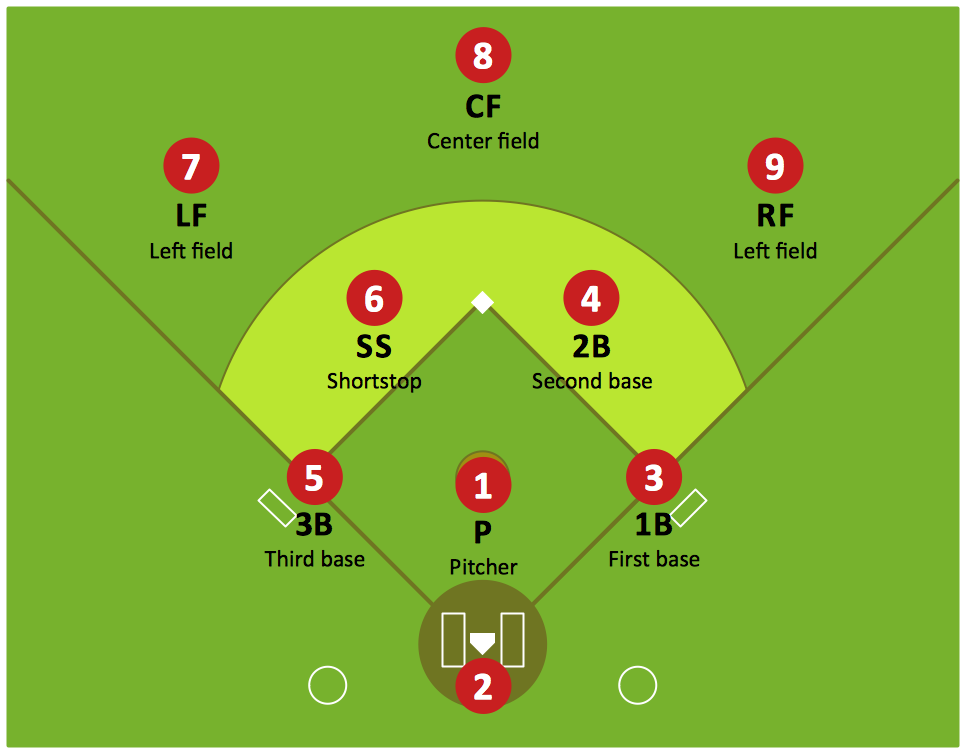
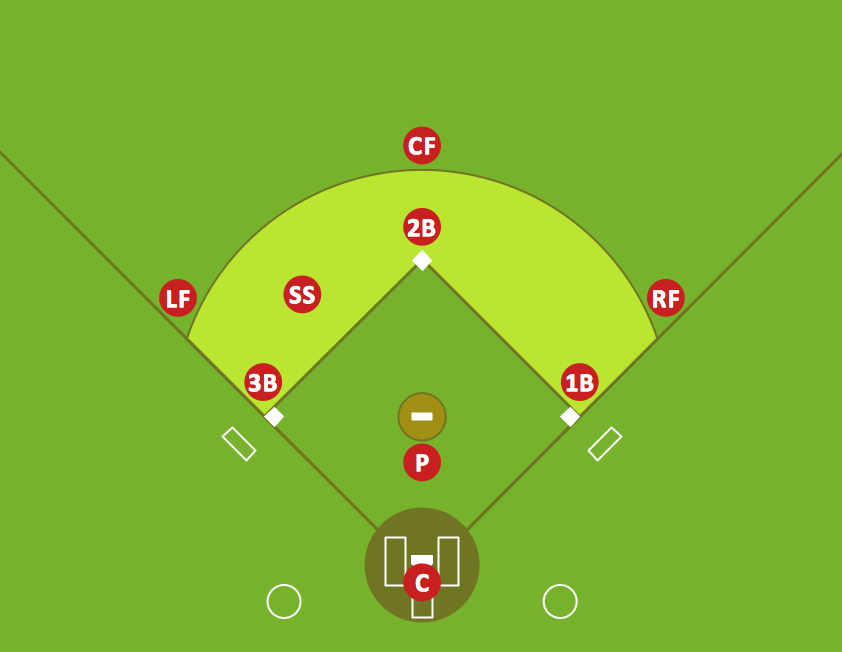
ConceptDraw DIAGRAM extended with the Baseball solution is a powerful tool for designing baseball diagrams and explaining infield positioning for various baseball situations.
Baseball solution from the Sport Area provides the “Baseball Fields” and “Baseball Positions” libraries with large quantity of vector objects that will help you create quick and easy any baseball infield positioning diagram. Simply follow the next steps:
- Drop a field object from the "Baseball Fields" library to your document;
- Drop the position objects from the "Baseball Positions" library on the field object and arrange them according to the infield position that you want to present.
- Add arrows or text labels if needed.
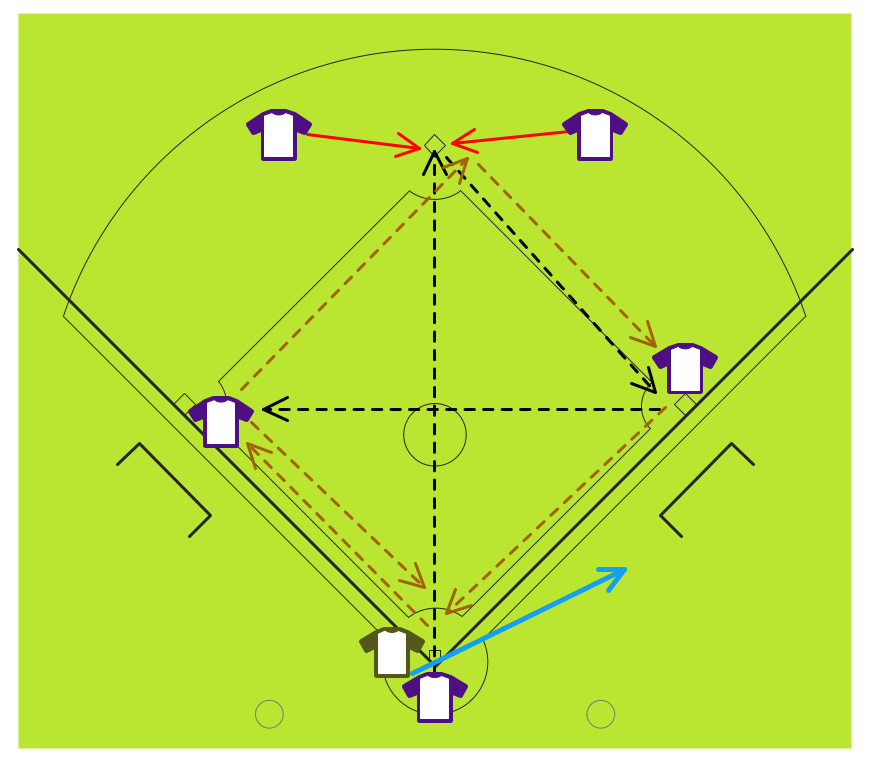
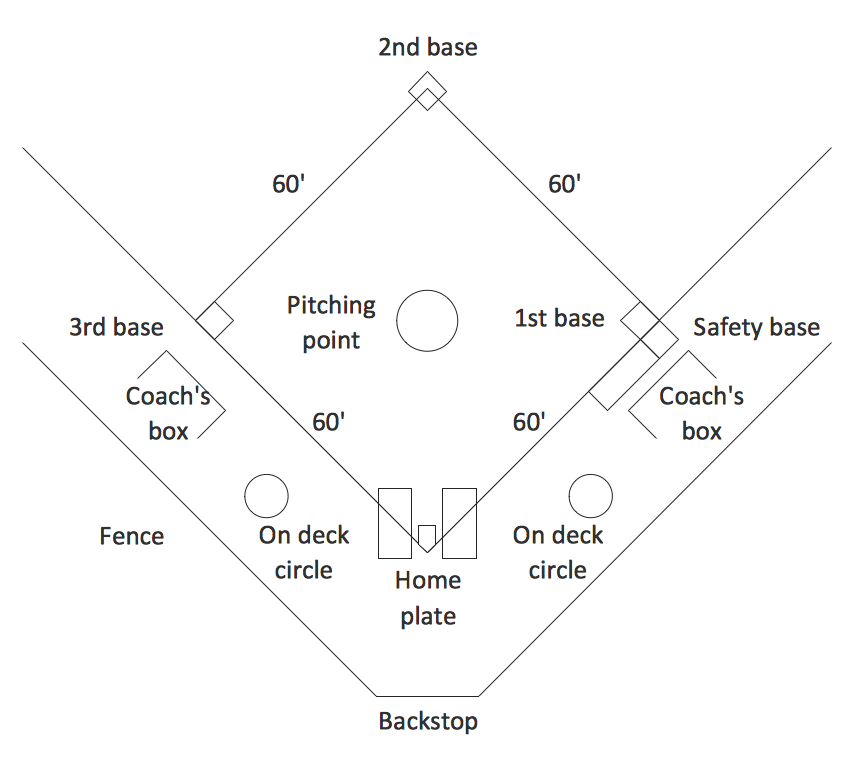
Sample 1. Infield positioning for baseball situations.
This diagram was created in ConceptDraw DIAGRAM using the “Baseball Fields” and “Baseball Positions” libraries from the Baseball solution. An experienced user spent 5 minutes creating this sample.
Use the Baseball Solution for ConceptDraw Solution Park to design your own infield positioning diagrams for different baseball situations.
All source documents are vector graphic documents. They are available for reviewing, modifying, or converting to a variety of formats (PDF file, MS PowerPoint, MS Visio, and many other graphic formats) from the ConceptDraw STORE. The Baseball Solution is available for all ConceptDraw DIAGRAM or later users.