Baseball Field Schema
"A baseball field, also called a ball field or a baseball diamond, is the field upon which the game of baseball is played. The term is also used as a metonym for baseball park. The starting point for much of the action on the field is home plate, which is a five-sided slab of whitened rubber, 17-inches square with two of the corners removed so that one edge is 17 inches long, two adjacent sides are 8½ inches and the remaining two sides are 12 inches and set at an angle to make a point. Adjacent to each of the two parallel 8½-inch sides is a batter's box. The point of home plate where the two 12-inch sides meet at right angles, is at one corner of a ninety-foot square. The other three corners of the square, in counterclockwise order from home plate, are called first base, second base, and third base. Three canvas bags fifteen inches (38 cm) square mark the three bases. These three bags along with home plate form the four bases at the corners of the infield." [Wikipedia]
ConceptDraw DIAGRAM extended with the Baseball solution provides access to libraries, templates and samples allows creating baseball diagrams and schemas. Fields objects are designed according to real fields dimensions. A set of fields samples includes dimensions. All plays and positions diagrams are available as ready-to-modify samples.
A combination of the "Baseball Fields" and "Baseball Positions" libraries gives you an ability to create a baseball-related drawing in seconds. Follow next steps to create you own baseball schema:
- From the "Baseball Fields" library drop a field object to your document
- From the "Baseball Positions" library drop all positions object you need to your document
- Place positions on the field according to your drawing idea
- Add arrows or text labels if needed.
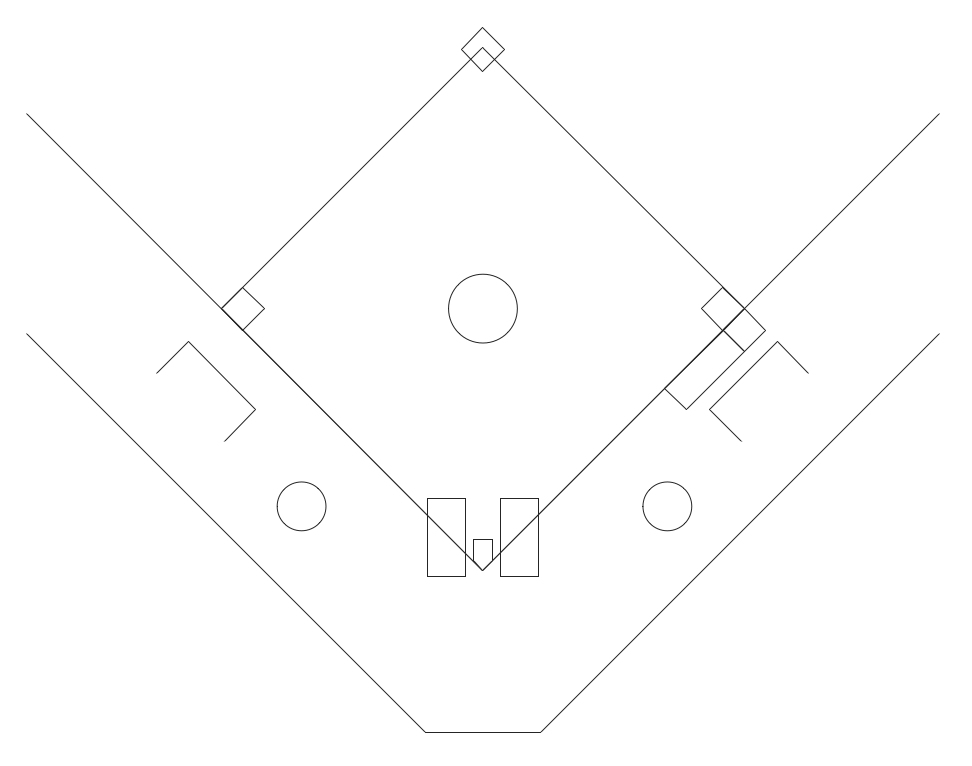
Sample 1. Baseball Field Schema.
This diagram was created in ConceptDraw DIAGRAM using the "Baseball Fields" library from the Baseball solution. An experienced user spent 1 minute creating this sample.
The sample you see on this page was created in ConceptDraw DIAGRAM using the Baseball Solution; it demonstrates a portion of the solution's capabilities and the professional results you can achieve.
All source documents are vector graphic documents. They are available for reviewing, modifying, or converting to a variety of formats (PDF file, MS PowerPoint, MS Visio, and many other graphic formats) from the ConceptDraw STORE. The Baseball Solution is available for all ConceptDraw DIAGRAM or later users.
SEVEN RELATED HOW TO's:
The ER diagram is constructed from the specific ERD graphic elements. There are used 2 types of ERD notations: Chen and Crow's Foot.
A complete set of work flow shapes, notation & symbols for ERD, entity relationship stencils, included in Entity-Relationship Diagram (ERD) solution for ConceptDraw DIAGRAM software, makes drawing diagrams based on ERD notation as smooth as possible.
Picture: Notation & Symbols for ERD
Related Solution:
It’s very important that your soccer drawing looked beautiful, interesting and attracted the attention. For this it is necessary add the illustrations! The Soccer solution delivers several libraries with predesigned bright and interesting clipart objects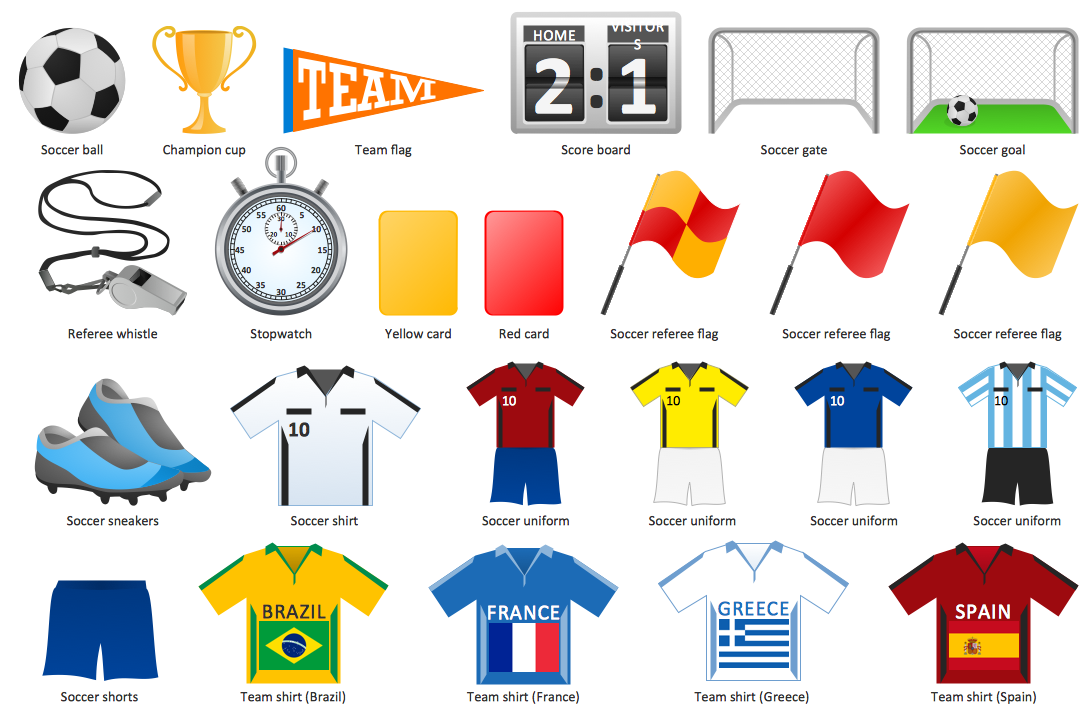
Picture: Soccer (Football) Illustrated
Related Solution:
ConceptDraw DIAGRAM extended with Gym and Spa Area Plans solution from Building Plans area of ConceptDraw Solution Park is ideal software for quick and simple drawing professional looking Gym Floor Plan.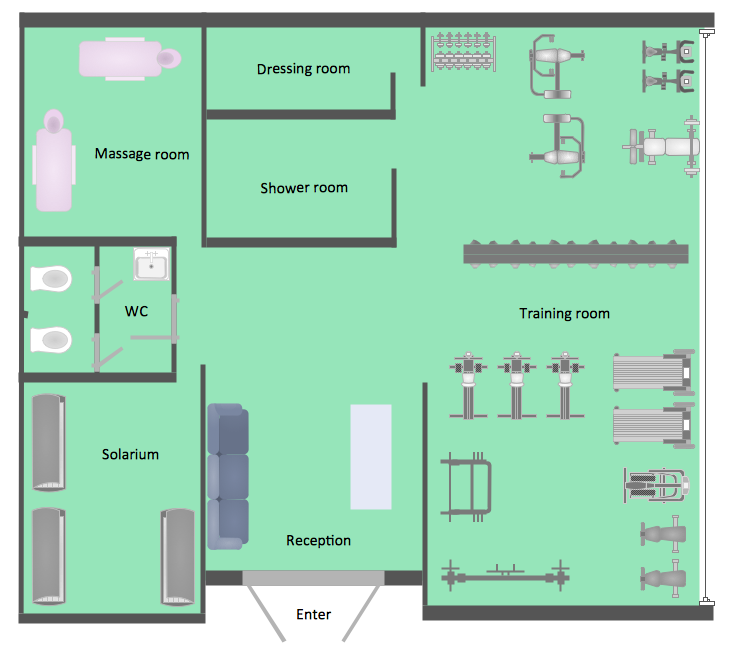
Picture: Gym Floor Plan
Related Solution:
If you are baseball coach or fan, you need convenient and useful software to design the baseball-related diagrams. In this case ConceptDraw DIAGRAM diagramming and vector drawing software is a real godsend for you!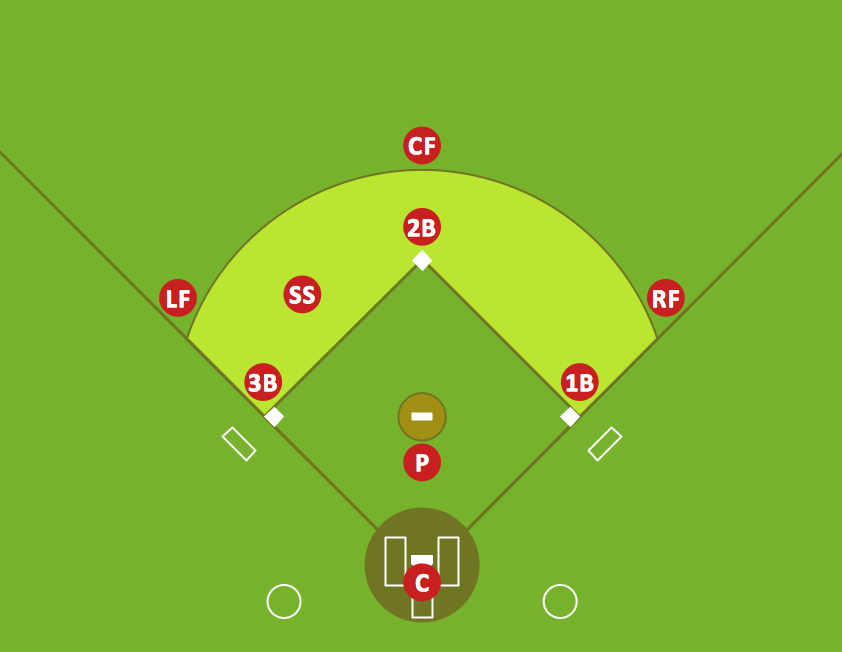
Picture: Infield Positioning for Baseball Situations
Related Solution:
Electrical plan is a document that is developed during the first stage of the building design. This scheme is composed of conventional images or symbols of components that operate by means of electric energy. To simplify the creation of these schemes you can use house electrical plan software, which will not require a long additional training to understand how to use it. You only need to install the necessary software ant it’s libraries and you’ll have one less problem during the building projection.
Any building contains a number of electrical systems, including switches, fixtures, outlets and other lightening equipment. All these should be depicted in a building electrical plans and included to general building documentation. This home electrical plan displays electrical and telecommunication devices placed to a home floor plan. On the plan, each electrical device is referenced with the proper symbol. Electrical symbols are used for universal recognition of the building plan by different persons who will be working on the construction. Not all possible electric symbols used on a certain plan, so the symbols used in the current home plan are included to a legend. The electrical home plan may be added as a separate document to a complete set of building plans.
Picture: How To use House Electrical Plan Software
Related Solution:
Learn the most common process flowchart symbols used in business process diagrams and workflow charts. Includes symbol meanings, examples, and a practical reference table.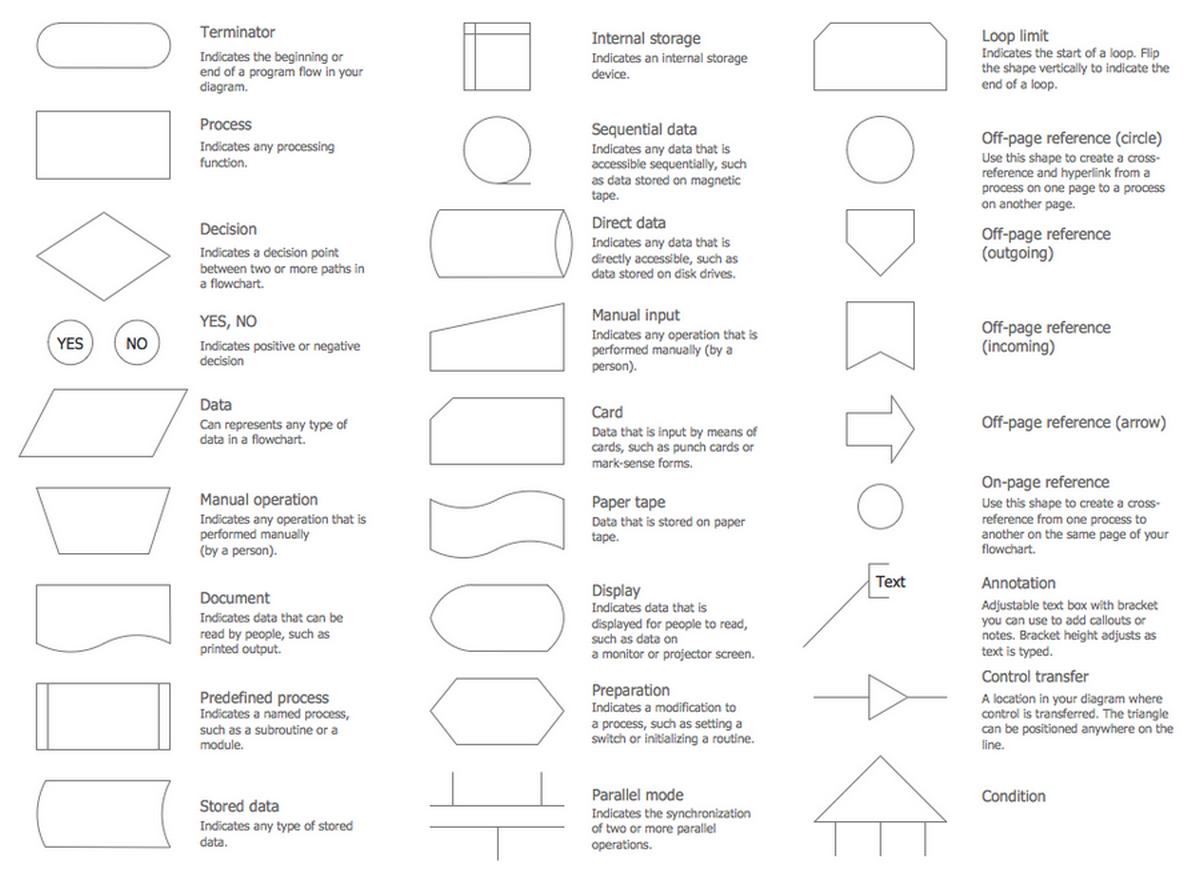
Picture: Process Flowchart Symbols: Meaning, Types and Examples
Related Solution:
This sample shows the Flowchart that displays the process of the achievement the consensus, in other words solving for the acceptable solution.
This Flowchart has start point. The rectangles on it represent the steps of the process and are connected with arrows that show the sequence of the actions. The diamonds with yes/no shows the decisions. The Flowcharts are widely used in marketing, business, analytics, government, politics, engineering, architecture, science, manufacturing, administration, etc.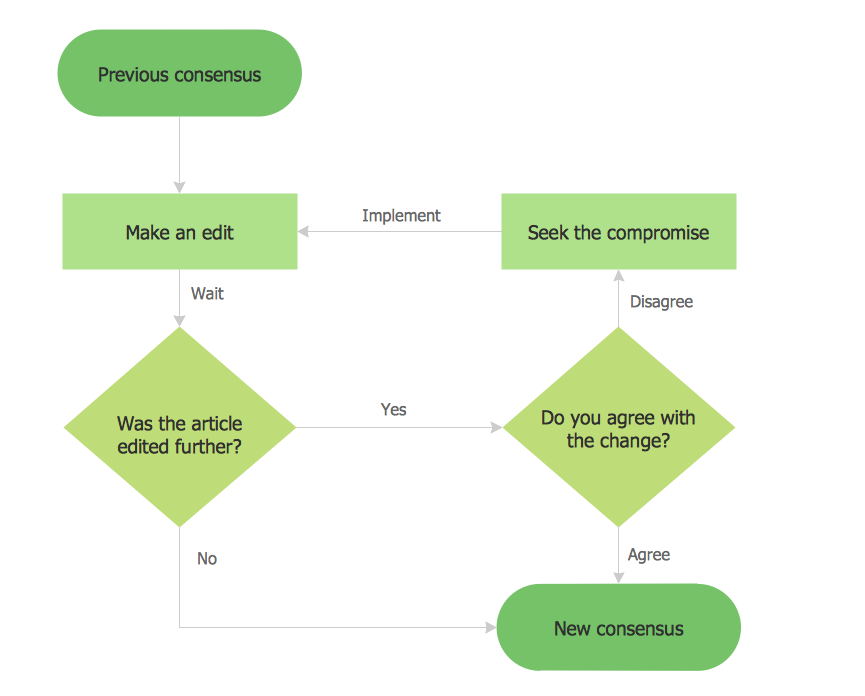
Picture: Example Basic Flowchart. Flowchart Examples
Related Solution: