Baseball DiagramBaseball Field — Corner View — Sample
Baseball is a well-known bat-and-ball sport played between two teams. The game is divided into nine innings and each of them is divided into two halves. Each team includes nine players, who take turns playing offense including batting and baserunning, and defense including pitching and fielding. During one half of the inning, the players of one team attempt to score runs and bat, while the players of the other team attempt to stop the offensive team from scoring. In the other part of the inning, the teams replace positions.
At the game's beginning, the player of the fielding team called the pitcher throws a ball and the battery from the batting team tries to hit it with a bat. When the batter hits the ball in the field, he must throw the bat and run the bases counterclockwise around four bases in order. A run is scored when a runner runs all bases legally, touches them, and returns to home plate. Before the player of the offensive team starts running, the pitcher stands on the pitcher's mound. When a batter begins running, he is called a running batter; after reaching the base, he is declared in safe and becomes a runner, otherwise the referee calls an out, and the player must leave the field and stay dugout. The team with the most runs is the winner.
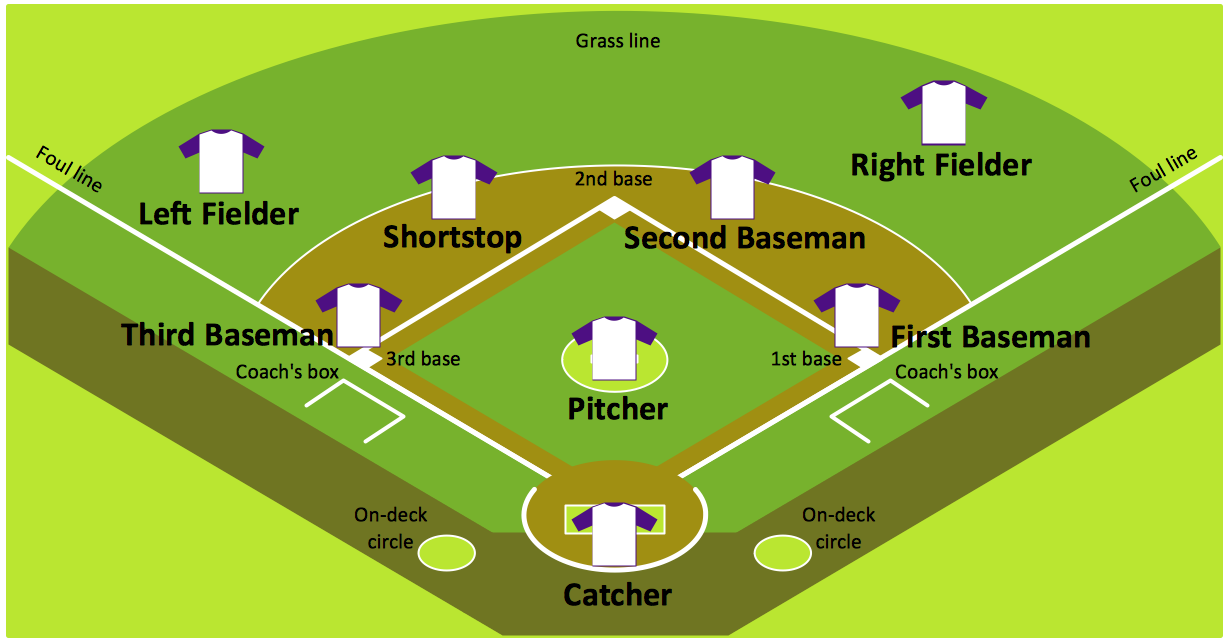
Example 1. Baseball Diagram — Baseball Field — Corner View — Sample
Overview of a Baseball Field Layout
Baseball is played on a diamond-shaped playing field, the four corners of which are the bases. The pitcher is in the middle of the field. The four bases in a baseball game are known as "first", "second", "third" bases, and "home plate".
The first base is the first one of the four existing bases that must be touched by a player on the batting team, so he scores a run. But it is important to take into consideration that the runner cannot be tagged out if he touches the base with any part of his body.
The first baseman is known to be the defensive player, who is responsible for the area near the mentioned above first base. Usually, to become a professional first baseman you should be tall enough as well as a slow runner as a tall first baseman presents a large target to which other fielders can throw, so his height gives him a larger range in catching as well as reaching the errant throws.
The left-handed players are marginally preferable for first base, because it is easier for a left-handed thrower to make the throw to second base and because it is easier for a left-handed fielder to catch a so-called "pick-off" throw from the pitcher and tag the base runner. At the same time, a right-handed first baseman, when setting himself up in order to receive a throw from an infielder, must execute a half-pivot near the base, which is a special move, that a left-hander player should not make.
The infield positions, which are second base, third base, and a shortstop can only be occupied by the right-handed players, because of the time, it takes to pivot and so to set to throw. It usually takes a left-handed thrower more time to make the needed pivot as the time is always critical in this game. There are fewer positions a left-handed player can occupy, so the player has to be always fast enough.
The second base is the second one of all of the four stations on a baseball field which has to be touched in succession by a base runner in order to score a run for this player's team. This base can be defended by the second baseman and by the shortstop. It is also known as the so-called "keystone sack". A runner on this second base is meant to be in the so-called "scoring position", reaching the home plate and scoring a run from the second base on the most base hits. If the runner is touching the base with any part of his body, then he cannot be tagged out.
Usually, if the second baseman as well as a shortstop possess quick hands and quick feet, then they have everything for releasing the ball with accuracy and speed. Both players must communicate well to be able to make a so known-to-be a double play. The second baseman is expected to have particular agility in double play situations that usually force the player to throw first. At the same time, his momentum can carry him in the opposite direction.
The third base is number three on a list of all four bases, which a base runner must touch in order to score a run. Many batted balls may allow this runner to reach a home plate and so to score a run from this third base, but being on this base, the runner is valuable to the batting team, when less than two "outs" are recorded. If the runner is touching the base with any part of his body, then he cannot be tagged out.
The third baseman is the defensive player: his responsibility is to defend the area nearest to the third base. Usually, all third basemen have a very good as well as very quick reaction to the batted balls. They also are known to have strong arms in order to make the long throws to the first base.
The so-called home plate is the last of the bases that each player must touch in order to score. This plate looks like a five-sided slab of whitened rubber, being set at ground level.
Dimensions and Measurements of a Baseball Field
Baseball playing field consists of two parts: the infield and outfield, and can vary significantly in size. This is the difference between the baseball fields and those in other sports. At the same time, the MLB (Minor League Baseball) set the size and shape of the outfield for professional teams. The field covers an area of about 1 ha and has the shape of a circle's sector with a radius of up to 175 m. A minimum distance from home plate to the fences in the left and right field is 99 m and 122 m to the center. The bases have a diamond form of 27,4 m long. The distance from home plate to the pitcher's mound is 18 m. The diameter of the pitcher's mound is 5,49 m and its height is 45 cm.
The dimensions of the home plate are 43,2 cm across the front with a triangular rear of two sides of 30,5 cm and 21,6 cm down each side, having the rear edges at 45 degrees to the sides, making a point at the back. The home plate is colored white and is surrounded by a black strip of 1,9 cm in width, sitting entirely in a so-called "fair" territory with the right and left field foul lines aligned with the two rear edges. Looking at the angle as well as the length of such home plate, it is obvious that this base is not in the shape of a regular pentagon as it is a 43,2 by 21,6 cm rectangle with an isosceles triangle of base of 43,2 cm and the equal sides of 30,5 cm each, being attached to the back.
The "backstop" is a so-called 15 to 30 m zone behind the home plate, which is usually either a wall or a fence. This border is there for the reason to stop the passed balls and the foul balls and, sometimes, the so-called "wild pitches", which are the charged against a pitcher in cases when his pitches are too high, too wide, or too short of home plate for the catcher to control, which may lead to allowing a baserunner to advance.
The mentioned nuances of the game of baseball and many more other ones can be found in more detail on the Internet. Once you decide to create your own baseball field layout, then there is the Baseball solution available for all ConceptDraw DIAGRAM users. It can be found both on this site and in ConceptDraw STORE.

Example 2. Baseball Field Dimensions
Impact of Field Dimensions on Game Strategy
The geometry and dimensions of the baseball field greatly influence both offensive and defensive play, players positioning and game strategy, and the way players throw and hit the ball, and run the bases. Based on field dimensions, pitchers also vary their strategies. The statistic shows that even changes in dimensions during the stadium renovation or remodeling can affect the players' batting success. The probability of hits falling into gaps is increased on the large fields and the games here are highly scored. The play of contact hitters is often successful on the large fields. Short fences in baseball fields impact more home runs and line drives, therefore here the power hitters are favorable.
The physical requirements for the players also significantly differ and often the game on the larger outfields is more successful for faster players with strong arms and athletic characteristics to prevent extra-base hits. The decisions taken in a baseball game and based on the field dimensions are usually more informed and successfully affect the game flow and strategy. They help teams to maximize their strengths and the opponents' weaknesses to their advantage. However, other factors like, for example, weather, altitude, and some others also have value for the baseball game.
Baseball Field — Corner View
The corner view of a baseball field offers the best perspective and helps to capture the nuances and dynamics of a baseball game. It is so in any situations, when you are in a stadium looking at the game or observing broadcasting or saved video, snapshots or diagrams. It provides a close-up experience of the game This perspective allows fans to appreciate the full scope of the baseball field and follow the flow of the game without turning their heads. It is also ideal to notice the unique features of the baseball field, the foul lines, and distances to the outfield fences, to observe the runners' movements and decisions of players, and how they round the bases. It is especially good for viewing plays at first and third base, teamwork, coordination, and skills of players.
From this perspective, it is possible to observe the base coaches, track their signals and decisions, which substitutions they make, how interact with players, and how players respond to their signals and instructions. This provides deeper insight into the team’s offensive strategies and insights into the work of coaches, pitchers, and other players. The baseball field corner view allows you to observe the batter’s stance and swing, actions of outfielders, trajectory, and speed of ground balls hit to the infield, foul territory play, line drives and bunt coverage, defensive and offensive insights, and players' reactions to different situations.

Example 3. Baseball Solution
How to Draw the Baseball Diagrams Using ConceptDraw DIAGRAM Software
Having ConceptDraw DIAGRAM software as well as the ConceptDraw STORE application means having enough to create the needed floor plan for the baseball field. The tools provided in the Baseball solution are the design elements for drawing of baseball field, examples, and templates of the previously created field plans, which all can be used as a base for making your own great-looking plans yourself.
In case you need software that allows using the pre-made stencils and the samples, then ConceptDraw DIAGRAM is the best choice for this case. A combination of the "Baseball Fields" and "Baseball Positions" libraries gives you an opportunity to create baseball field layout and positions diagram and other baseball-related drawings in only a few hours or even minutes, so it is always beneficial to have this application on your desktop and the needed solution for making different plans of the baseball field, including the corner view of the baseball field.
A combination of the "Baseball Fields" and "Baseball Positions" libraries gives you an ability to create a baseball-related drawing in seconds. Follow the next steps to create your own baseball schema or baseball field layout diagram:
- From the "Baseball Fields" library drop a field object to your document.
- From the "Baseball Positions" library drop all positions objects you need to your document.
- Place positions on the field according to your drawing idea.
- Add arrows or text labels if needed.

Example 4. ConceptDraw DIAGRAM Template — Corner View Baseball Field
Benefits of Using ConceptDraw DIAGRAM for Baseball
ConceptDraw DIAGRAM software is convenient for designing various schematics and diagrams applicable in baseball, to explain the rules and players' positions on the baseball field diagram, show field dimensions, and model different situations that can occur on the baseball field. All drawings, schematics, diagrams, and infographics created in ConceptDraw DIAGRAM are useful to be used in presentations, documents, and publications. They are scalable vector graphics that allow using them for any kind of presentation needs. ConceptDraw DIAGRAM software allows you to change any baseball diagram, sketch of baseball field, or baseball diagram with positions easily and export your ConceptDraw DIAGRAM documents to different formats and also in MS PowerPoint, which is a popular tool for performing presentations that you can then present as is or continue working on them using MS PowerPoint tools.

Example 5. Baseball Infographic — Basic Bunt Coverage: Runner at 2nd
Examples
Each baseball field sample, baseball position chart and other baseball example you see on this page was created in ConceptDraw DIAGRAM software using the Baseball solution and is also included in this solution and available from ConceptDraw STORE. All source documents are vector graphic documents. They demonstrate a portion of the solution's capabilities and the professional results you can achieve. They are available for reviewing, modifying, or converting to a variety of formats: PDF file, MS PowerPoint, MS Visio, and many other graphic formats.
Use the baseball drawings and diagrams designed in ConceptDraw DIAGRAM to learn the play positions, analyze the play of individual players on the field and specific game situations, players' individual variations by hitting style, educate beginners, track changes after the field's remodeling, and many other goals.