
Example 1. Pie Donut Chart
Using the Pie Charts Solution for ConceptDraw DIAGRAM you can create your own professional looking Pie Donut Chart Diagrams quick and easy.
The Pie Donut Charts produced with ConceptDraw DIAGRAM are vector graphic documents and are available for reviewing, modifying, and converting to a variety of formats (image, HTML, PDF file, MS PowerPoint Presentation, Adobe Flash or MS Visio).
Free Download Pie Chart Software and View All Examples and Templates
See also Samples:
TEN RELATED HOW TO's:
In your work activity you need regularly draw the line graphs? And each time you ask yourself a question How to Draw a Line Graph easier and faster?. The desire to automate the line graphs drawing process led to the creation of Line Graphs solution from Graphs and Charts area of ConceptDraw Solution Park.
Picture: How to Draw a Line Graph
Related Solution:
Perfect charts and graphics diagramming software with rich examples and template. ConceptDraw is ideal to draw Charts and Graphics.
Picture: Basic Diagramming
Related Solution:
This sample shows the Pie Donut Chart. It was created in ConceptDraw DIAGRAM diagramming and vector drawing software using the ready-to-use object from the Pie Charts Solution from Graphs and Charts area of ConceptDraw Solution Park.
The Pie Donut Chart visualizes the percentage of parts of the whole and looks like as a ring divided into sectors. Pie Donut Charts are widely used in the business, statistics, analytics, mass media.Picture: Pie Donut Chart. Pie Chart Examples
Related Solution:
ConceptDraw DIAGRAM software extended with the Football solution delivers samples with diagrams of the most popular offenses in American Football. You can complete this set modifying any sample. All you need is to drag and drop objects to depict another offense and then save with the different name. Feel free to add text label with the offense name directly to your document.-Sample.png)
Picture: I Formation (Offense) Diagram
Related Solution:
Easy charting software comes with beautiful chart templates and examples. This makes it easy to create professional charts without prior experience.
Picture: Chart Templates
Explaining offensive strategies of American Football is practically impossible without drawing a diagram. If you need to do this more than once you have to choose an appropriate tool allows you to change diagrams easily. ConceptDraw DIAGRAM extended with the Football Solution is the best choice for this case.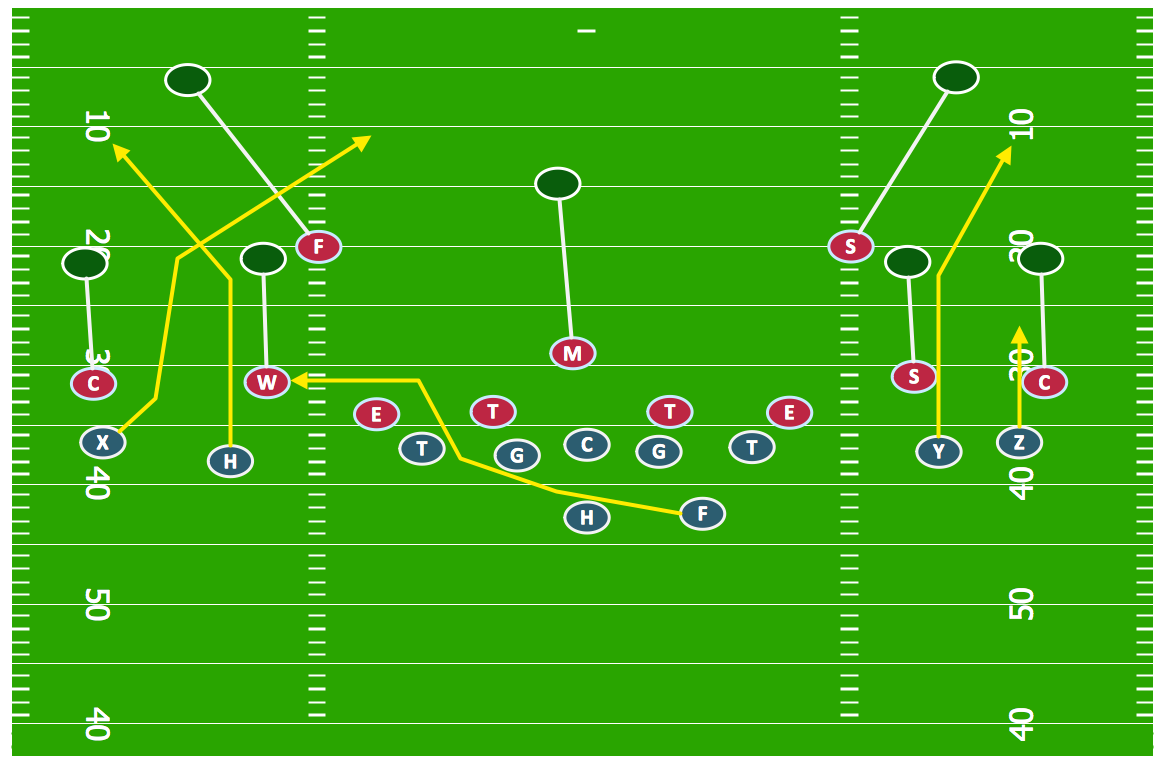
Picture: Offensive Strategy — Spread Offense Diagram
Related Solution:
Design efficiently the technical flow charts in ConceptDraw DIAGRAM software for various fields and provide ✔️ clarity, ✔️ accuracy, ✔️ usability, ✔️ simple communication, analysis, and improvement
Picture: Technical Flow Chart Example
Related Solution:
Using diagrams is the easiest way to explain the soccer formations. The Soccer solution from the Sport area of ConceptDraw Solution Park is designed as a tool that helps you produce the soccer diagrams in a few minutes. The predesigned samples of the Soccer solution for ConceptDraw DIAGRAM depict the most popular formation diagrams.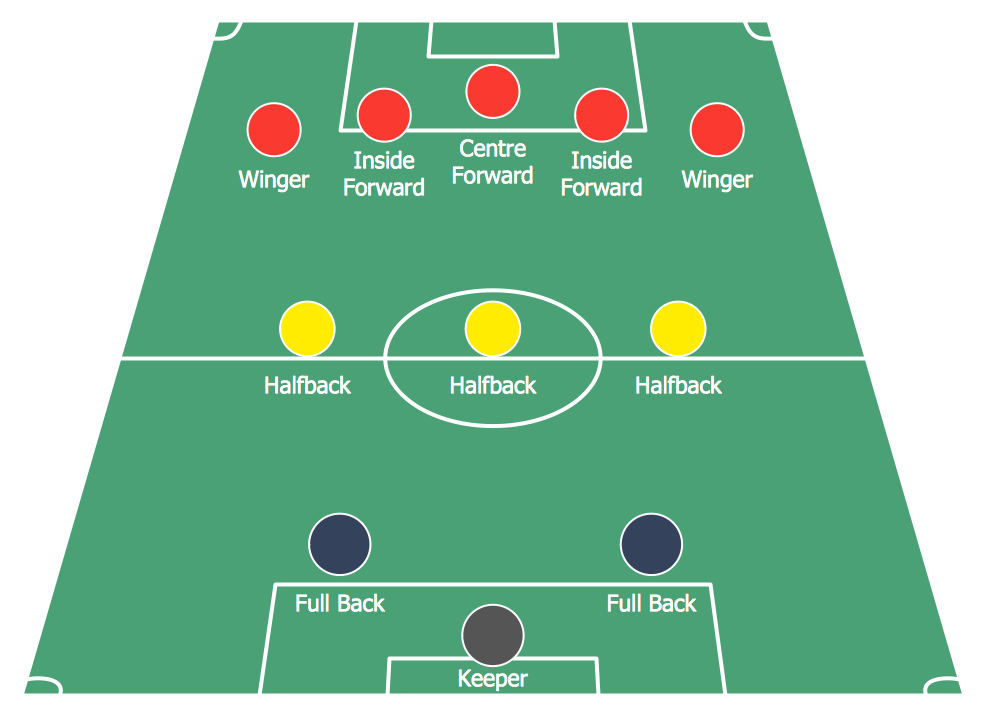
Picture: Soccer (Football) Formation
Related Solution:
All these bar chart templates are included in the Bar Graphs solution.
You can quickly rework these bar graph templates into your own charts by simply changing displayed data, title and legend texts.
Picture: Bar Chart Template for Word
Related Solution:
The Flowcharts are widely used in engineering, architecture, science, analytics, government, politics, business, marketing, manufacturing, administration, etc.
Picture:
Flowchart of Products
Flowchart Examples
Related Solution: