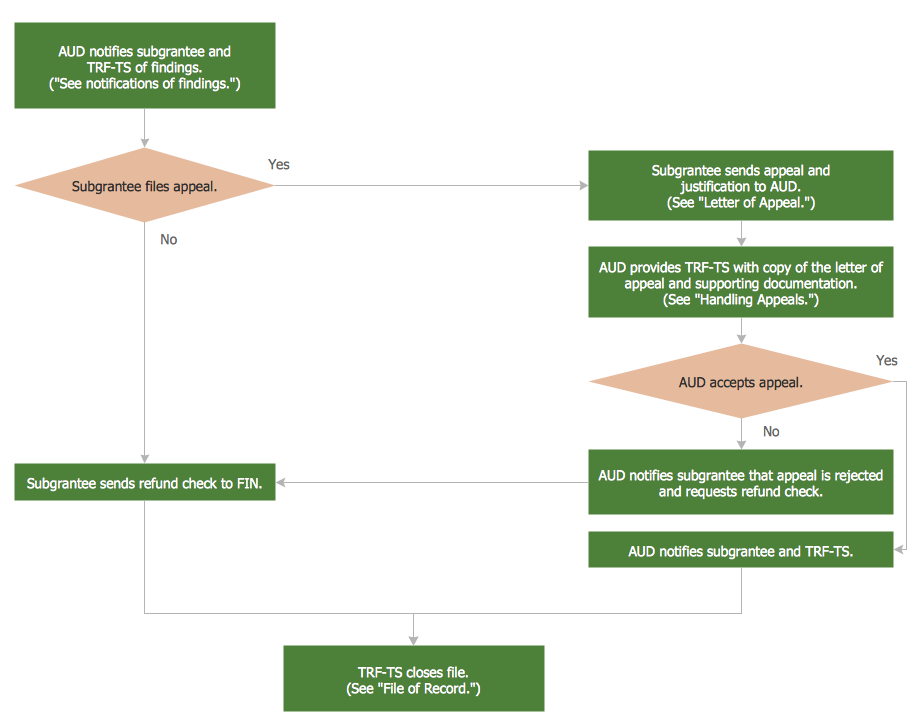
Example 1. Auditing Standards
Thanks to the useful tools of Audit Flowcharts Solution you can demonstrate the auditing standards literally in a few minutes. Ready-to-use vector shapes from the Audit Flowcharts library will effectively help you.

Example 2. Audit Flowcharts Solution in ConceptDraw STORE
Pay also your attention on the collection of samples included in the Audit Flowcharts Solution. They are different and well thought-out examples which can effectively help in the Audit Flowcharts self-dependent drawing.

Example 3. Audit Flowchart Template
The auditing standards sample and audit flowchart template you see on this page were created in ConceptDraw DIAGRAM using the tools of Audit Flowcharts Solution for ConceptDraw Solution Park. An experienced user spent 10 minutes creating every of these samples.
Use the Audit Flowcharts Solution for ConceptDraw DIAGRAM software to quick, easy and effective design the flowcharts illustrating various auditing standards.
All source documents are vector graphic documents. They are available for reviewing, modifying, or converting to a variety of formats:
- PDF file,
- MS PowerPoint,
- MS Visio,
- and many other graphic formats
from the ConceptDraw STORE. The Audit Flowcharts Solution is available for all ConceptDraw DIAGRAM or later users.
EIGHT RELATED HOW TO's:
The Flowchart is a very popular type of diagram, it is widely used for analyzing, designing, managing and visualizing the business and technical processes, various software algorithms. But how to create Flowchart quick and easy?
Flowcharts solution from the Diagrams area of ConceptDraw Solution Park helps you to design the professional looking Flowchart Diagrams quick and easy using the ConceptDraw DIAGRAM diagramming and vector drawing software.
Picture: Create Flowchart - Making a Flowchart
Related Solution:
ConceptDraw DIAGRAM is a best business processes modeling software for graphical documenting processes of the company.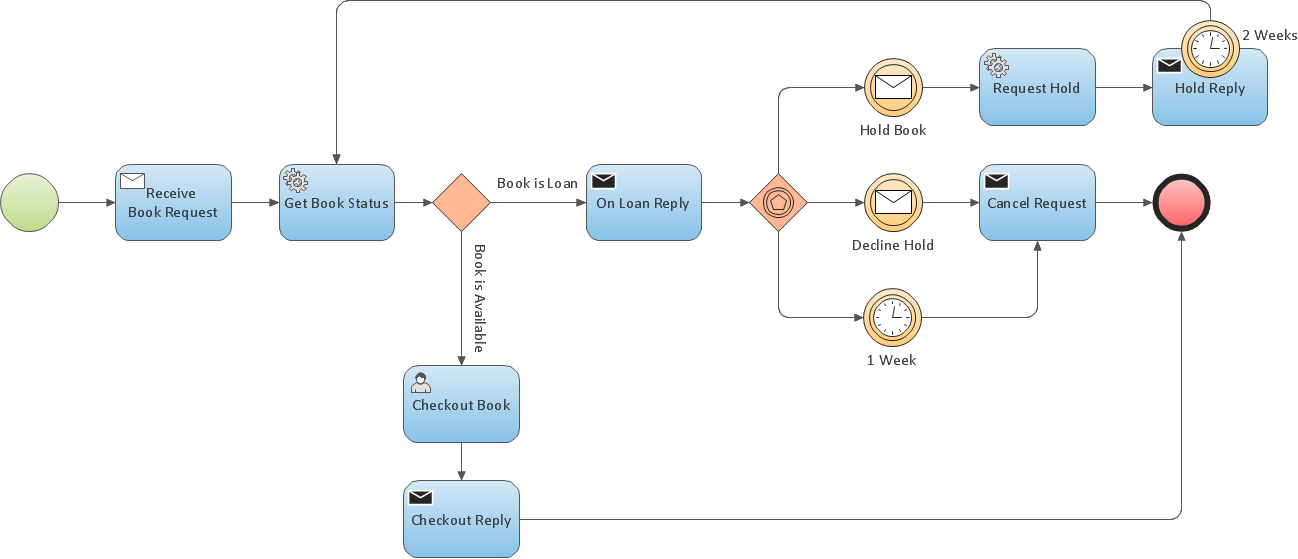
Picture: Business Process Modeling Resume
To create an Audit Process FlowChart you only need Conceptdaw Software.
Picture: Basic Audit Flowchart. Flowchart Examples
Related Solution:
When trying to figure out the nature of the problems occurring within a project, there are many ways to develop such understanding. One of the most common ways to document processes for further improvement is to draw a process flowchart, which depicts the activities of the process arranged in sequential order — this is business process management. ConceptDraw DIAGRAM is business process mapping software with impressive range of productivity features for business process management and classic project management. This business process management software is helpful for many purposes from different payment processes, or manufacturing processes to chemical processes. Business process mapping flowcharts helps clarify the actual workflow of different people engaged in the same process. This samples were made with ConceptDraw DIAGRAM — business process mapping software for flowcharting and used as classic visio alternative because its briefly named "visio for mac" and for windows, this sort of software named the business process management tools.
This flowchart diagram shows a process flow of project management. The diagram that is presented here depicts the project life cycle that is basic for the most of project management methods. Breaking a project into phases allows to track it in the proper manner. Through separation on phases, the total workflow of a project is divided into some foreseeable components, thus making it easier to follow the project status. A project life cycle commonly includes: initiation, definition, design, development and implementation phases. Distinguished method to show parallel and interdependent processes, as well as project life cycle relationships. A flowchart diagram is often used as visual guide to project. For instance, it used by marketing project management software for visualizing stages of marketing activities or as project management workflow tools. Created with ConceptDraw DIAGRAM — business process mapping software which is flowcharting visio alternative or shortly its visio for mac, this sort of software platform often named the business process management tools.
Picture: Process Flowchart: A Step-by-Step Comprehensive Guide
Related Solution:
Audit Steps - The auditing process is an independent examination of data, statements, operations, records, financial or otherwise performances of an enterprise for any stated purpose. It is a complex process that includes 10 audit steps: Notification, Planning, Opening Meeting, Fieldwork, Communication, Draft Audit, Management Response, Final Meeting, Report Distribution, Feedback.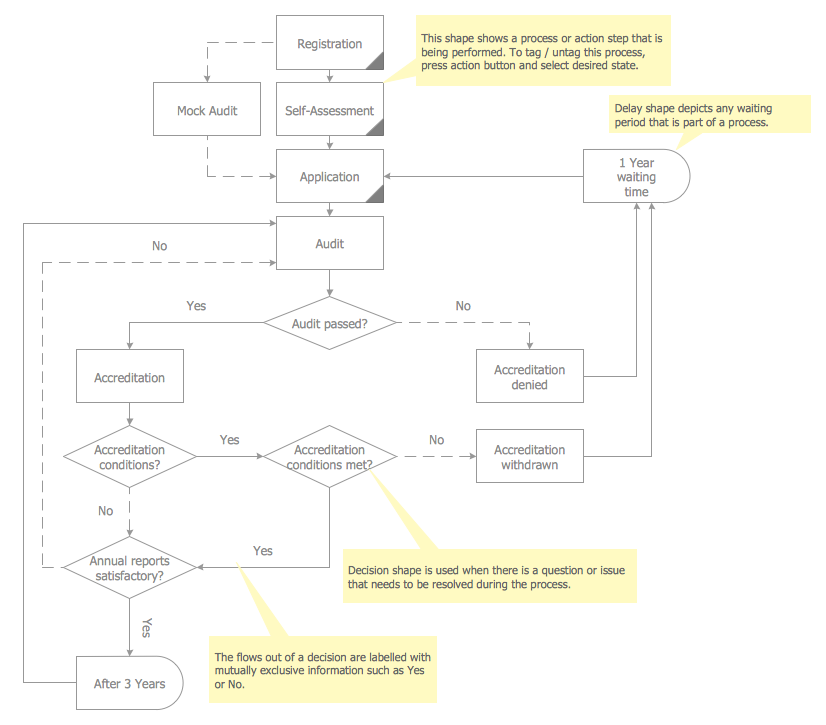
Picture: Audit Steps
Related Solution:
ConceptDraw DIAGRAM is a professional software for creating great looking flowcharts. The samples included in this set of software allows users to draw any type of flowchart.
Picture: Flowchart Process Example
Related Solution:
Auditing Process, Audit Planning Process - The audit is complex process of independent examination of data, statements, operations, financial performances of an enterprise for a stated purpose. The auditing process consists of defined quantity of audit steps. Planning is fundamental stage of auditing process. The carefully thought-out audit planning process ensures the success of the business project.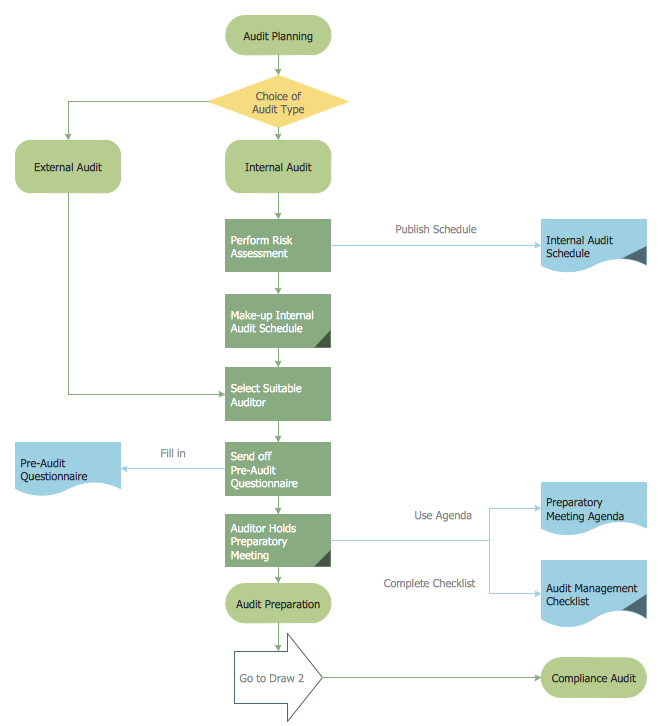
Picture: Auditing Process. Audit Planning Process
Related Solution:
An example flowchart of marketing analysis shows main steps you have to challenge writing a marketing analysis.
Picture: Flowchart Example: Flow Chart of Marketing Analysis
Related Solution:

