Accounting Flowchart Purchasing Receiving Payable and Payment
Standardized Symbols Used in The Accounting Flowchart
Accounting flowchart is a pictorial way to represent the flow of data in an organization and the flow of transactions process in a specific area of its accounting or financial department. Use of accounting flowchart is effective tool for gaining quantitative information about the finances and visualization accounting procedures and processes.
ConceptDraw DIAGRAM diagramming and vector drawing software enhanced with Accounting Flowcharts solution from the Finance and Accounting area of ConceptDraw Solution Park offers powerful tools for easy designing professional-looking Accounting Flowcharts of any complexity.
Accounting Flowcharts solution contains the full set of standardized accounting flowchart symbols which will help you design in minutes various types of Accounting Flowcharts including such popular diagrams which represent the whole accounting process: Purchasing Flowchart, Receiving Flowchart, Voucher Payable Flowchart, Treasurer Flowchart, Payment Flowchart.

Example 1. Standardized Accounting Flowchart Symbols
These and other accounting flowchart symbols are vector and are offered by Accounting Flowcharts library for Accounting Flowcharts Solution. Thanks to them the process of flowcharts design is extremely easy, moreover all Accounting Flowcharts created in ConceptDraw DIAGRAM are vivid, colorful, attractive, and will have a great success when used in reports, discussions, presentations, meetings, datasheets, posters, whitepapers, etc.
Flowchart for Purchasing
The Flowchart for Purchasing is a process of providing organization or enterprise of raw, materials, components, equipment, tools, etc. The Accounting Flowchart for Purchasing visually represents step by step the flow of transaction process at the purchasing area. It lets better understand and clarify the process of purchasing for your colleagues and suppliers, with a goal to effectively coordinate procurement and delivery.

Example 2. Flowchart for Purchasing
Thanks to ConceptDraw DIAGRAM software you can focus on the purchasing process at your company, not on the drawing process. Simply drag ready-to-use vector standardized accounting flowchart symbols from the Accounting Flowcharts to your document page and arrange them to create your Accounting Flowchart without efforts.
Flowchart for Receiving
The Flowchart for Receiving represents flow of processes in the receiving area. It is a common sequences of actions for accepting the goods according to the purchase order, accounting and creating reports on receipt. Next, we proceed to the next stage - vouchers payment.

Example 3. Flowchart for Receiving
Designing your Accounting Flowcharts you need to strive to make them bright and attractive, apply the formatting for the diagram objects, use the Line, Fill, Shadow and Text tools from the Home toolbar at the ConceptDraw DIAGRAM program.
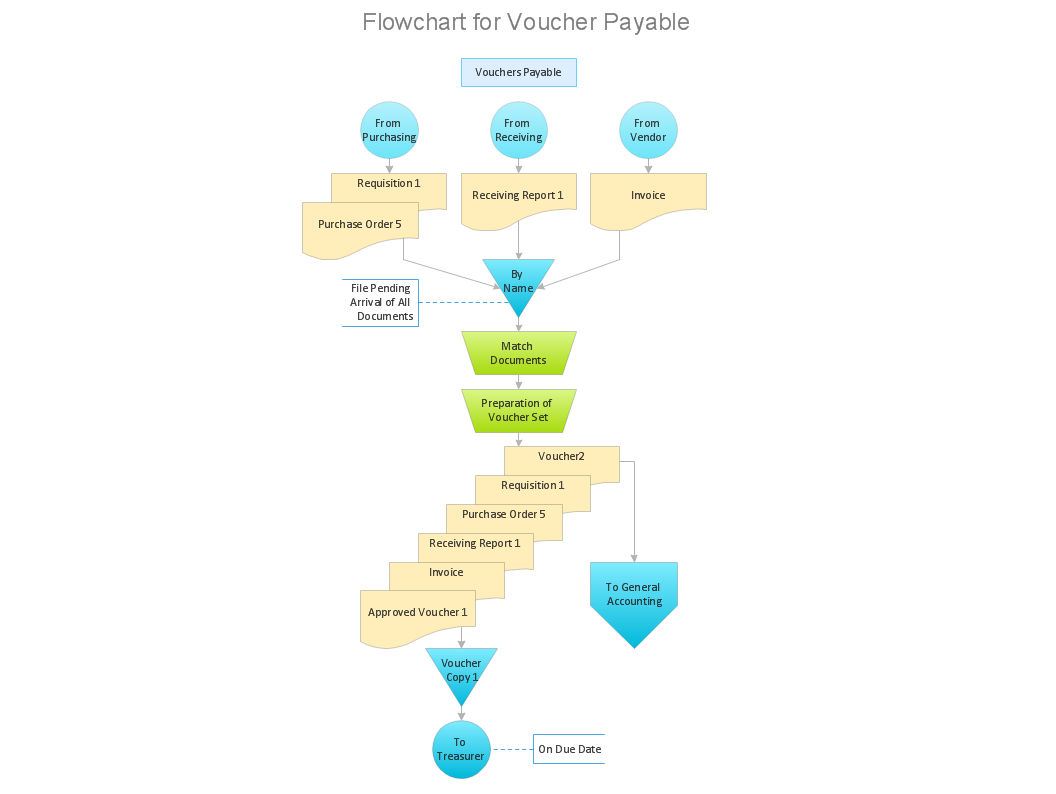
Flowchart for Voucher Payable
The Flowchart for Voucher Payable represents flow of transaction in the accounts payable area and lets to track all purchases and outgoing expenses. Effective management of voucher processing has important value in organization's work. You need create a voucher before the payment to your suppliers. It is necessary to implement the accurate accounting of all vendors, orders, payments, payment parameters, remittances, prices, discounts, and other charges.

Example 4. Flowchart for Voucher Payable
The Rapid Draw functionality of ConceptDraw DIAGRAM software is also useful and lets to add new objects with a single click using the Rapid Draw arrows. Activate the Rapid Draw tool from the Shape toolbar, the arrows will appear when dragging the mouse on the object.
Flowchart for Treasurer
TheFlowchart for Treasurer represents detailed description of the processes for the treasure area. The treasurer of an organization accumulates the information about all financial operations and transactions, presents the reports about starting balance, income and expenses, cash balance, deviations from anticipated amounts. The main goal of these reports is to make sure in correctness and reasonableness of accepted financial decisions.

Example 5. Flowchart for Treasurer
You will also receive a benefit from the possibility to use the grid, rules and guides. You can also align and group the diagram objects to make your diagram accurate and exceptionally looking.
Flowchart for Payment
The Flowchart for Payment is a step by step representation the flow of processes for payment purposes. The payment process includes the sale transaction, the offering the invoice or the bill by the seller to the buyer and the payment of this invoice. The advantage of flowchart is that it lets much easier the understanding of processes, it represents the process steps using the standardized accounting flowchart symbols and indicates the sequence of stages by the arrows.

Example 6. Flowchart for Payment
According to your desire, you can create all these Accounting Flowcharts for Purchasing, Receiving, Voucher Payable, Treasurer and Payment as the separate documents, or as a multi-page ConceptDraw document.
When your Accounting Flowchart will be ready, you can export it to a number popular file formats, such as Microsoft PowerPoint (PPT), Adobe Acrobat (PDF), Microsoft Visio (VDX, VSDX), HTML, and many other formats.