Audit Steps
The auditing process is an independent examination of data, statements, operations, records, financial or otherwise performances of an enterprise for any stated purpose. It is a complex process that includes 10 audit steps:
- Notification
- Planning
- Opening Meeting
- Fieldwork
- Communication
- Draft Audit
- Management Response
- Final Meeting
- Report Distribution
- Feedback
The auditors should follow attentively step-by-step this list and the result will be a final audit report with the recommended changes. After that the company implements the offered methods to improve the business process effectiveness and auditors review, test the quality and effects of the implemented changes, and then start the next cycle of audit steps.

Sample 1. Audit Steps
ConceptDraw DIAGRAM diagramming and vector drawing software offers you the Audit Flowcharts Solution from the Finance and Accounting Area with useful tools, library of vector audit flowchart symbols, template and a set of samples that will help auditors create visual and clear audit flowchart, audit process flowchart, chart audits in minutes.
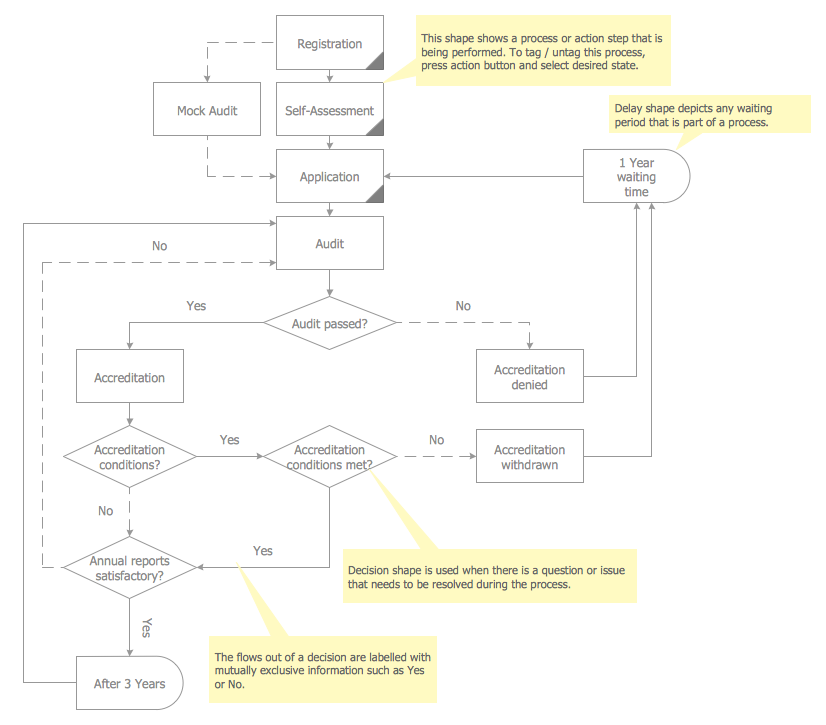
Sample 2. Audit Flowchart Template
This template was created in ConceptDraw DIAGRAM using the Audit Flowcharts library from the Audit Flowcharts Solution and shows the sequence of actions in auditing process – the audit steps. It is convenient to use the predesigned templates from the Audit Flowcharts Solution as the base for your own professional looking audit flowcharts.
The Audit Flowcharts produced with ConceptDraw DIAGRAM are vector graphic documents and are available for reviewing, modifying, and converting to a variety of formats (image, HTML, PDF file, MS PowerPoint Presentation, Adobe Flash or MS Visio).
TEN RELATED HOW TO's:
This sample was created in ConceptDraw DIAGRAM diagramming and vector drawing software using the Flowcharts solution from the Diagrams area of ConceptDraw Solution Park.
This sample shows the Flowchart of the Subprime Mortgage Crisis. This Flowchart describes the decline in housing prices when the housing bubble burst and what it caused on the housing and financial markets. You can also see the Government and Industry responses in this crisis situation.
Picture: Flowchart on Bank. Flowchart Examples
Related Solution:
The app's user interface is everything what user see and interact with on its electronic device. Great number of touch screen smartphones and tablets now work under the Linux-based Android operating system.
Android UI design is a daunting process which requires certain knowledge, abilities and skills from Android developers and designers. Now it is available the special Android UI design tool - ConceptDraw DIAGRAM diagramming and vector drawing software supplied with Android User Interface Solution from the Software Development Area of ConceptDraw Solution Park.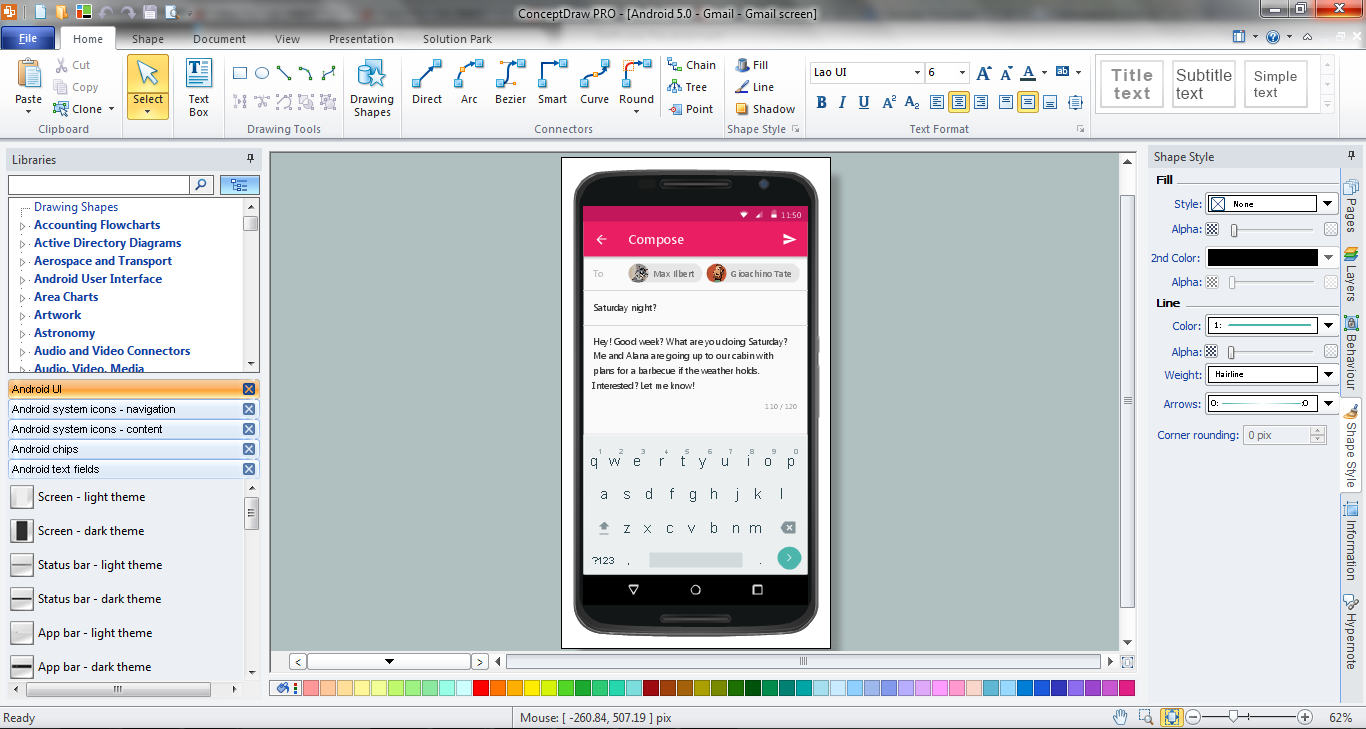
Picture: Android UI Design Tool
Related Solution:
A competent delegation of responsibilities between workers guarantees business success in most cases. At first sight, it might seem that workflow diagram symbols are quite similar to a regular flowchart. But workflow diagram is a more accurate way to present working processes.
Workflow diagrams are helpful for a working process analyzation, to depict a pathway of process issues, personalize responsibilities and identify resources that will help to optimize a workflow. Generally, Workflow diagram deploys flowchart symbols for displaying work process steps and relationships. But, often it require some additions and improvements to become more professional and illustrative. The Workflow solution for ConceptDraw DIAGRAM provides the user with a big library of symbols that are designed especially for workflow diagrams.
Picture: Workflow Diagram Symbols
Related Solution:
Account Flowchart Stockbridge System
Flowchart Examples →
Once you decide to create a flowchart mentioning all the processes , you can always use well as professionally software — ConceptDraw
Picture:
Account Flowchart Stockbridge System
Flowchart Examples
Related Solution:
ConceptDraw DIAGRAM is a Mac OS X and Windows platforms professional software to draw your own business process diagrams and flowcharts.
Picture: Professional Diagram and Flowchart Software
The purchasing process follows very specific guidelines and includes an purchasing cycle flowchart. Common key elements of purchasing process.
Picture: How well does Your Purchase Process Flow?
Related Solution:
Working with information can be quite tedious, furthermore, some data can be quite difficult to perceive without any graphic representation. So, to facilitate your work, you can use business diagrams, such as simple flowcharts or Gantt charts for project management and orgcharts for clarifying your company structure. You can use a proper software, like ConceptDraw Pro, draw them on paper, or use whiteboards, but it is more convenient to use a digital tool.
This diagram shows a cross-functional flowchart that was made fore telecom service provider. A workflow of a common telecommunication service provider has a rather branched structure. Thus, it is useful to have a flow chart to visualize the sequences and interrelations of the work flow steps. Business process flowchart contains 17 processes and 4 decision points,that are distributed through 2 lines depicting the participants involved. Also there are connectors that show the data flow within processes. This flowchart displays a detailed model of the telecom service trading process, as well as all participants in the process and how they interact with each other.
Picture: Business diagrams & Org Charts with ConceptDraw DIAGRAM
Use ConceptDraw DIAGRAM diagramming and business graphics software for drawing your own PM life cycle flow charts.
Picture: Program to Make Flow Chart
Related Solution:
ConceptDraw DIAGRAM is a very easy-to-use and intuitive database design tool which can save you hundreds of work hours. See database diagram samples created with ConceptDraw DIAGRAM database modeling database diagram software.
Picture: ConceptDraw DIAGRAM Database Modeling Software
UML Component for Bank - This sample was created in ConceptDraw DIAGRAM diagramming and vector drawing software using the UML Component Diagram library of the Rapid UML Solution from the Software Development area of ConceptDraw Solution Park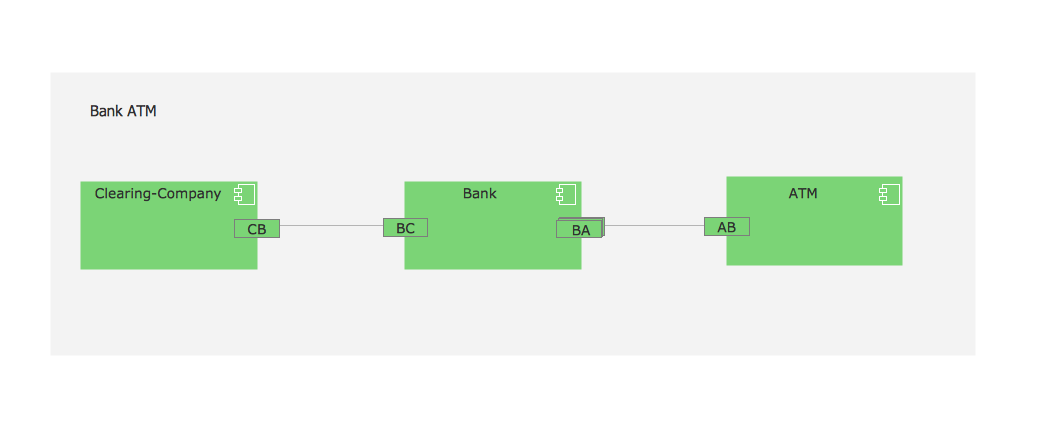
Picture: UML Component for Bank
Related Solution:
