Program to Make Flow Chart
Flowcharting soft
The ConceptDraw DIAGRAM is a program for making flow charts. In the basic package you will find the set of the samples and templates. The vector stencils created by designers one can use from several libraries. That stencil objects give ability to draw well designed flowchart.

Sample 1. Flowchart sample: Project management life cycle.
According to the PMI's PMBOOK, the PM life cycle consists of five stages of PM life cycle (process groups): initiation, planning, execution, controlling, closing.
Use ConceptDraw DIAGRAM diagramming and business graphics software for drawing your own PM life cycle flow charts.
See also Samples:
TEN RELATED HOW TO's:
The Project Management Triangle Diagram depicts three main constraints of any project: scope, time and cost. Projects have to comply with the specified scope, projects should be finished in time and projects need to consume the budget. Each of the constraints represents one side of the triangle, and any change in budget or timing or scope affects the entire diagram.
Picture: Pyramid Diagram
Related Solution:
The ConceptDraw Flowchart component includes a set of samples and templates. This geathered as flowchart maker toolbox which focused on drawing flowcharts of any industry standards.
Picture: Flowchart Components
Related Solution:
Users can start drawing their own flowchart diagrams in fast and simple way with ConceptDraw software.
ConceptDraw DIAGRAM is the only professional diagramming software that works on both Windows and Macintosh platforms. All its documents and libraries are 100% compatible and can be exchanged hassle-free between the platforms.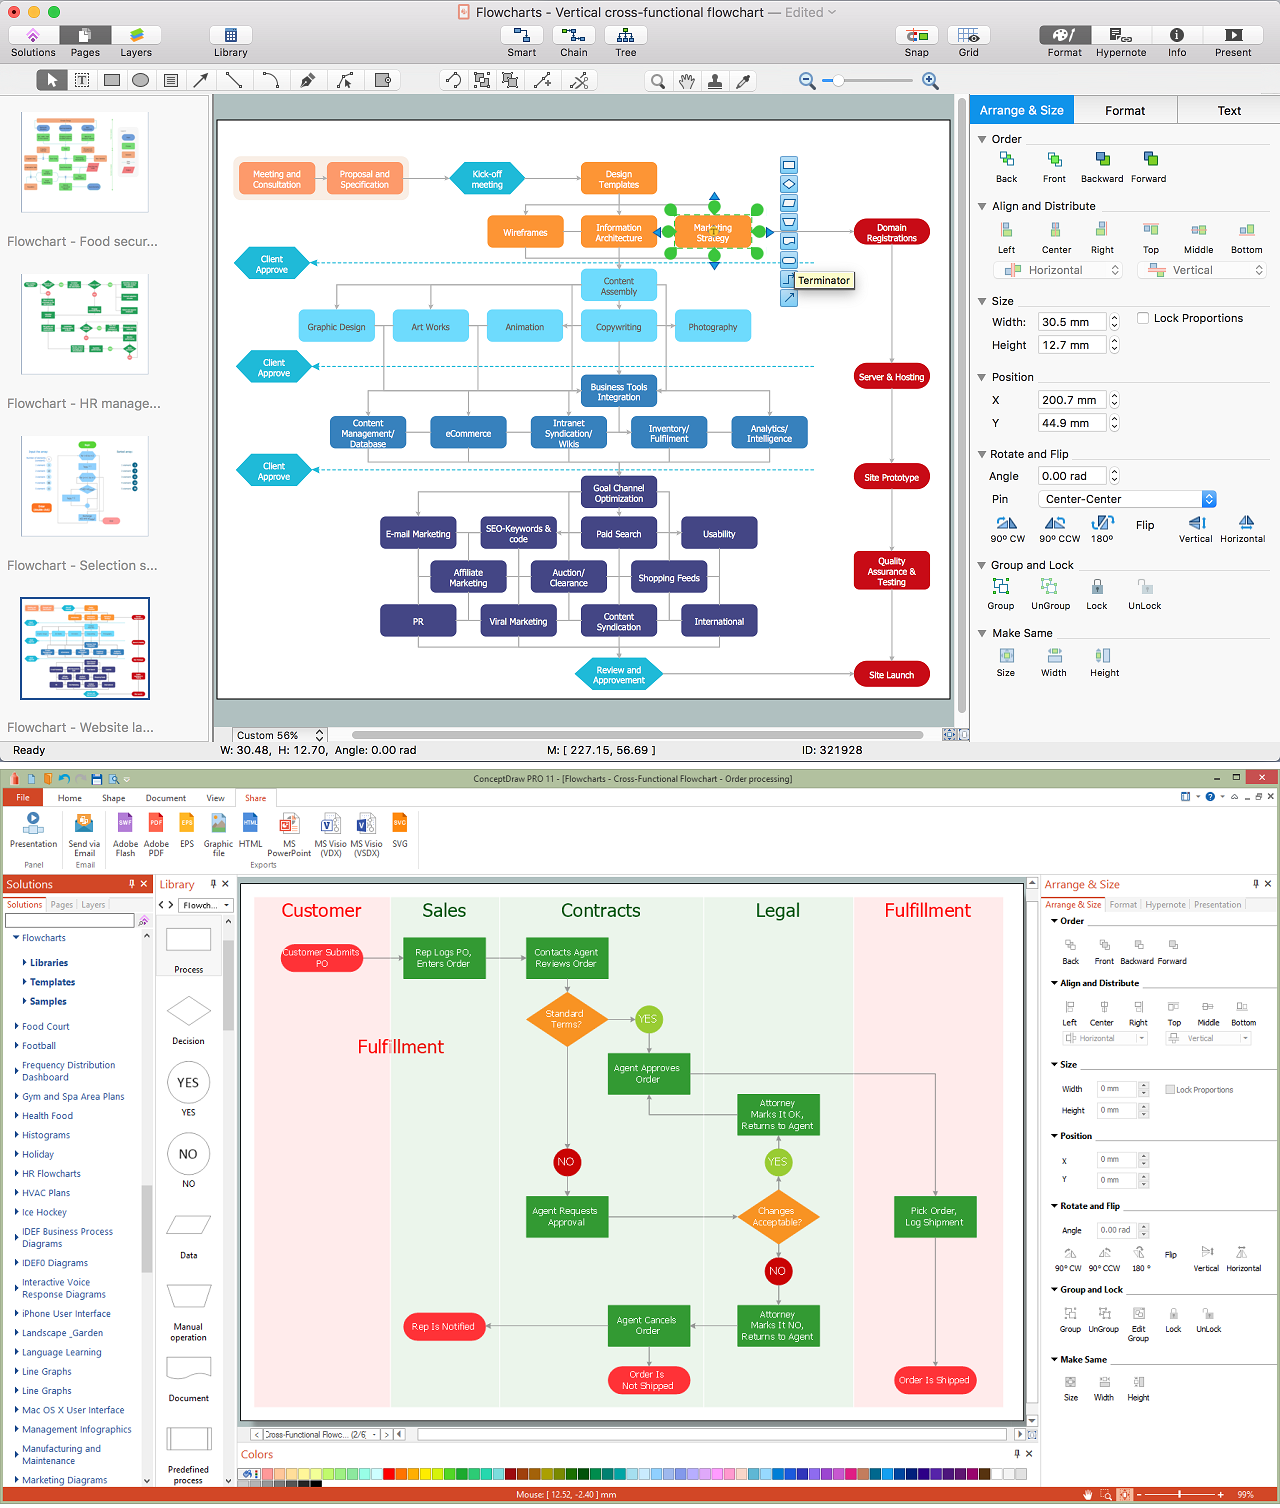
Picture: Create a Flow Chart
Related Solution:
Accounting cycle is a sequence of activities which are involved in completing an accounting process. The length of an accounting cycle is changed from organization to organization, this can be month, quarter, half-year, or year.
ConceptDraw DIAGRAM diagramming and vector drawing software extended with Accounting Flowcharts Solution from the Finance and Accounting Area of ConceptDraw Solution Park offers the extensive drawing tools, library with ready-to-use vector elements which will help you design any accounting cycle example you need.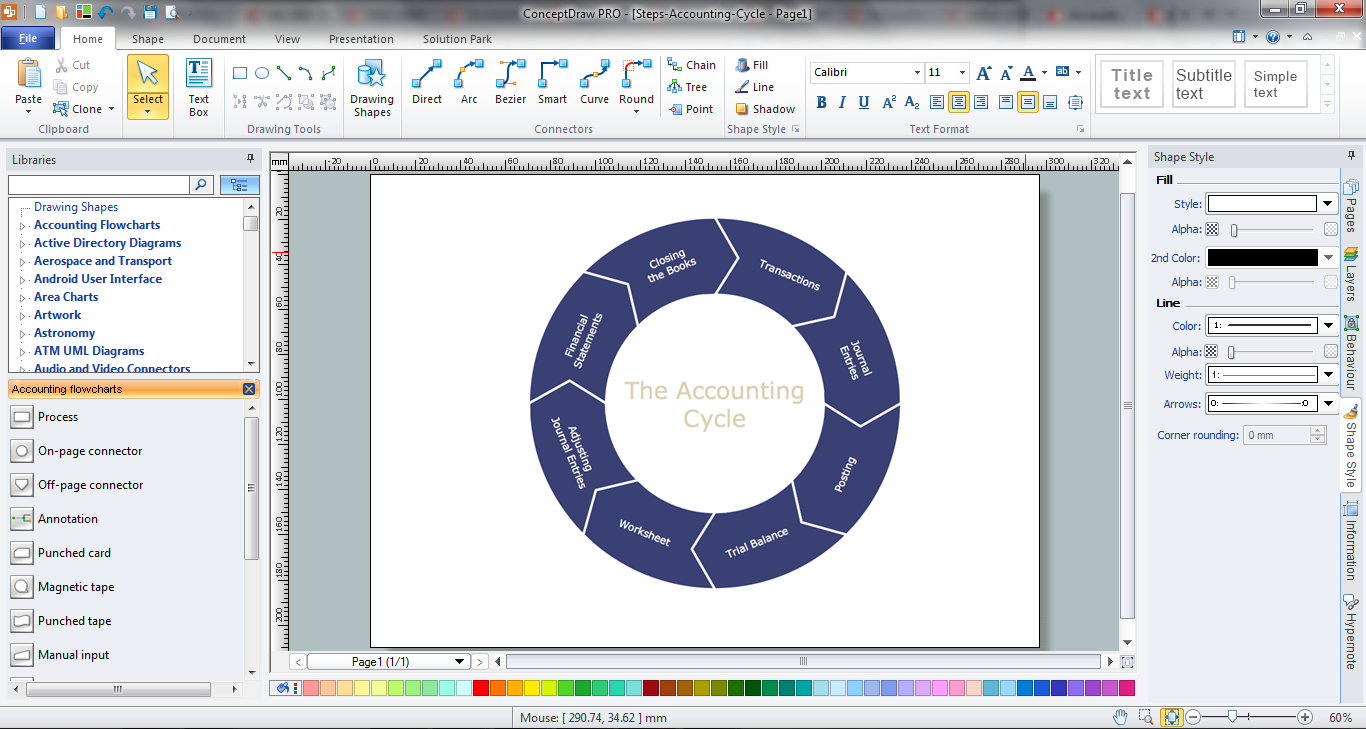
Picture: Accounting Cycle Example
Related Solution:
A pie chart or a circle graph is a circular chart divided into sectors, illustrating numerical proportion. In a pie chart, the arc length of each sector and consequently its central angle and area, is proportional to the quantity it represents.
Pie chart examples and templates created using ConceptDraw DIAGRAM software helps you get closer with pie charts and find pie chart examples suite your needs.
Picture: Pie Chart Examples and Templates
Related Solution:
This sample was created in ConceptDraw DIAGRAM diagramming and vector drawing software using the Business Process Diagram Solution from the Business Processes area of ConceptDraw Solution Park. The Business Process Solution is based on the standard BPMN 2.0 and includes the set of libraries of ready-to-use objects.
Picture: BPR Diagram. Business Process Reengineering Example
Related Solution:
Biology is incredibly interesting and useful natural science which studies all living things on the earth (people, animals, plants), structure, functions, interactions, evolution of living organisms. Biologists of the whole world use actively illustrations and drawings in your science and education activity. To facilitate their task of biology drawing, ConceptDraw DIAGRAM diagramming and vector drawing software was extended with Biology solution from the Science and Education area. Now, ConceptDraw DIAGRAM is a powerful biology drawing software.
Picture: Biology Drawing Software
Related Solution:
Project timeline is a type of chart which allows visually represent the chronology of works for the project, placing the key points of the project (milestones) on a timescale.
You need to make professional looking project timeline? Create it with ConceptDraw DIAGRAM! ConceptDraw DIAGRAM extended with Timeline Diagrams Solution from the Management Area is the best timeline diagrams software
Picture: Project Timeline
Related Solution:
An Example world map, showing a simple outline of world map. The world map is vector and can be edited or export to svg format.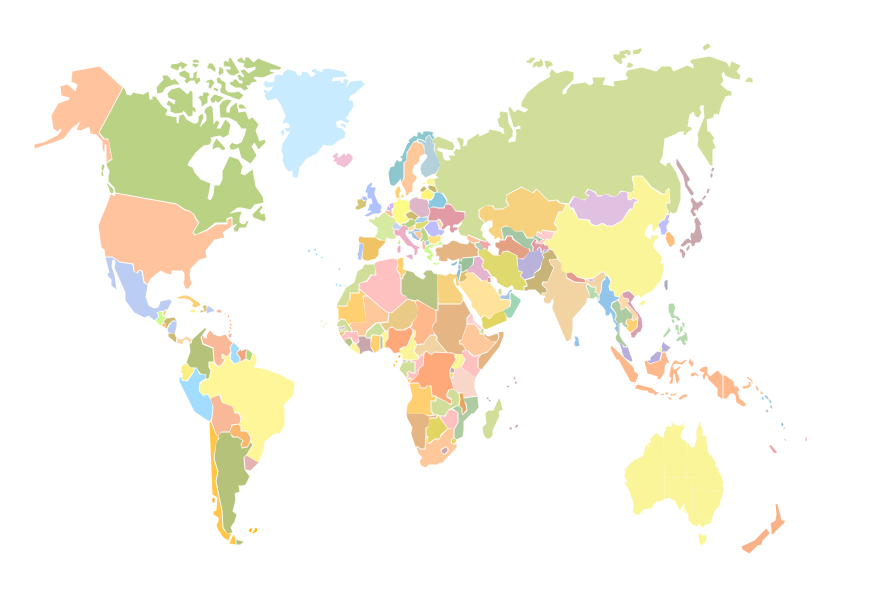
Picture: Geo Mapping Software Examples - World Map Outline
Related Solution:
ConceptDraw DIAGRAM is a powerful drawing tool that changes the way diagrams are produced. While starting drawing project has never been easier. This is more than enough versatility to draw any type of diagram with any degree of complexity.
ConceptDraw Arrows10 Technology - This is more than enough versatility to draw any type of diagram with any degree of complexity.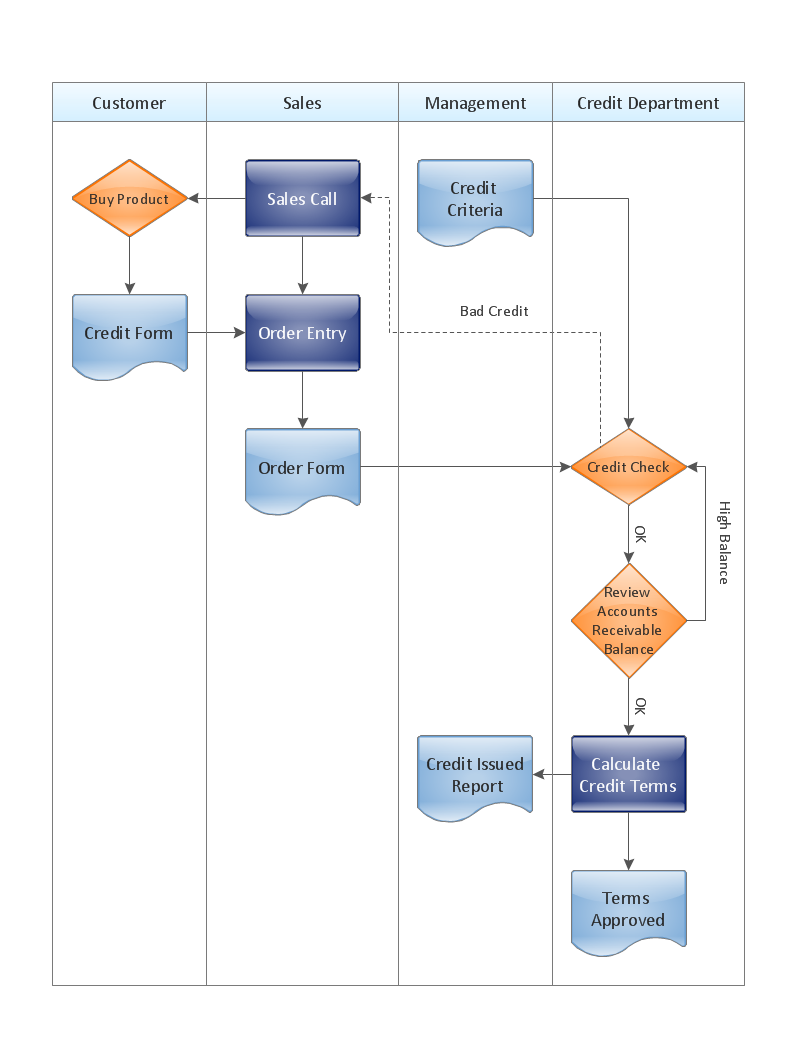
Picture: Starting a Drawing Project Has Never Been Easier
ConceptDraw
DIAGRAM 18