
Example 1. Marketing Flow Chart in ConceptDraw DIAGRAM /p>
Marketing Diagrams Solution provides the extensive drawing tools and Marketing Diagrams library with set of predesigned vector objects. These objects and also objects from other libraries of ConceptDraw Solution Park, including the Flowchart and Flowcharts
Rapid Draw libraries from the Flowcharts solution of "Diagrams" Area, will be useful for easy drawing a Marketing Flow Chart.

Example 2. Marketing Diagrams Library Design Elements
Another way of drawing a Marketing Flow Chart in ConceptDraw DIAGRAM software is to use as the base the predesigned template or sample. The whole collection of them is available from ConceptDraw STORE.

Example 3. Marketing Flow Chart - Consensus Decision Making
The Marketing Flow Chart sample you see on this page was created in ConceptDraw DIAGRAM software with help of Marketing Diagrams Solution for ConceptDraw DIAGRAM Solution Park. It effectively illustrates the consensus decision making process. An experienced user spent 5 minutes creating this sample.
Use the Marketing Diagrams Solution to create your own successful Marketing Flow Chart fast and easy.
All source documents are vector graphic documents. They are available for reviewing, modifying, or converting to a variety of formats (PDF file, MS PowerPoint, MS Visio, and many other graphic formats) from the ConceptDraw STORE. The Marketing Diagrams Solution is available for all ConceptDraw DIAGRAM or later users.
NINE RELATED HOW TO's:
It is important to have an electrical circuits scheme, when you plan a renovation or move to a new apartment. You have to arrange interior according to that plan, and it’s trouble-free to create wiring diagrams with ConceptDraw DIAGRAM , furthermore, this software has all the features needed to create an interior plan as well. So, get inspired by tons of examples included to ConceptDraw DIAGRAM solutions, and start your diagramming experience!
A wiring diagrams, that are represented on this drawing was created to depict the components of the electrical circuit schemes. These diagrams are created to depict the information about circuit arrangements and connections. Wiring diagrams, in contrast to physical drawings, use standard symbol's notation to depict different circuit devices and connections. That is why, wiring diagrams are applied to discover and repair electrical and electronic circuits. The vector graphic objects provided by ConceptDraw Electrical Engineering solution can help any specialist in electric engineering to design electrical schemes, circuit and wiring plans, power systems charts, and Maintenance and Repair diagrams.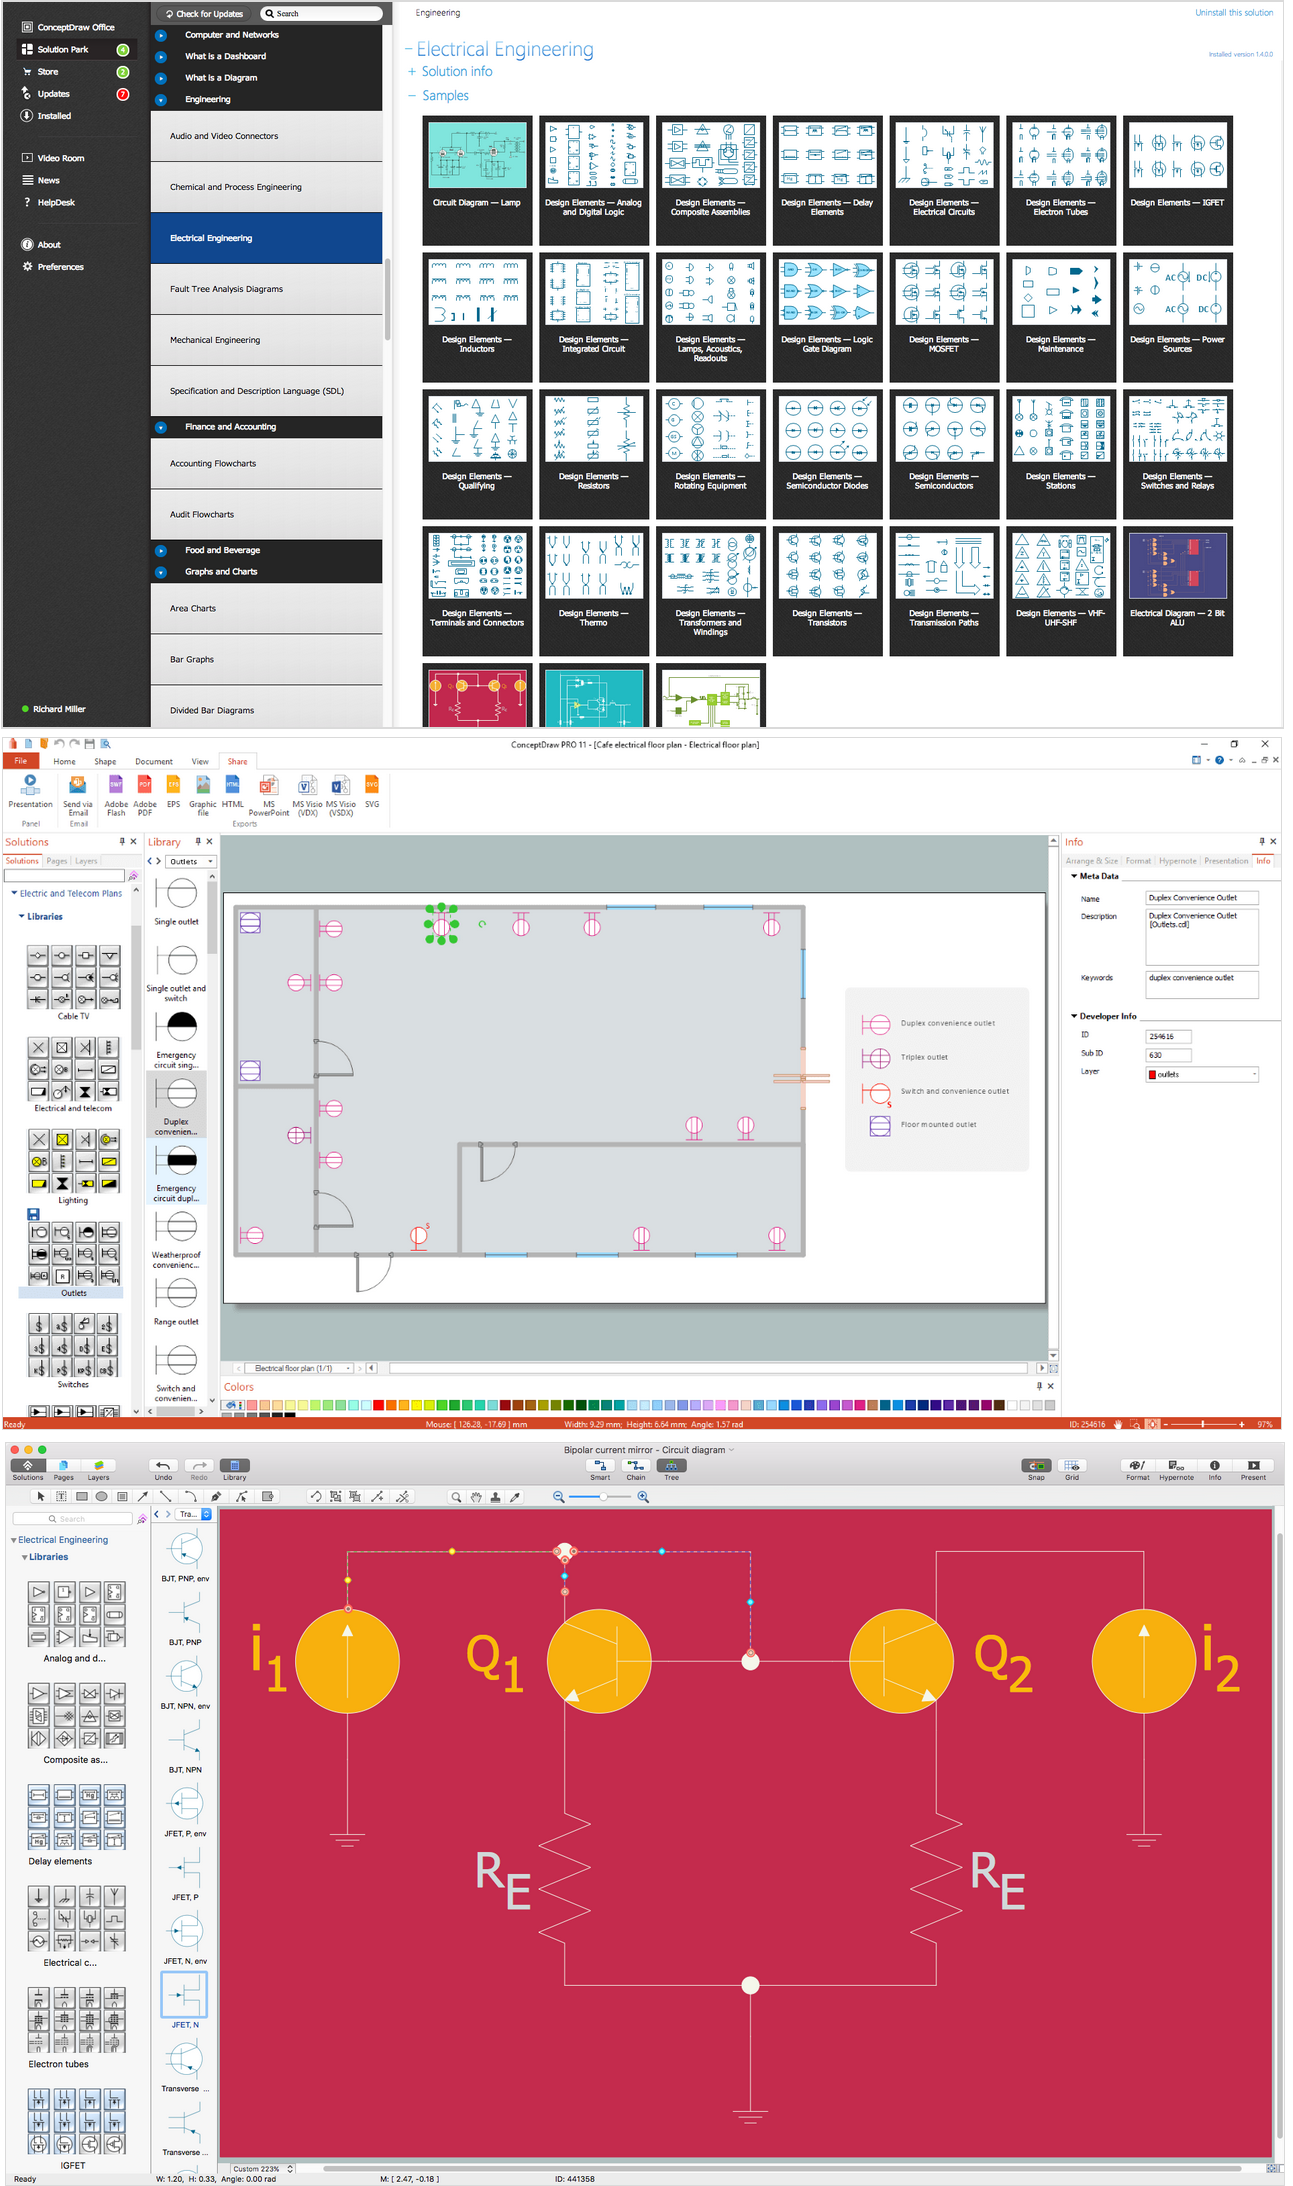
Picture: Wiring Diagrams with ConceptDraw DIAGRAM
Related Solution:
Tracking Olympic results in visual format is the most modern way to deliver statistics to a broad audience. This is a good example of an illustrated table you may easily modify, print, or publish on web from ConceptDraw Winter Sports solution.
Picture: Winter Sports Vector Clipart. Medal Map. Spatial Infographics
Related Solution:
You want to connecting objects manually?
You don't know how should diagramming software work?
Is it possible to develop a diagram as quickly as the ideas come to you?
Yes. The innovative ConceptDraw Arrows10 Technology - This is more than enough versatility to draw any type of diagram with any degree of complexity.
You can start draw your diagram manually now.
Picture: ConceptDraw Arrows10 Technology
Developing a software project supposes architecture first. To make it proper, you can use data flow diagram model in your current project.
The data flow diagram represents the Model of small traditional production enterprise that is made using Yourdon and Coad notation. It shows how the data is transfered through a process. According to the notation of Yourdon and Coad a process is represented by circles and data stores are drawn using parallel lines. This DFD was created using the ConceptDraw Data Flow Diagrams solution. Using this solution one can visualize data flow accordingly to the rules of two basic notations used for data flow modeling.
Picture: Data Flow Diagram Model
Related Solution:
Process Flow Chart is a visual illustration of overall flow of activities in producing a product or service. How do you make a Process Flow Chart usually? Drawing process flow charts, diagrams and maps is quite complex and lengthy process, especially if you draw free-hand. But now thanks to the ConceptDraw DIAGRAM diagramming and vector drawing software extended with Flowcharts solution from the Diagrams area of ConceptDraw Solution Park this process became simple and fast. A confirmation of this can serve many Process Flow Chart examples included in Flowcharts solution.
Picture: Process Flow Chart Examples
Related Solution:
Use the libraries from the Block Diagrams solution to draw block diagrams for your business documents, presentations and websites in a few minutes.
Picture: Block Diagram
Related Solution:
Purchasing Workflow Chart as a methods for documenting accounting information systems. Symbols and Methods for designing Accounting System.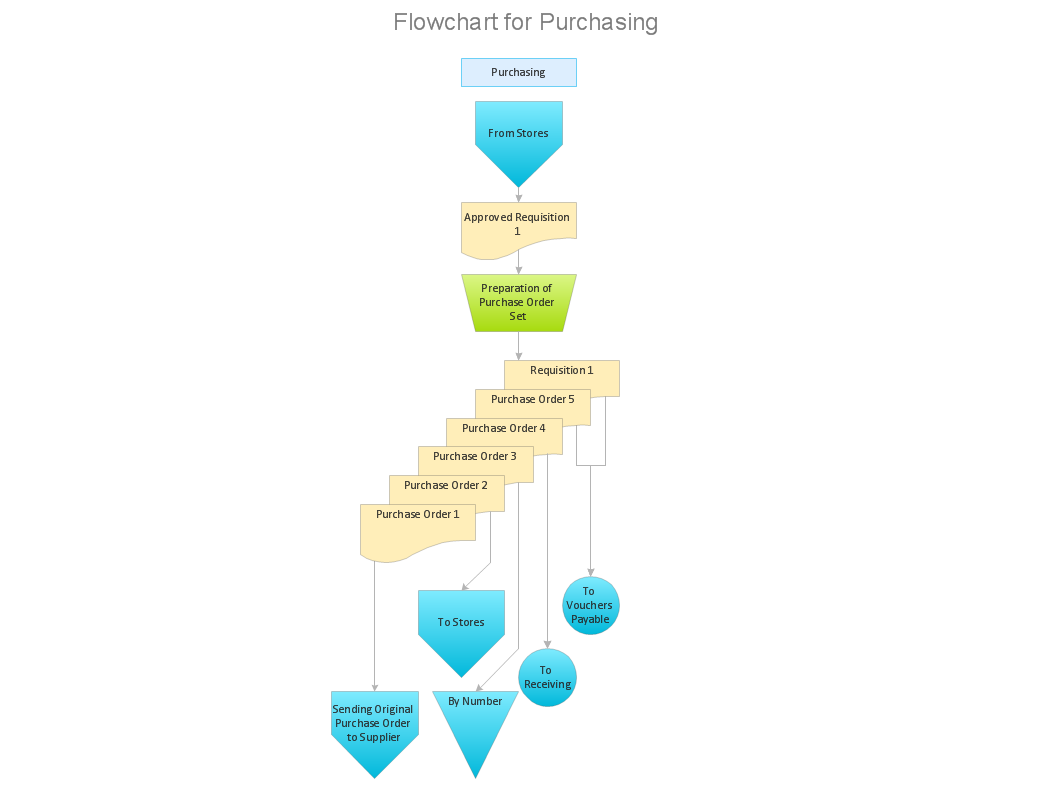
Picture: Workflow to Make a Purchase.Accounting Flowchart Example
Related Solution:
ConceptDraw DIAGRAM is a business flowchart software includes the wide flowchart examples package.
Picture: Basic Flowchart Examples
Related Solution:
When we think about programming, we usually imagine sleepless nights spent on writing kilobytes of code. However, from another point of view, Software development with ConceptDraw DIAGRAM makes a programmer's life endlessly easier. This tool is unique to fulfill all your needs in short period of time.
Over the recent years object-oriented methodology has become more and more widespread. Thanks to this methodology developers manage to deal with growing complexity of applications. More and more programs are written in such programming languages as C++, Java, Visual Basic and Object Pascal. However, the complexity of the designed systems imposes extended requirements as to design of graphic documentation. ConceptDraw possesses powerful tools for designing of technical documentation for object-oriented projects. The libraries included in the package allow to easily draw class hierarchies, object hierarchies and diagrams of data flows with the use of the most popular notations, including UML and Booch notations. And the library for projecting COM-interfaces will spare developers of ActiveX-servers a headache.
Picture: Software development with ConceptDraw DIAGRAM

