Marketing Infographics
Marketing Infographics is a very popular tool that allows to represent the complex data, knowledge, and other marketing information in a simple, visual and attractive graphical form.
But how to draw Marketing Infographics simply and quickly? ConceptDraw DIAGRAM diagramming and vector drawing software extended with unique Marketing Infographics Solution from the Business Infographics Area will help you design marketing infographics without efforts.
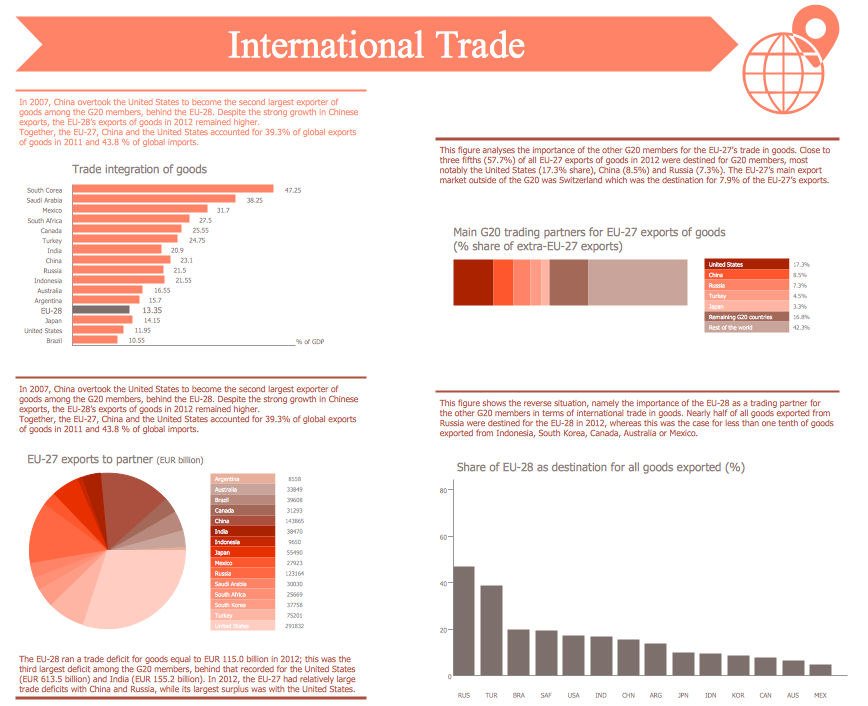
Example 1. Marketing Infographics - International trade statistics EU in comparison with the Group of Twenty
Marketing Infographics Solution provides easy-to-use infographics drawing tools, large collection of different marketing infographics, content marketing infographics and many other types of samples and templates to be filled in.

Example 2. Marketing Infographics - Multi-screen behaviors by type of TV program
Marketing Infographics Solution offers also 11 libraries with great quantity of predesigned marketing-related vector stencils. Use these objects for effectively and quickly drawing professional looking, interesting and attractive marketing infographics.

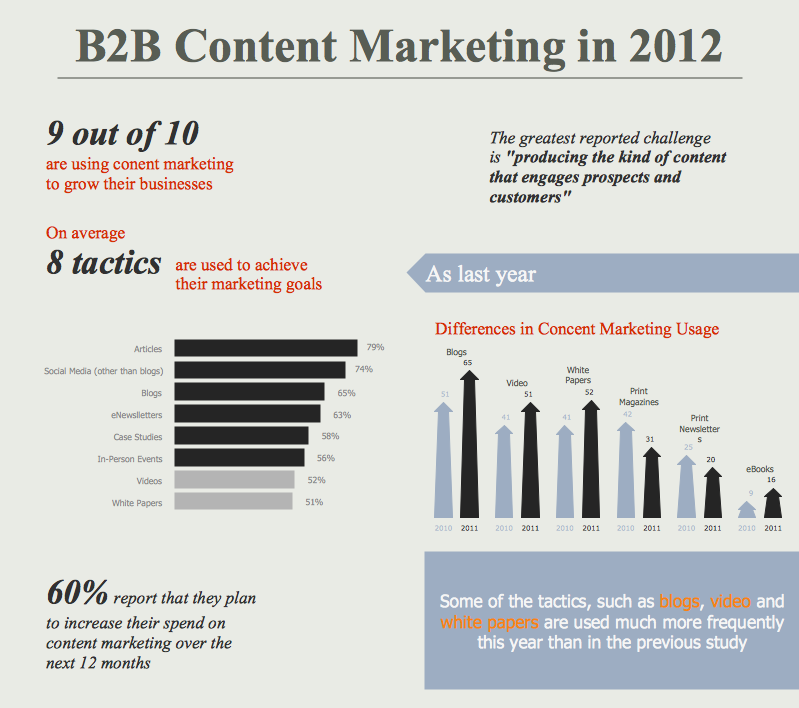
Example 3. Marketing Infographics - Device Creep and Creepy Devices
The Marketing Infographics samples you see on this page were created in ConceptDraw DIAGRAM using the vector objects from the Marketing Infographics Solution libraries. These examples successfully demonstrate solution's capabilities and the professional results you can achieve using it. An experienced user spent 10 minutes creating every of these samples.
Use Marketing Infographics solution to design your own Marketing Infographics simply and fast.
All source documents are vector graphic documents. They are available for reviewing, modifying, or converting to a variety of formats (PDF file, MS PowerPoint, MS Visio, and many other graphic formats) from the ConceptDraw STORE. The Marketing Infographics Solution is available for ConceptDraw DIAGRAM users.