
Example 1. Flowchart of Products. Sustainment and Disposal
This example was redesigned from the Wikimedia Commons file [commons.wikimedia.org]
This sample shows the Flowchart of the Sustainment and Disposal.
A Flowchart is a graphically representation of the process that step-by-step lead to the solution the problem. The geometric figures on the Flowchart represent the steps of the process and are connected with arrows that show the sequence of the actions. The Flowcharts are widely used in engineering, architecture, science, analytics, government, politics, business, marketing, manufacturing, administration, etc.
Using the ready-to-use predesigned objects, samples and templates from the Flowcharts Solution for ConceptDraw DIAGRAM you can create your own professional looking Flowchart Diagrams quick and easy.
The Flowcharts produced with ConceptDraw DIAGRAM are vector graphic documents and are available for reviewing, modifying, and converting to a variety of formats (image, HTML, PDF file, MS PowerPoint Presentation, Adobe Flash or MS Visio).
TEN RELATED HOW TO's:
Sometimes it’s quite useful to look on a problem from another view. To gain insight into an obstacle you should use SWOT analysis, and this will help you to see the whole situation. When composing a SWOT matrix, you divide your problem onto four elements - strengths, weaknesses, opportunities and threats and place them into matrix.
This sample SWOT analysis matrix of the athletic shoes producing company was designed on the base of template provided by ConceptDraw SWOT and TOWS Matrix Diagrams solution. It delivers number of easy-to-use templates and samples of SWOT and TOWS matrices for ConceptDraw DIAGRAM. Applying one of these templates, enables to quickly find out Strengths, Weaknesses, Opportunities, and Threats. After creating a list managers can consider methods the business can use to amplify strengths and to decrease weaknesses; realize opportunities; and avoid threats.
Picture: SWOT Analysis
Related Solution:
Acquaintance with flowcharting starts from getting into basic terms. First of all, flowchart definition is quite clear – a flowchart is a graphical representation of a process or an algorithm made of special symbols. Secondly, flowcharting is an irreplaceable tool for IT specialists, project managers, and anyone who wants a clear understanding of any imaginable process.
Picture: Flowchart Definition: A Complete Guide
Related Solution:
Use the Relations Diagram to create a relations factors map and to identify which factors are “drivers” and “indicators”. This diagram identifies causal relationships and determine what factors are causes or effects.
ConceptDraw OFFICE suite is a software for relation diagram making.
Picture: PROBLEM ANALYSIS.Relations Diagram
The Total Quality Management Diagram solution helps your organization visualize business and industrial processes. Create Total Quality Management diagrams for business process with ConceptDraw software.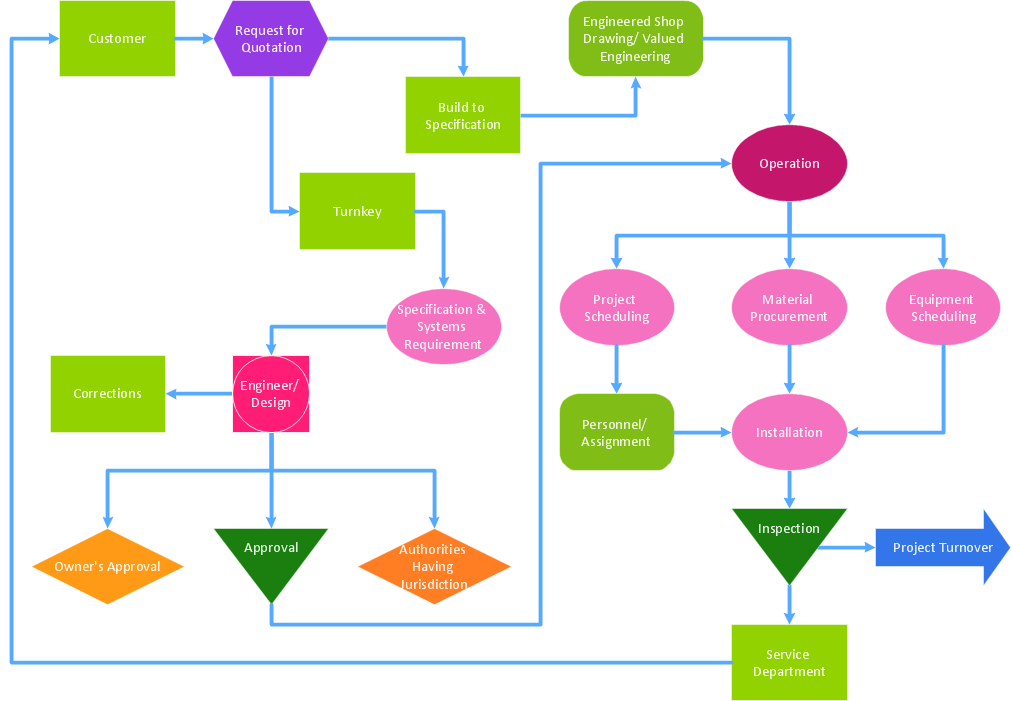
Picture: Best Value — Total Quality Management
Related Solution:
When thinking about data visualization, one of the first tools that comes to mind is a flowchart design. You can find flowchart symbols, shapes, stencils and icons easily on the Internet, but it might take time to systematize this information. Nevertheless, once you start flowcharting, you’ll love its simplicity and efficiency.
This diagram consists from standard flowchart symbols, approved by ANSI (American National Standard Institute) for drawing flowcharts. A flowchart is a diagram that represents a step-by-step algorithm of any process, displaying the process stages as boxes that are connected with arrows. Flowchart design makes it clear and readable.
Flowchart designed using ConceptDraw DIAGRAM flowchart software allows to make attractive and clear process presentation, it makes interpretation of the business process flow fresh and versatile. Great flowchart design view is a big advantage over the diagram created manually on a paper.
Picture: Flowchart Design: Principles, Layout, Symbols and Best Practices
Related Solution:
The most easier way of creating the visually engaging and informative Sales Process Flowchart is to create the new ConceptDraw document and to use the predesigned vector symbols offered in 6 libraries of the Sales Flowchart Solution. There are more than six types of sales process flow diagrams, ConceptDraw DIAGRAM software is flowchart maker which include six collections of extended flowchart symbols for effective diagramming. There are main collections of color coded flowchart symbols: Sales Department, Sales Steps, Sales Workflow, Sales Symbols and special set of Sales Arrows and Sales Flowchart.
Picture: Sales Process Flowchart Symbols
Related Solution:
This sample was created in ConceptDraw DIAGRAM diagramming and vector drawing software using the Flowcharts solution from the Diagrams area of ConceptDraw Solution Park.
This sample shows the Flowchart that displays the procedures of 2PP (two-party preferred) voting and counting the voters. The two-party-preferred vote is the result of the elections that was distributed to the final two parties.
Picture: Basic Flowchart Images. Flowchart Examples
Related Solution:
ConceptDraw gives the ability to draw Flowchart documents. Flowcharts solutionis a powerful tool that extends ConceptDraw application for drawing business flowcharts.
ConceptDraw DIAGRAM vector diagramming and business graphics software enhanced with with templates, green and interactive flowchart makers, samples and stencil libraries from ConceptDraw Solution Park which all focused to help with drawing flowcharts, block diagrams, bar charts, histograms, pie charts, divided bar diagrams, line graphs, area charts, scatter plots, circular arrows diagrams, Venn diagrams, bubble diagrams, concept maps, and others.
Picture: The Best Flowchart Software Available
Related Solution:
This sample shows the Flowchart of the testing the work of the lamp and decision making about what to do to lamp will work.
Picture: Samples of Flowchart
Related Solution:
Design efficiently the Process flowcharts to standardize and visualize chemical processes, chemical structures, chemical reactions, chemical technologies, and streamline processes with a powerful drawing tool ConceptDraw DIAGRAM enhanced with Chemical and Process Engineering solution for professional chemists, students, lectors, and other stakeholders. Professionally design accurate Chemical Engineering Flow Charts and use them to document chemistry research, predict properties and effects, and easier for any stakeholder to follow your Process Flow Chart without additional instructions.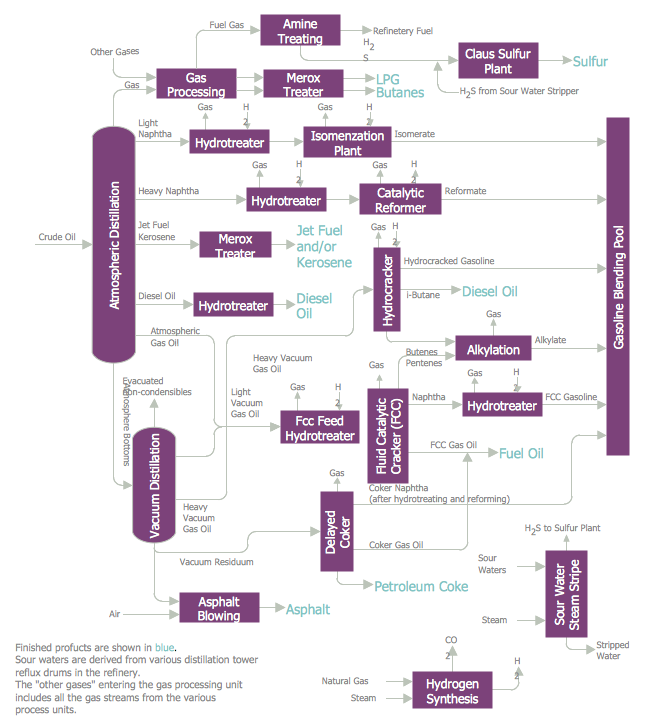
Picture: Chemical Engineering Flow Chart
Related Solution: