Using the libraries of the Business Process Diagram Solution for ConceptDraw DIAGRAM you can create your own professional Business Process Diagrams quick and easy.
TEN RELATED HOW TO's:
For documenting the Cloud Computing Architecture with a goal to facilitate the communication between stakeholders are successfully used the Cloud Computing Architecture diagrams. It is convenient and easy to draw various Cloud Computing Architecture diagrams in ConceptDraw DIAGRAM software with help of tools of the Cloud Computing Diagrams Solution from the Computer and Networks Area of ConceptDraw Solution Park.
Picture: Cloud Computing Architecture Diagrams
Related Solution:
This sample represents the actors, use cases and dependencies between them, and also the relationships between use cases. There are used dependency and use case generalization associations on this UML diagram. Use case generalization is used when you have two similar use cases, but one of them does more than another.
This sample shows the work of the Financial Trade sphere and can be used by trading companies, commercial organizations, traders, different exchanges.
Picture: Financial Trade UML Use Case Diagram Example
The best Entity Relationship Diagram tool for Mac - ConceptDraw DIAGRAM, extebded with the professional ERD drawing solution. The vector graphic diagrams can be drawn by everybody.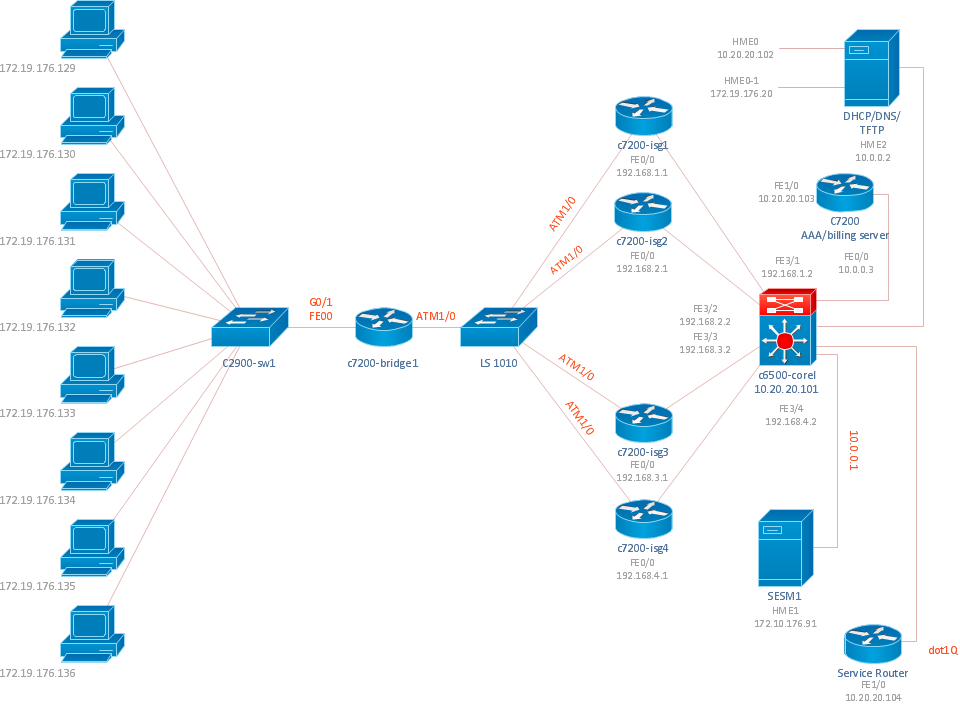
Picture: Diagramming Tool Mac
The Total Quality Management Diagram solution helps your organization visualize business and industrial processes. Create Total Quality Management diagrams for business process with ConceptDraw software.
Picture: Identifying Quality Management System
Related Solution:
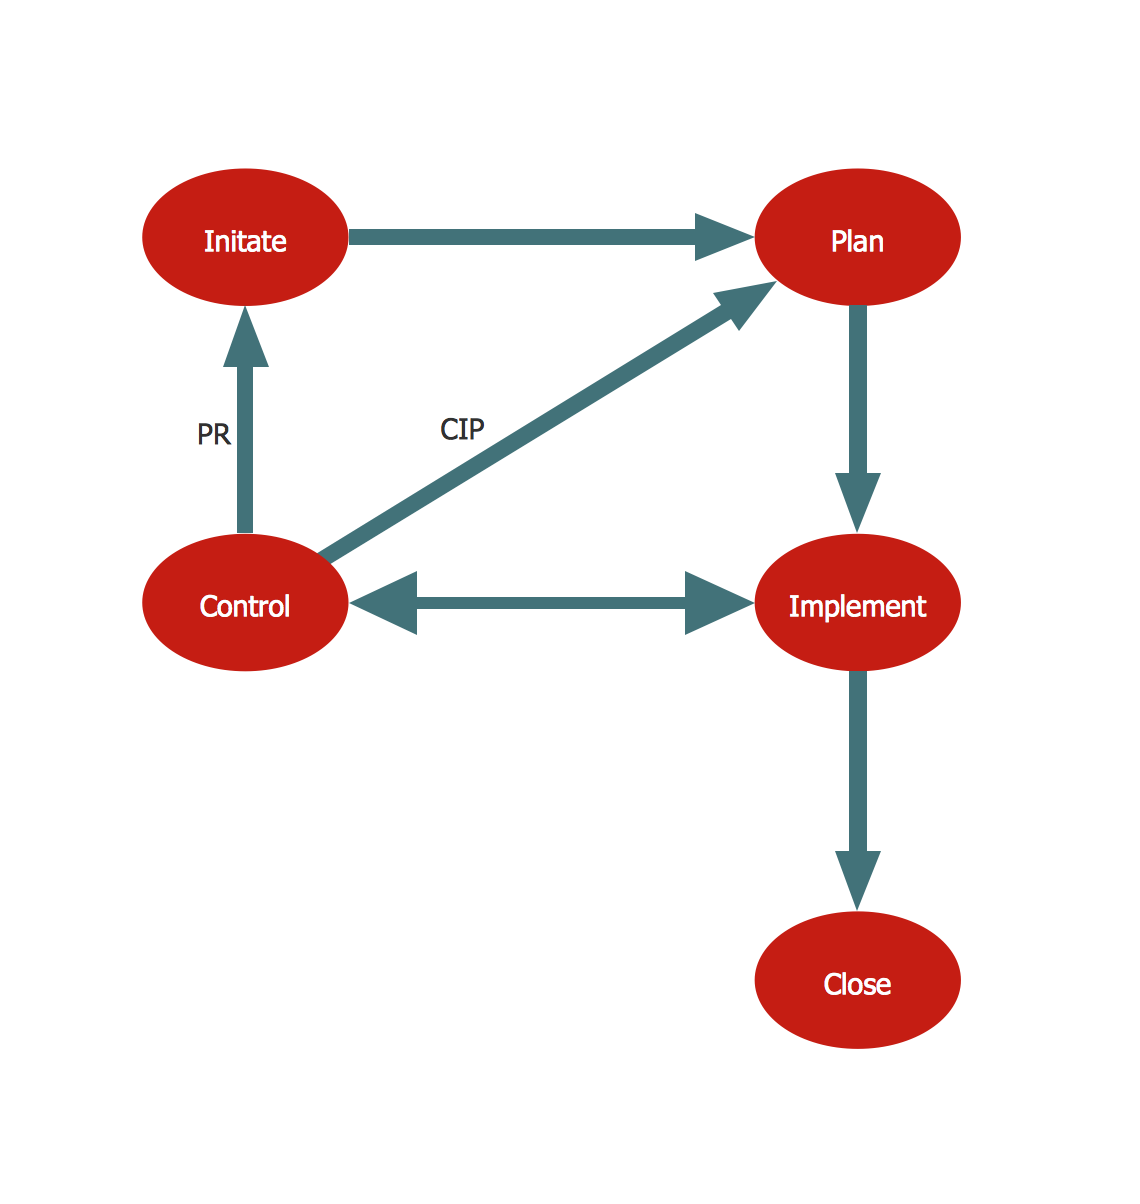
In any unclear situation create a workflow diagram. Workflow diagrams help to understand processes, find bottlenecks and fix the process. When you create workflow diagram using ConceptDraw DIAGRAM software you are able to focus on thinking, not drawing, that makes you as effective as possible.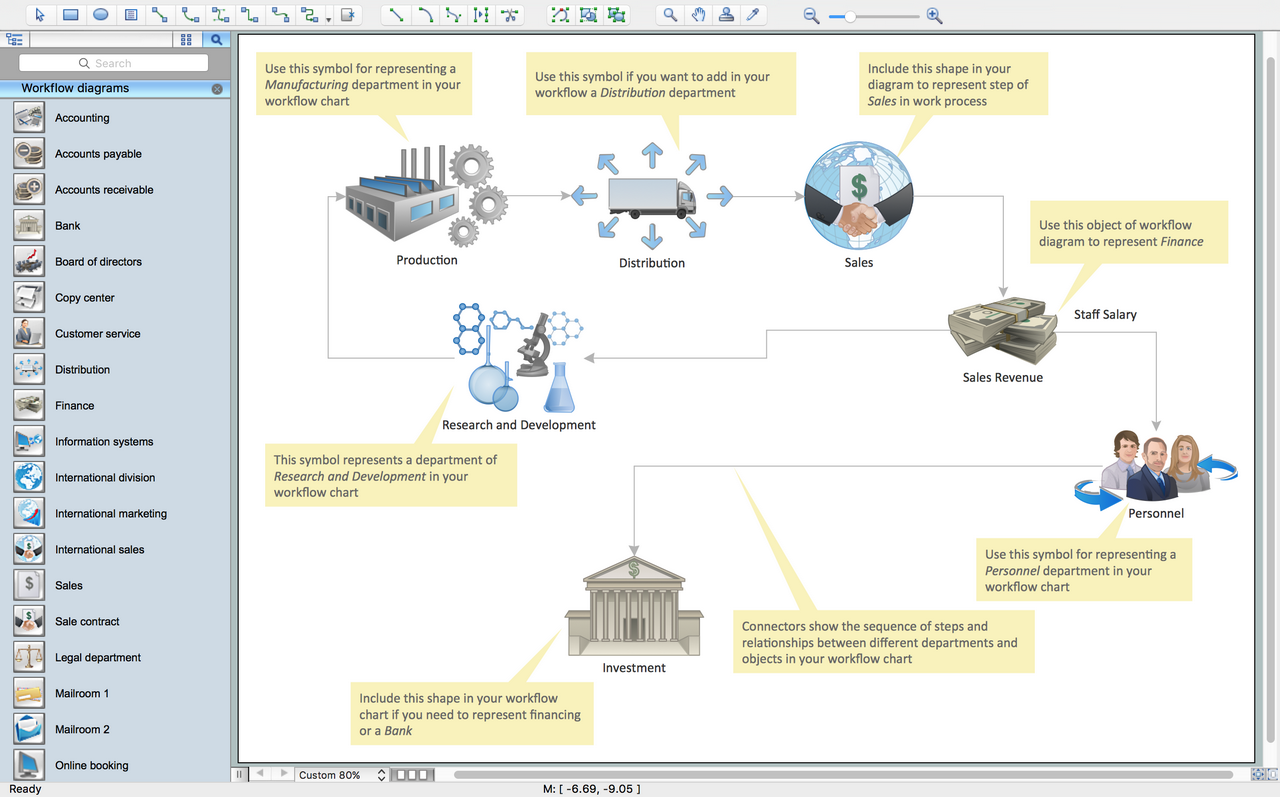
Picture: Create Workflow Diagram
Related Solution:
Accounting cycle is a sequence of activities which are involved in completing an accounting process. The length of an accounting cycle is changed from organization to organization, this can be month, quarter, half-year, or year.
ConceptDraw DIAGRAM diagramming and vector drawing software extended with Accounting Flowcharts Solution from the Finance and Accounting Area of ConceptDraw Solution Park offers the extensive drawing tools, library with ready-to-use vector elements which will help you design any accounting cycle example you need.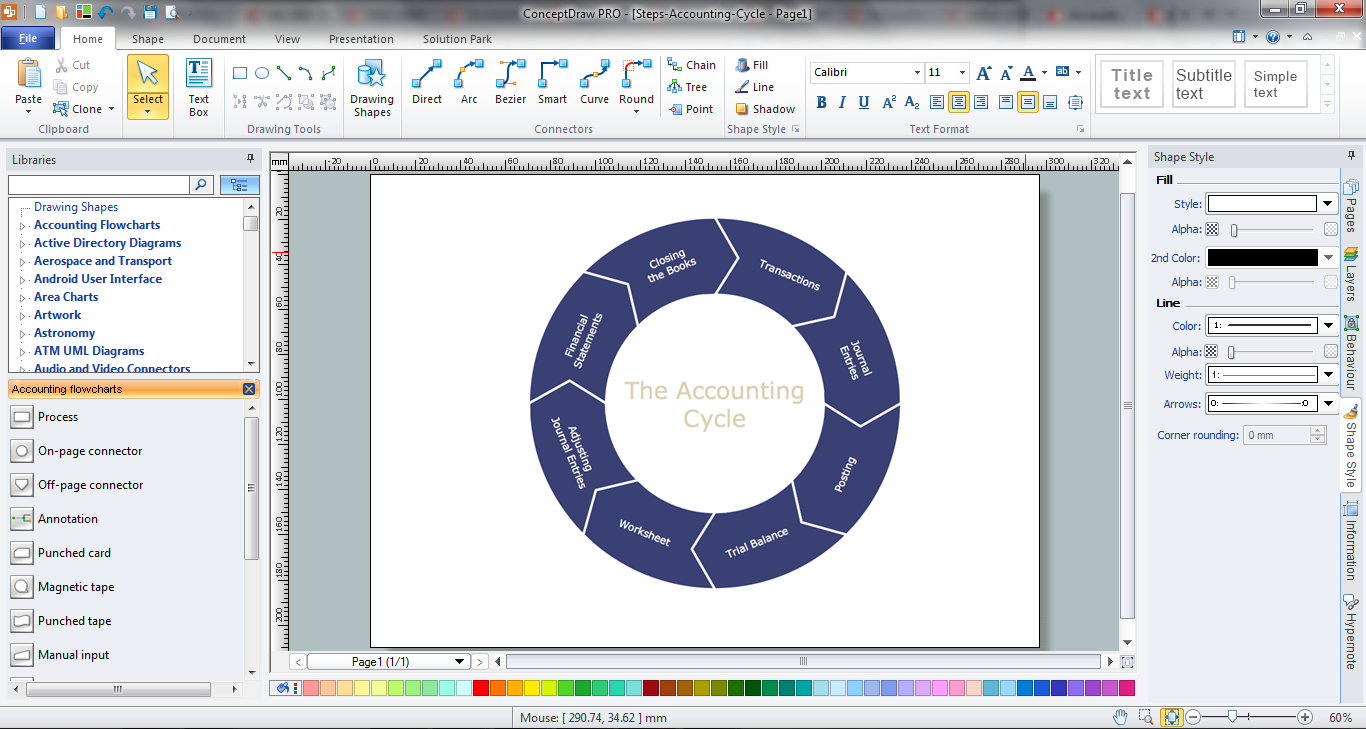
Picture: Accounting Cycle Example
Related Solution:
Fishbone Diagram, also referred as Cause and Effect diagram or Ishikawa diagram, is a fault finding and problem solving tool. Construction of Ishikawa diagrams is quite complicated process and has a number of features.
Fishbone Diagrams solution included to ConceptDraw Solution Park contains powerful drawing tools and a lot of examples, samples and templates. Each Fishbone diagram example is carefully thought-out by experts and is perfect source of inspiration for you.
Picture: Fishbone Diagram Example
Related Solution:
In software engineering, it is important to understand how the system would cooperate with external sources, like data sources. To give this information a visual representation, data flow diagrams (DFD) were used for years. The entire system is usually divided into smaller ones, and all of them process data flows in appropriate ways.
The visualizing business processes which engages the data transfer, is commonly preformed using DFDs (data flow diagrams). DFD is used to show the data flow processing and transformation. This DFD represents the electronic system of a customer purchase. It was created using Gane/Sarson notation. Data flow diagrams helps you to sort through and clarify transferring process making it available for analysis, and representation. ConceptDraw DFD solution introduces the vector library, containing the full set of icons from DFD notations.
Picture: Data Flow Diagram (DFD)
Related Solution:
Below you can see the symbol for pool table. You can find this symbol in the library of the Floor Plans Solution and use it in your floor plan of the sport complex, home, etc.
ConceptDraw DIAGRAM is a powerful diagramming and vector drawing software for creating the different Floor Plans. It’s very convenient, simple and quick to design the professional looking Floor Plans of any difficulty in ConceptDraw DIAGRAM.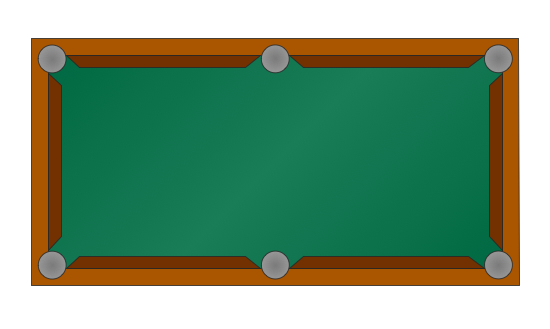
Picture: Symbol for Pool Table for Floor Plans
Related Solution:
This sample shows the UML Class Diagram that was created in ConceptDraw DIAGRAM on the Mac and then was opened for editing in MS Visio.
Using the 13 libraries of the Rapid UML Solution for ConceptDraw DIAGRAM you can create your own visual vector UML diagrams quick and easy.
Picture: UML Diagram Visio
Related Solution: