Cross-Functional Process Map Template
Drawing diagrams fast
How should diagramming software work? Is it possible to develop a diagram as quickly as the ideas come to you?
The innovative ConceptDraw Arrows10 Technology included in ConceptDraw DIAGRAM is a powerful drawing flowcharting software that changes the way diagrams are produced. While making the drawing process easier and faster.
ConceptDraw DIAGRAM is a powerful tool that helps you create professional looking cross-functional flowcharts with the well-designed templates. ConceptDraw DIAGRAM allows you to focus on work, not the drawing process. ConceptDraw Arrows10 Technology allows to draw connectors with smart behavior that gives flexibility to you during work process.
See also Videos:

Sample 1. Swim lane process mapping diagram example - Payroll process
TEN RELATED HOW TO's:
This sample was created in ConceptDraw DIAGRAM diagramming and vector drawing software using the Business Process Diagram Solution from the Business Processes area of ConceptDraw Solution Park. The Business Process Solution is based on the standard BPMN 2.0 and includes the set of libraries of ready-to-use objects.
Picture: BPR Diagram. Business Process Reengineering Example
Related Solution:
It's impossible to overestimate the usefulness and convenience of using the ready templates when you create your own diagrams and charts. ConceptDraw DIAGRAM software presents the Business Diagrams solution which offers a set of Venn Diagram templates and samples.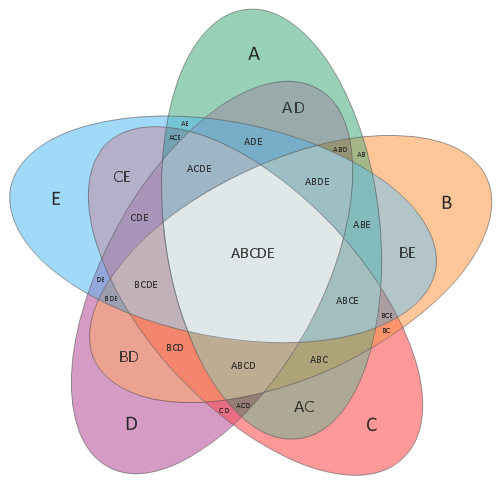
Picture: Venn Diagram Template
Related Solution:
No need for any special drawing skills to create professional looking diagrams outside of your knowledge base. ConceptDraw DIAGRAM takes care of the technical details, allowing you to focus on your job, not the drawing.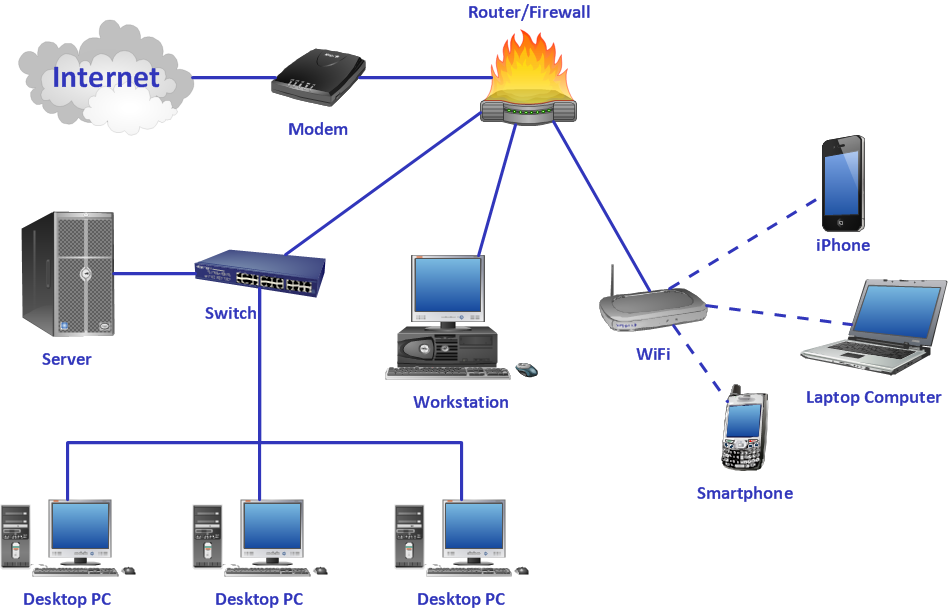
Picture: Crea Diagramas De Flujo
ConceptDraw DIAGRAM the best business process modeling tools.contains pre-designed libraries and templates based on the BPMN 2.0 standard that allows to create of both simple and complex (nested) models of processes.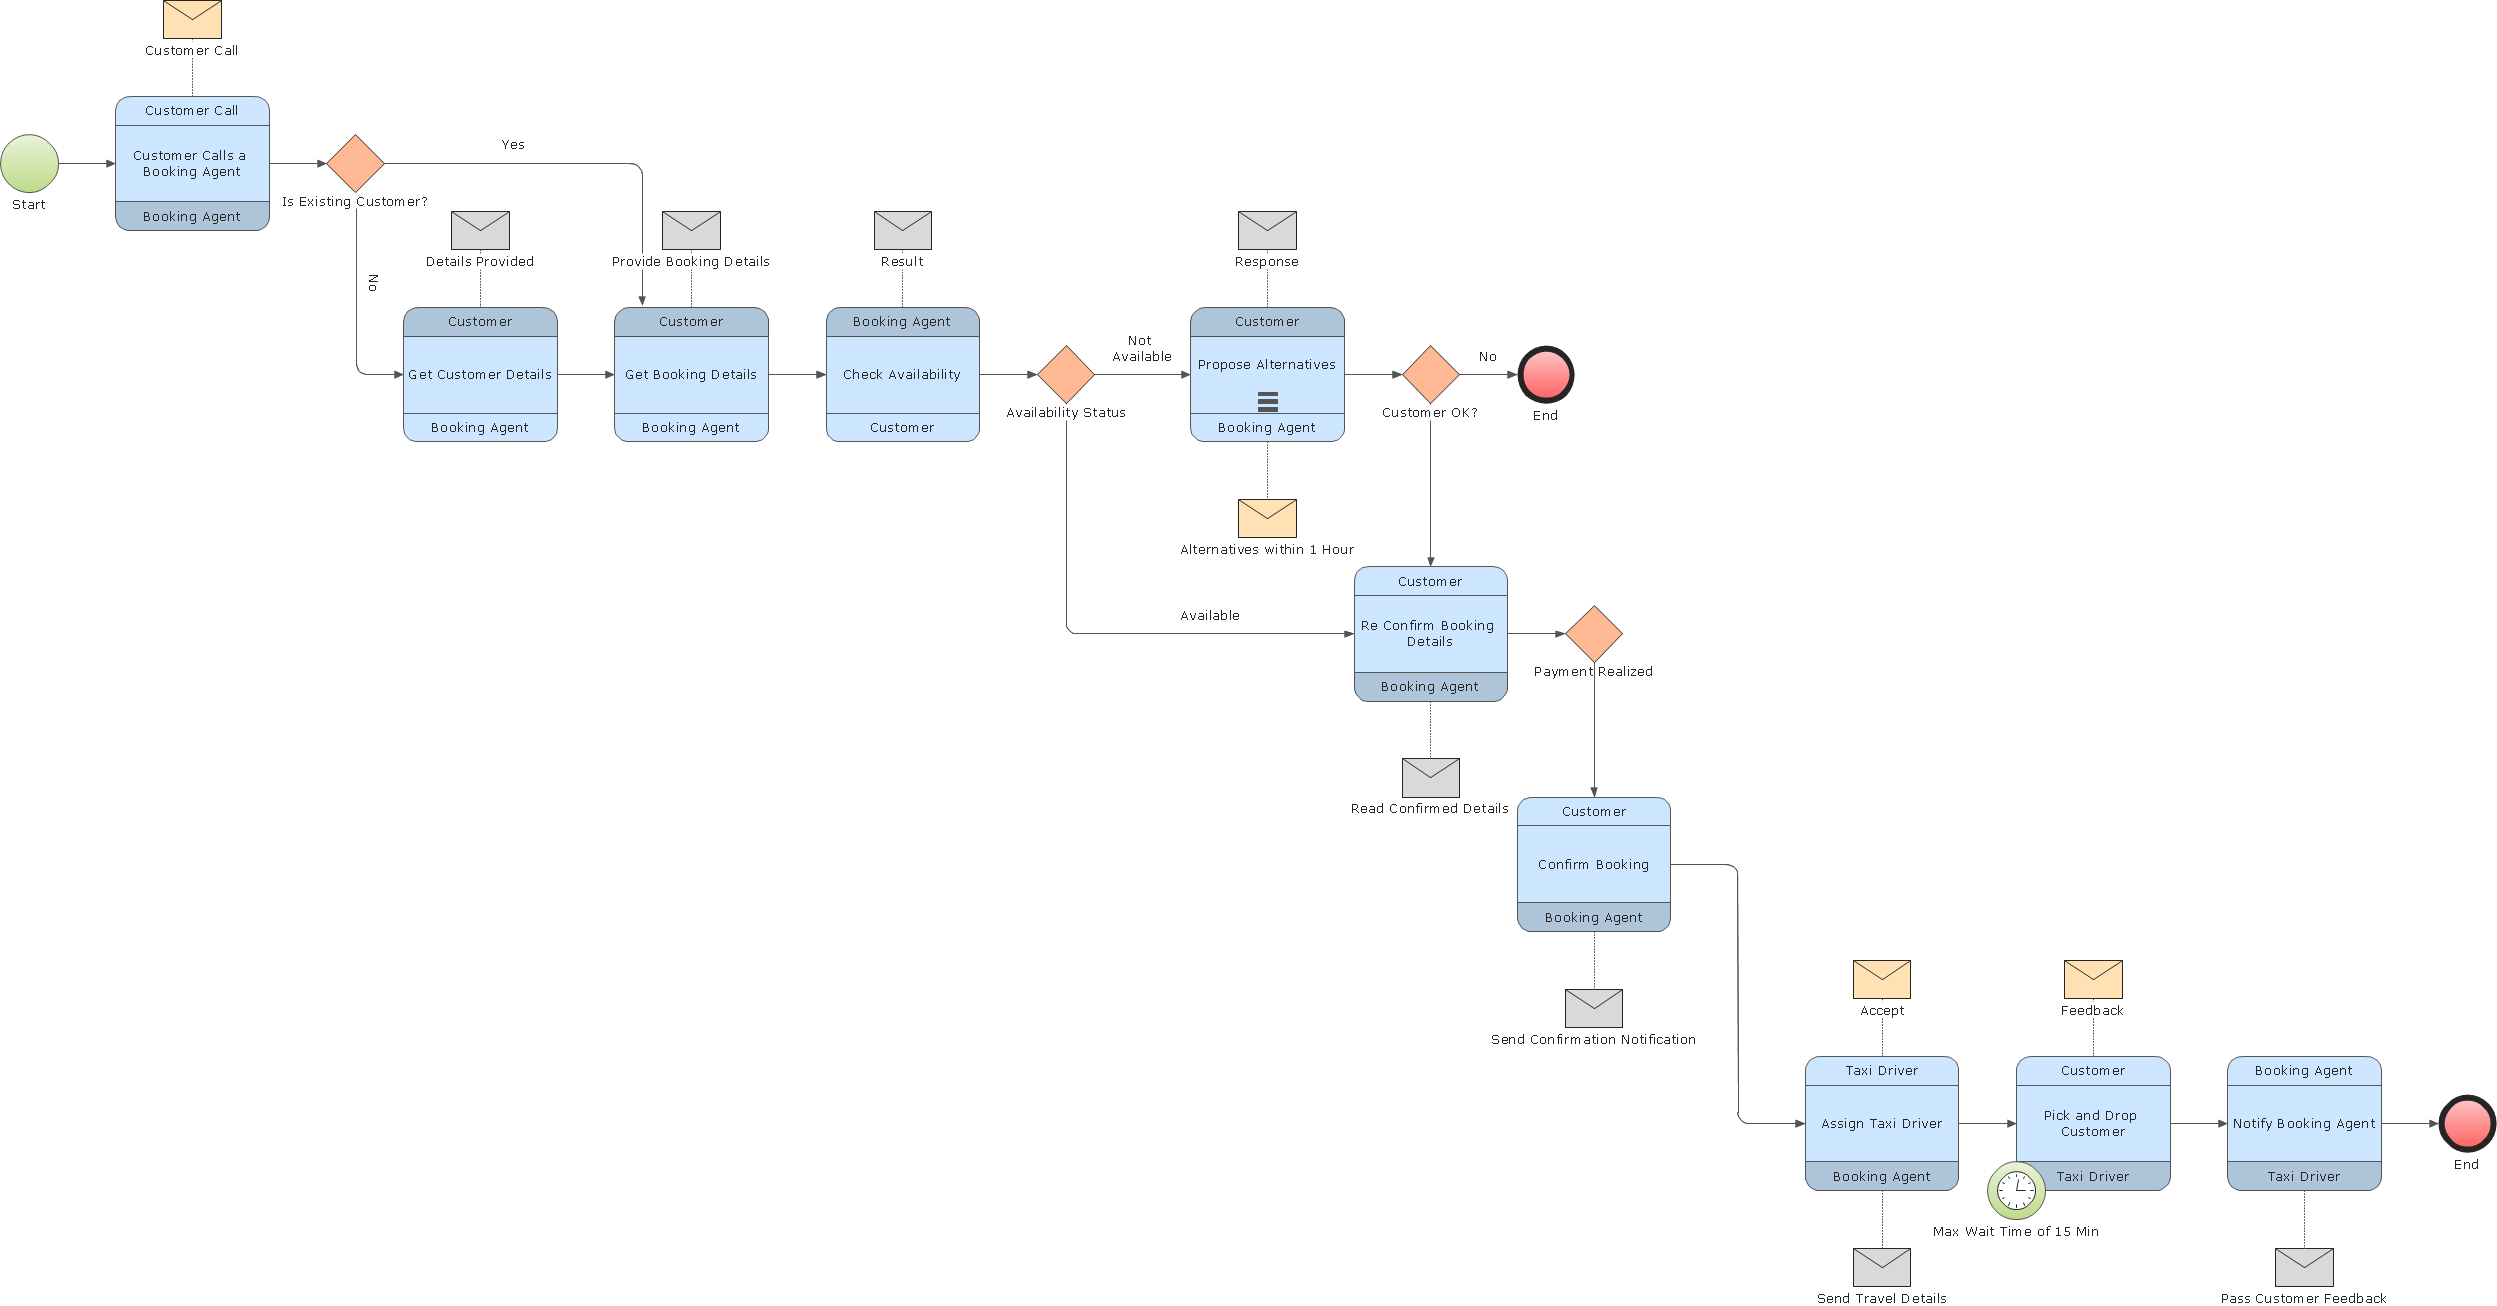
Picture: Business Process Modeling Tools
To your mind, deliberation about the profits of creating organizational charts takes more time than actually creating itself. If lack of software is the only thing that stops you, you should know that organizational charts with ConceptDraw DIAGRAM are created within a few minutes. Owing to the great number of ready-to-use templates, you’ll get your chart easily.
Chart is a very handy format for visually depicting official relations of an organization. Usually, an Orgchart (organizational chart) consists from simple geometrical shapes, containing an information on a position, personal data, and the lines that means responsibilities and accountabilities associated with position. ConceptDraw solution designed for making organizational charts enables one to create various org charts effortlessly using special templates and vector libraries.
Picture: Organizational Charts with ConceptDraw DIAGRAM
Related Solution:
Any business process consists from a number of tasks carrying out the certain business goal. It is useful to diagram business processes to ensure that they are as foolproof, logical and sequential as possible. This business process diagram describes a typical booking process flow by the example of a cab booking process. It can be used as a roadmap for any booking system implementation. Diagramming a business process allows you to look at the entire project and take into account all types of possible scenarios. Business process diagram helps you investigate and clarify the process thoroughly so that you can find out how it can be improved. Business process diagram supports team communications by ensuring that each process element is clear and everyone in the team is on the same page.
Sometimes your company brings you less profit than you expect it to be, and it’s difficult to reveal the causes. Maybe it’s time to learn new technologies, because business diagram are easily developed by means of special software, so you won’t make any extra effort. In return, you will increase your productivity and get more done in a less time.
Picture: Business Diagram Software
Related Solutions:
With ConceptDraw Arrows10 Technology - You can delete a single connector, by using the Delete key. If you need to delete more than a single connector in a complex diagram that contains many relations there is a special Delete Links tool which deletes the connectors only, no other drawing objects are deleted.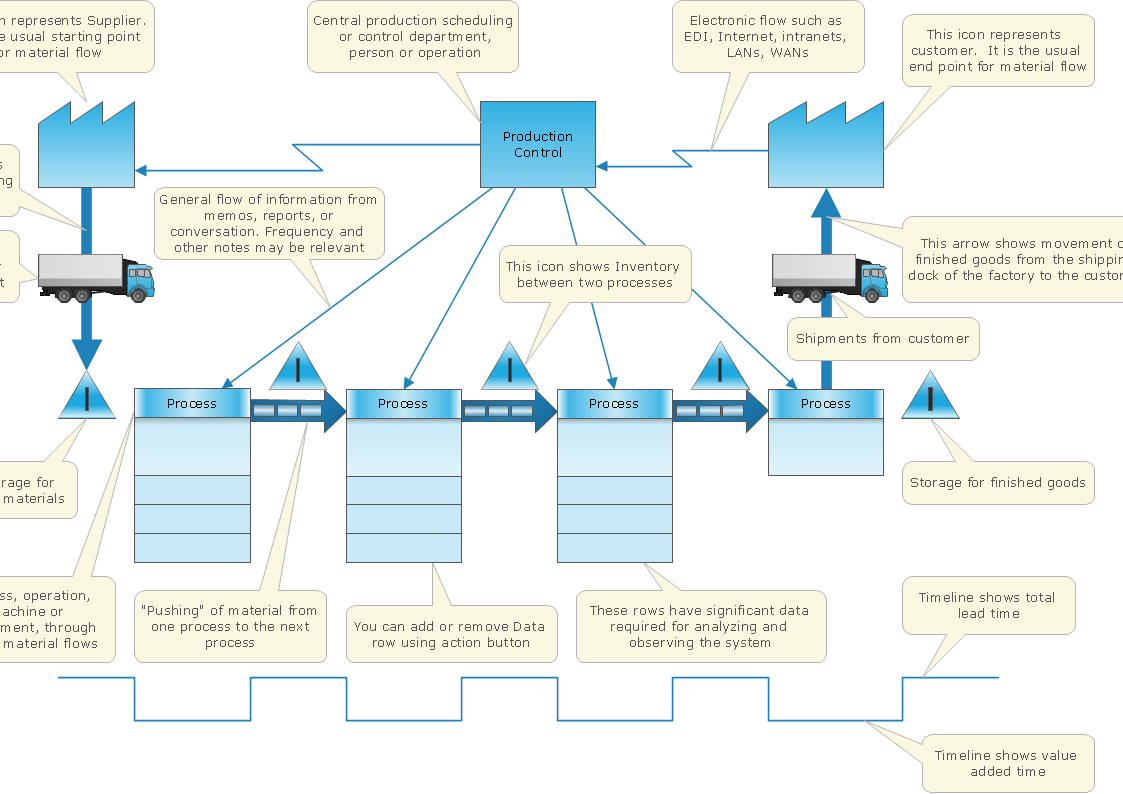
Picture: ConceptDraw Arrows10 Technology
To draw a good diagram of a business workflow you should have a ready-to-use set of pre-designed objects you may drag-and-drop to your document focusing on the workflow structure and meaning, not drawing tools. ConceptDraw DIAGRAM with Workflow Diagrams solution provides complete set of design element you may use to draw a good diagram of a business workflow.
Picture: How to Draw a Good Diagram of a Business Workflow?
Related Solution:
Value stream maps (VSM) are an essential tool for organizations applying Lean methods.
Picture: What is Value Stream Mapping?
Related Solution:
Nowadays, more and more attention is paid to the comfort in the workplace, so that employees might be more motivated. Thus, it can be said with full confidence that office layout plays an important role for employees and influences company reputation. Many worldwide known companies have headquarter offices resembling more of a campus than of an office building.
Every organization has its own unique office design ideas, needs and requirements. Each of office position requires a certain type of person who has his own requirements, needs and habits. Office layout should be designed to facilitate its business function. The well-organized office space plays an important role in a workflow enhancement and productivity improvement. This office layout diagram demonstrates a typical cubical office layout. This diagram can be use as a template for cubicle office layout organization. This visual example can help shape ideas and design your office layout conception. You can start with adding your requested office furniture objects into your office floor plan. Plants help to create a healthy indoor environment. You can design an office space that totally fits your needs.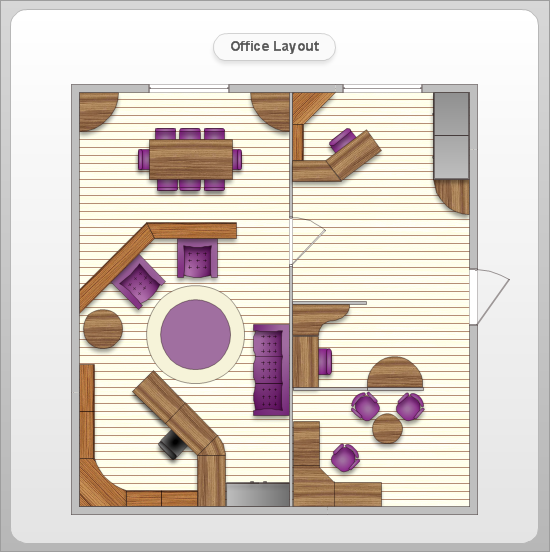
Picture: Office Layout
Related Solution:
ConceptDraw
DIAGRAM 18