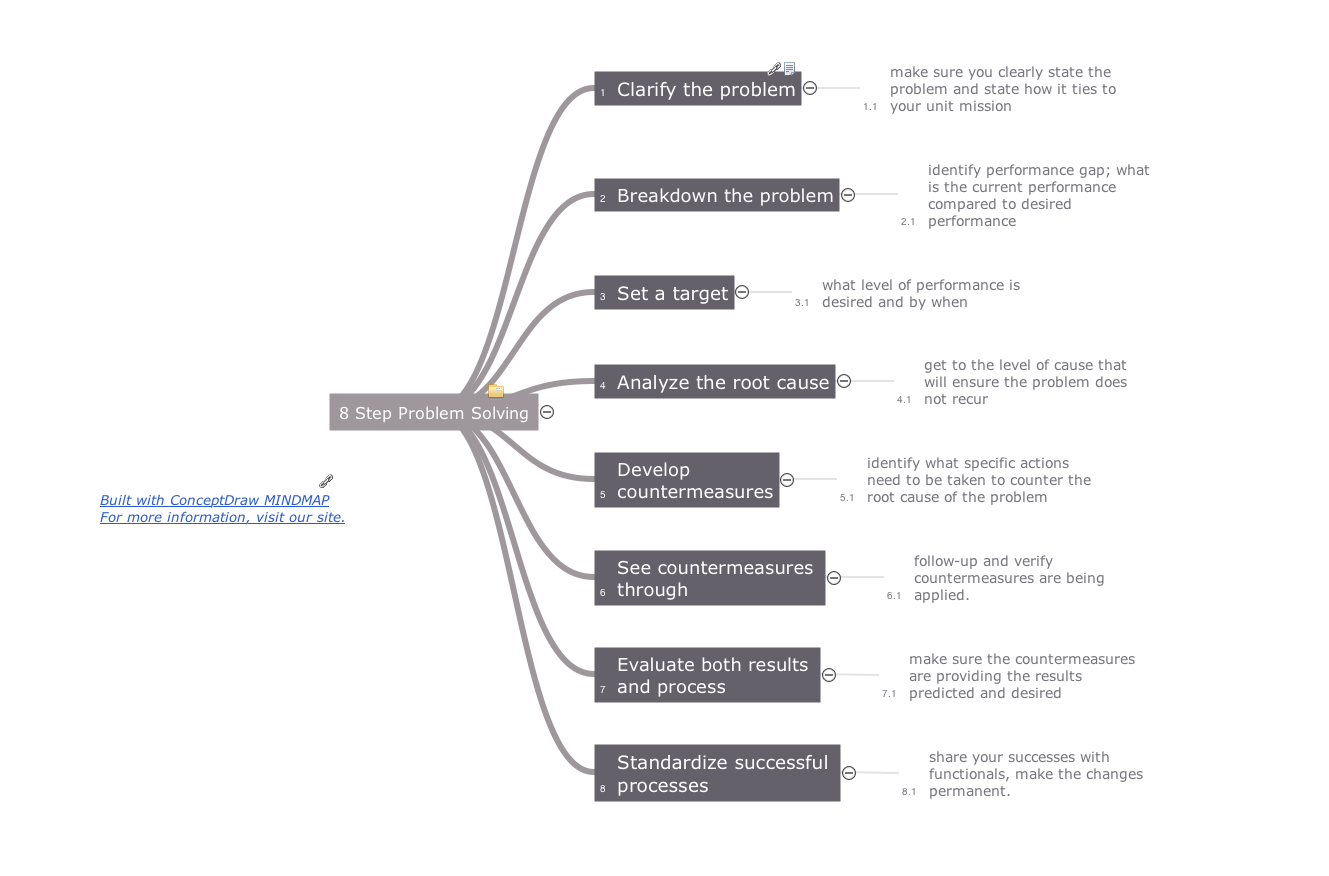
Pic.1 Quality mindmaps - 8 Step problem solving.
This mind map sample were created in ConceptDraw MINDMAP with Quality Mind Map solution as a demonstration of the creative approach to implementing quality management methods into daily work that Quality Mind Map solution offers.
You can use the samples and templates from the Quality Mind Map solution to describe your own quality processes, brainstorm, and structure quality issues; then quickly present it to your team.
See also Samples:
TEN RELATED HOW TO's:
Competitor analysis is a first and obligatory step in elaboration the proper corporate marketing strategy and creating sustainable competitive advantage. Use powerful opportunities of numerous solutions from ConceptDraw Solution Park for designing illustrative diagrams, charts, matrices which are necessary for effective competitor analysis.
Picture: Competitor Analysis
Related Solution:
Total quality management is the one known to be consisting of some organization-wide efforts put in order to install and to make some climate in which this organization can continuously improve its ability to deliver the high-quality products and services to its customers permanently.
Picture: Total Quality Management Definition
Related Solution:
One of the three main constituents of any enterprise is the Control and Information Architecture. The rest two are Production facilities and People and Organization.
Picture: Control and Information Architecture Diagrams (CIAD) with ConceptDraw DIAGRAM
Accounting Data Flow from the Accounting Flowcharts Solution visually describes the financial accounting process, shows the accumulated information about transactions and events for creating the balance sheet and the final income statement.
Accounting Flowcharts Solution contains also a wide variety of templates and samples that you can use as the base for your own Accounting Flowcharts of any complexity.
Picture: Accounting Data Flow from the Accounting Flowcharts Solution
Related Solution:
ConceptDraw MINDMAP preserves total quality management and helps bring out the best in your products and services.Picture: Mind Maps at work for Quality Managers
Related Solution:
The Gantt Chart is the main interface in ConceptDraw PROJECT. It summarizes the tasks in your project and presents them graphically so you can easily view your progress.
Picture: Gantt Chart Software
This sample shows the Data Flow Diagram of the Taxi Service and interactions between the Clients, Operators and Divers, as well as Orders and Reports databases.
Picture: Taxi Service Data Flow DiagramDFD Example
Related Solution:
MindMap presentation via Skype - Control over the slide-show process which plays on each computer of Skype conference call participants synchronously.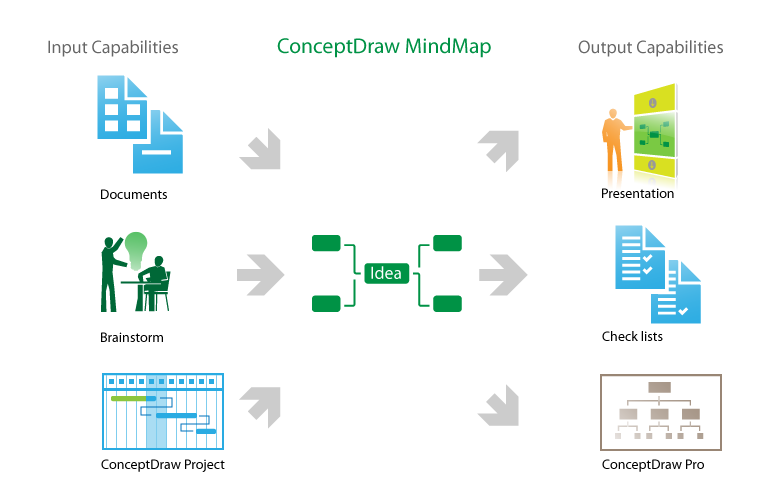
Picture: What is MindMap presentation via Skype?
Related Solutions:
Constant improvement of key performance indicators that are related to quality is a step in the right direction for a company interested in market growth.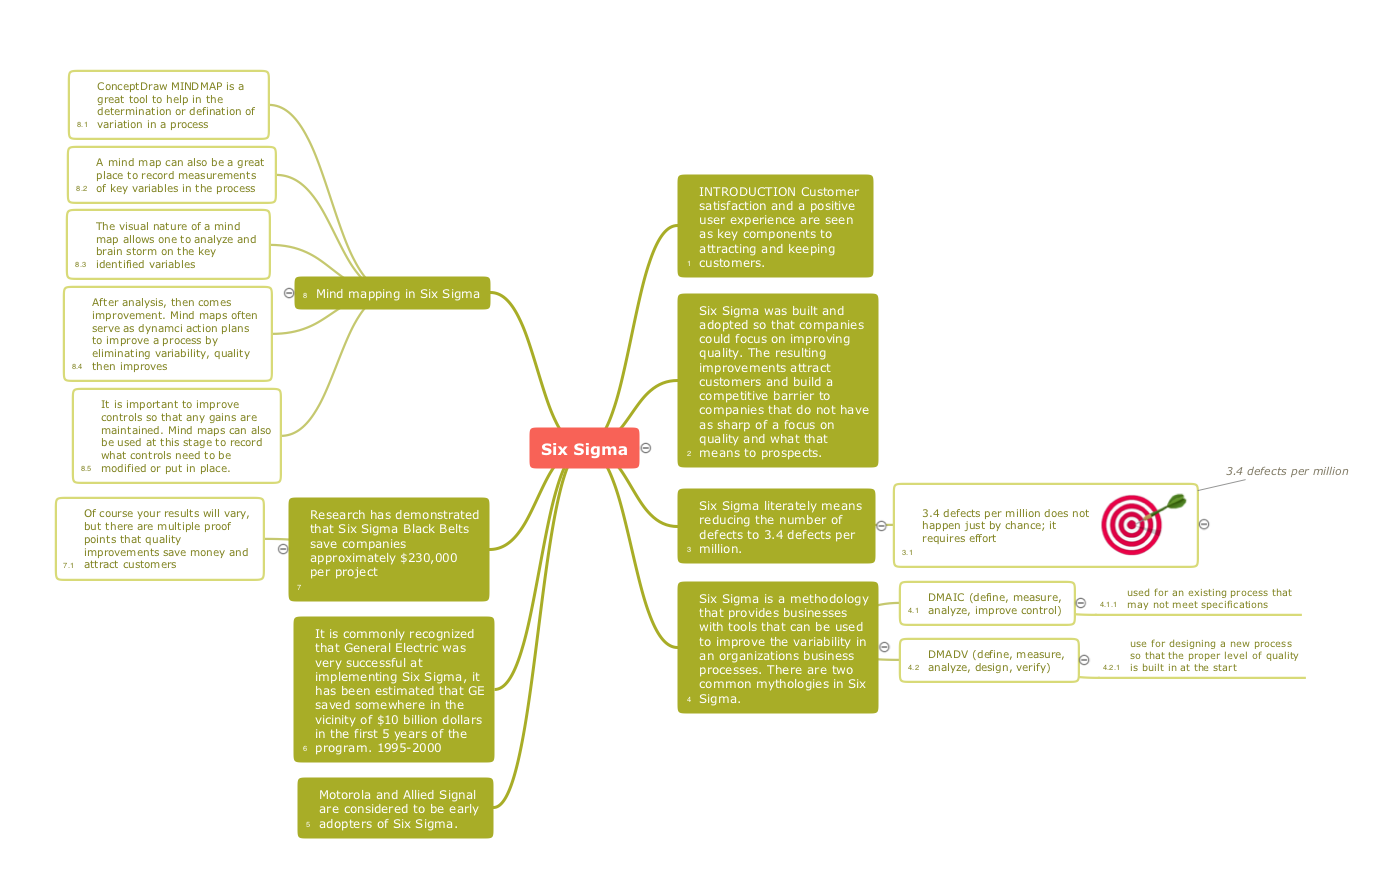
Picture: Quality Improvement
Related Solution:
The diagrams with highest level in the hierarchy define the main processes or subsystems with external and internal data sources. To detail them, DFD Library is used to build a system of lower level diagrams. This decomposition continues hereinafter it is meaningless.
This data flow diagram of a system of a library management is a context-level DFD. The data flow diagram of this type depicts the large system as a solid process, and does not input any explanation of its content. It is an ordinary practice - creation of a context-level data flow diagram when starting system development. This DFD was made using ConceptDraw solution designed especially for data flow diagrams development. One can find out Data Flow Diagrams Solution in a Solution Park of ConceptDraw and can use in as addition to the common Conceptdraw DIAGRAM diagramming tools.
Picture: DFD Library System
Related Solution: