Fundamental Tool in Quality Management
ConceptDraw MINDMAP is a fundamental tool in quality management to describe visual instructions on any process. Printed on a single page, it is easy to identify the critical points during a conference call. As a note-taking tool, it lends itself to reorganizing the notes taken during a planning conversation to the corresponding spot in the structure of a template.
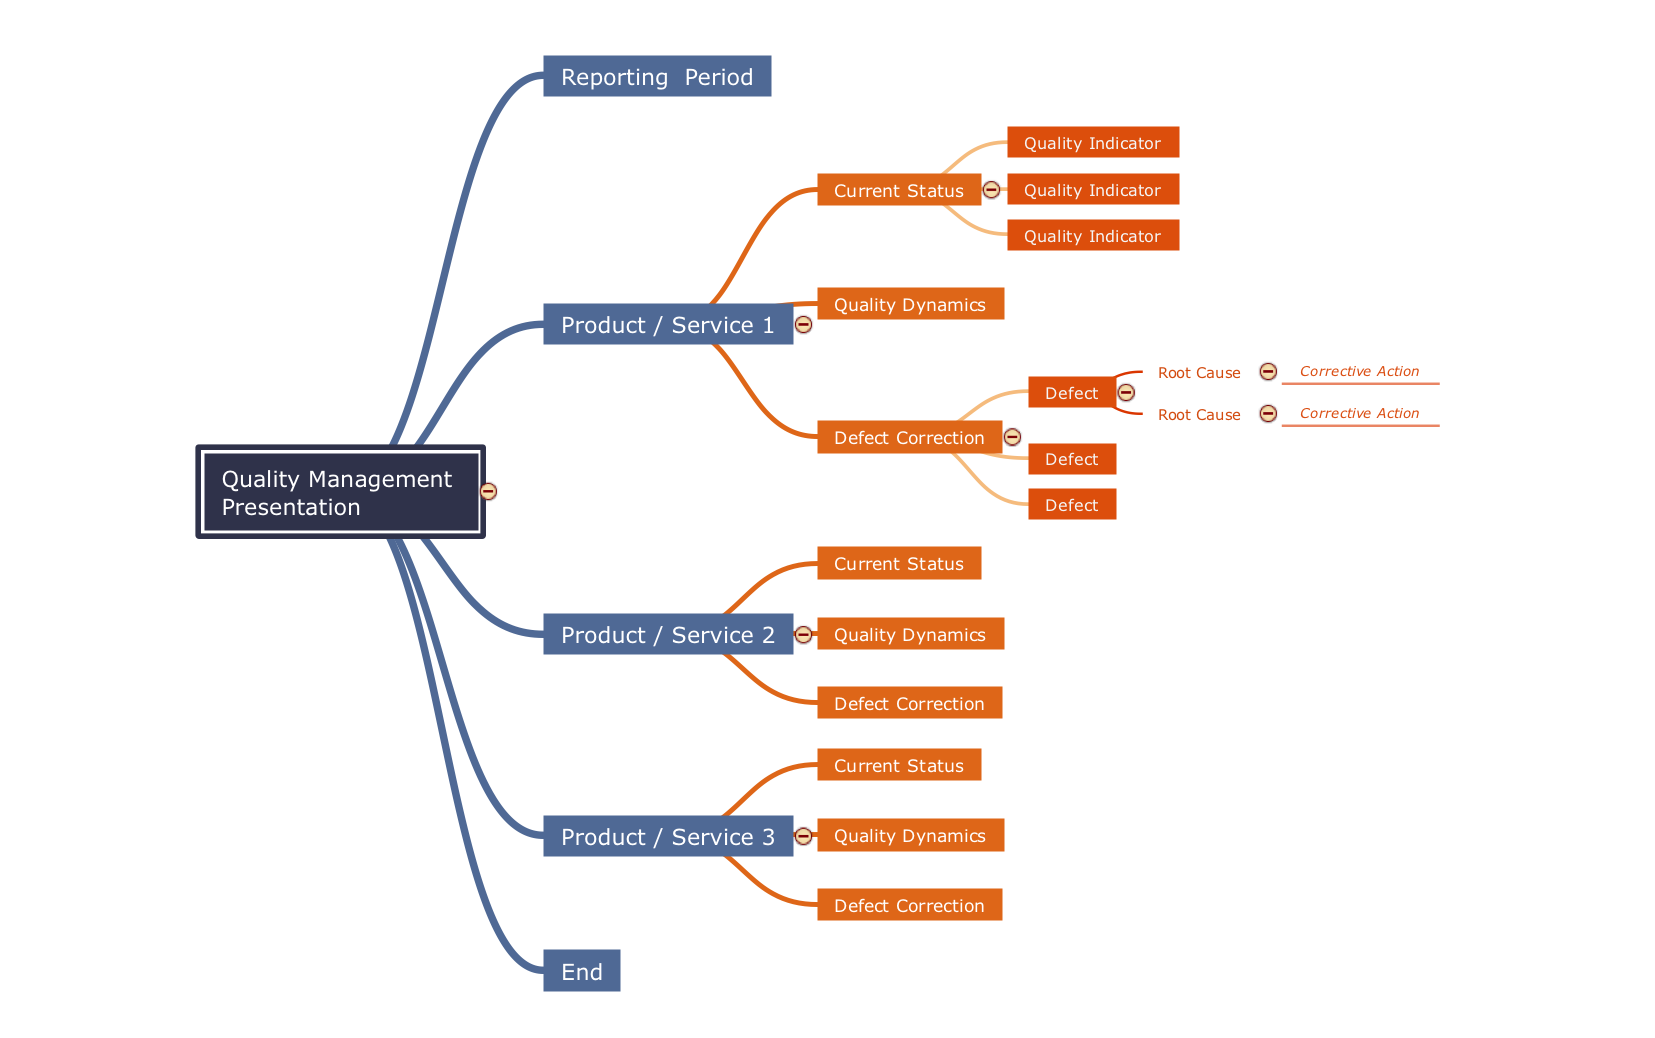
Pic.1 Mind map template - Quality management presentation.
By filling in this template, it is easy to quickly prepare a presentation about any quality process in your company.
See also Samples:
TEN RELATED HOW TO's:
The role of ConceptDraw MINDMAP is to organize and plan idea development and communicate between process participants. Mind maps are convenient to prepare presentations for team and management and send task lists and related information.
Picture: Product Overview
ConceptDraw MINDMAP is effective Mind Mapping Software with rich clipart galleries, extensive drawing capabilities, a large quantity of examples of professionally designed mind maps on the different themes and powerful import and export capabilities.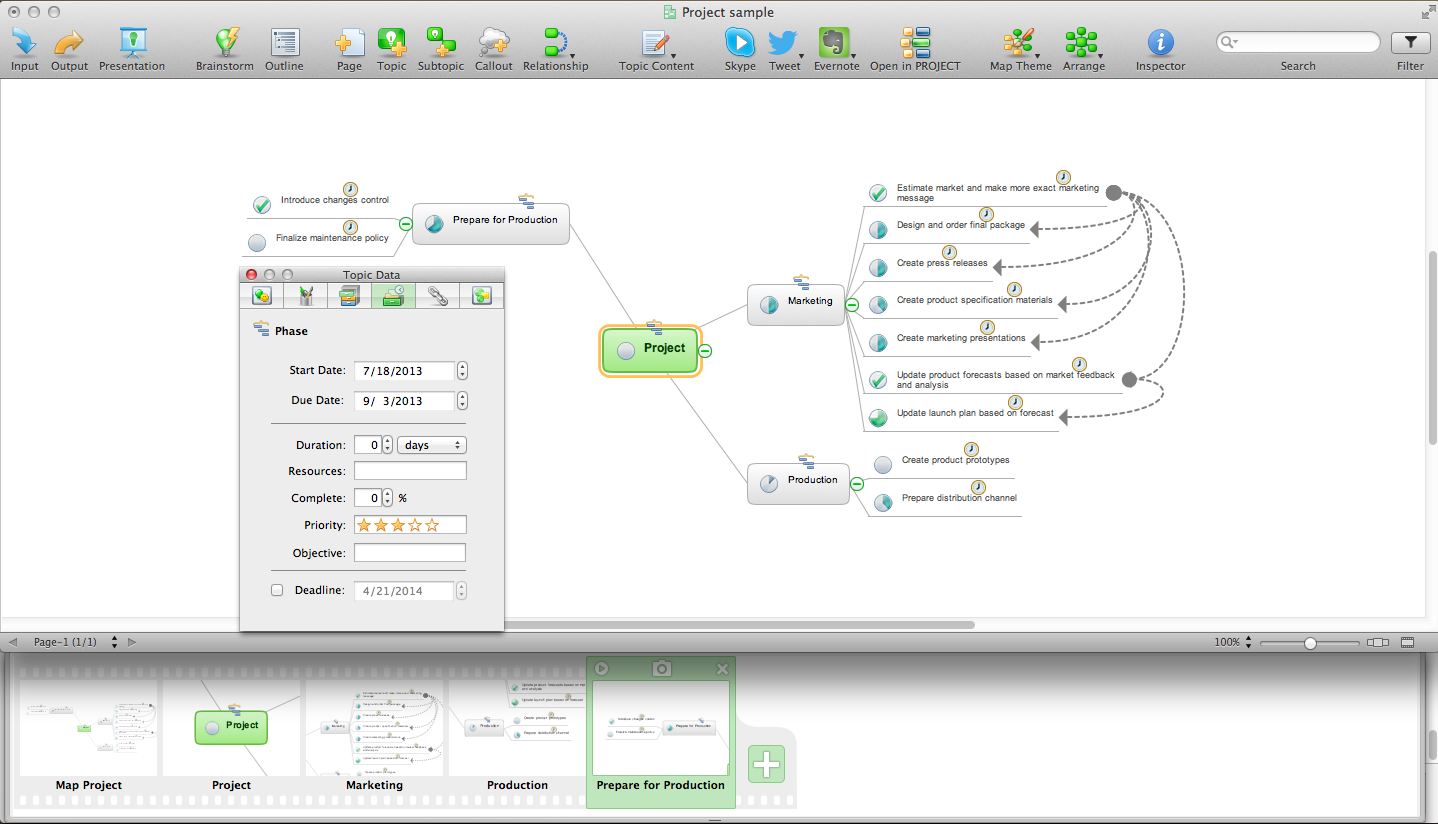
Picture: Mind Mapping Software
Related Solution:
Create value stream maps - for value stream analysis and value stream management, material and information flow mapping, using our quick start templates included with ConceptDraw.
Picture: Best Value Stream Mapping mac Software
Related Solution:
ConceptDraw Quality MindMap solution is a perfect additional tool for the quality team of your organization.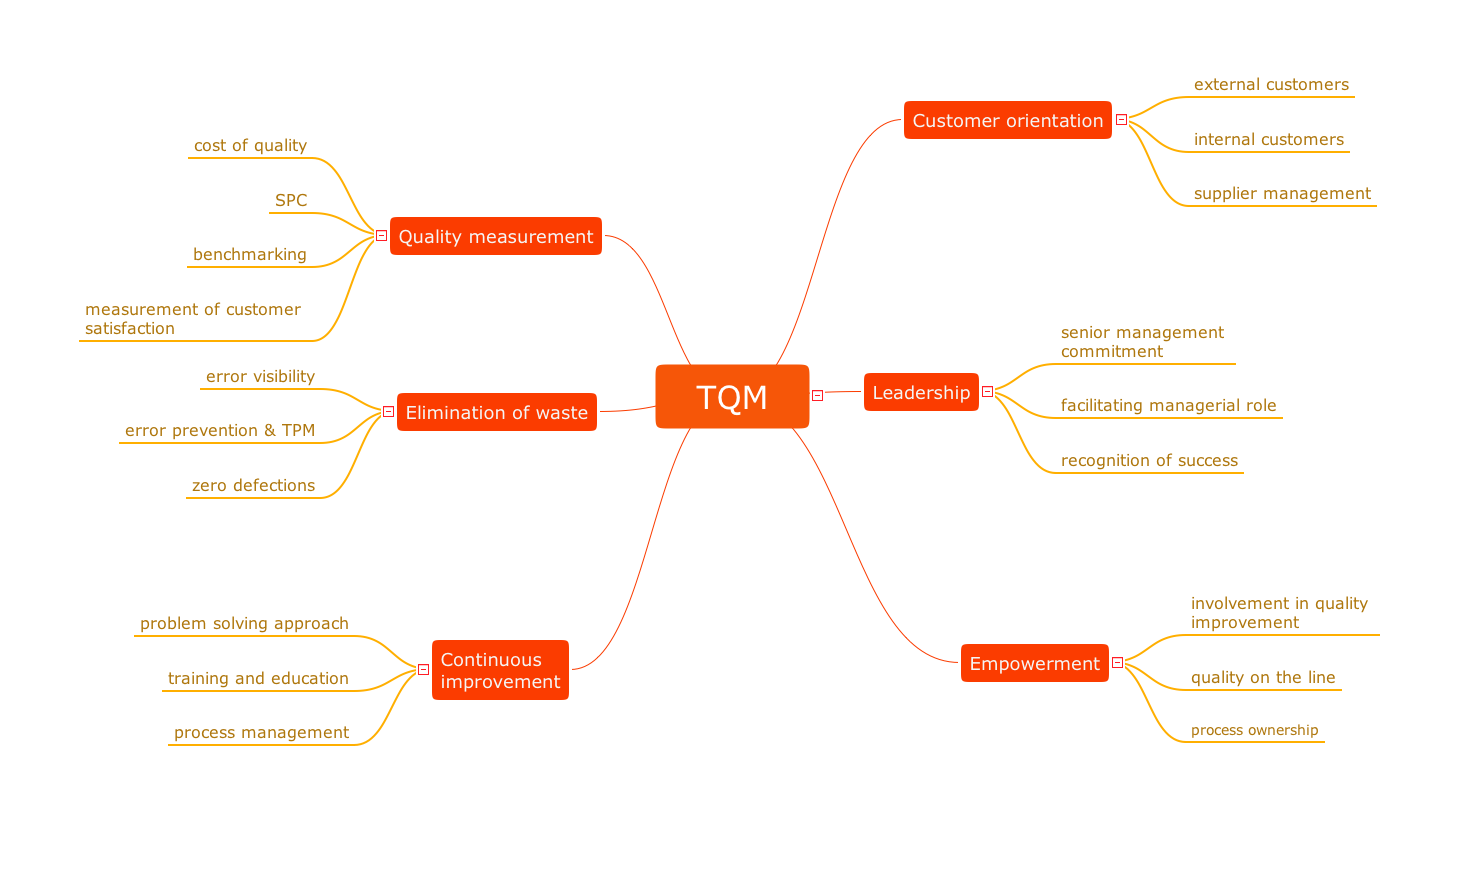
Picture: Quality issues in heir organization
Related Solution:
ConceptDraw MINDMAP with Quality mindmaps solution as a demonstration of the creative approach to quality management in daily work of quality management team.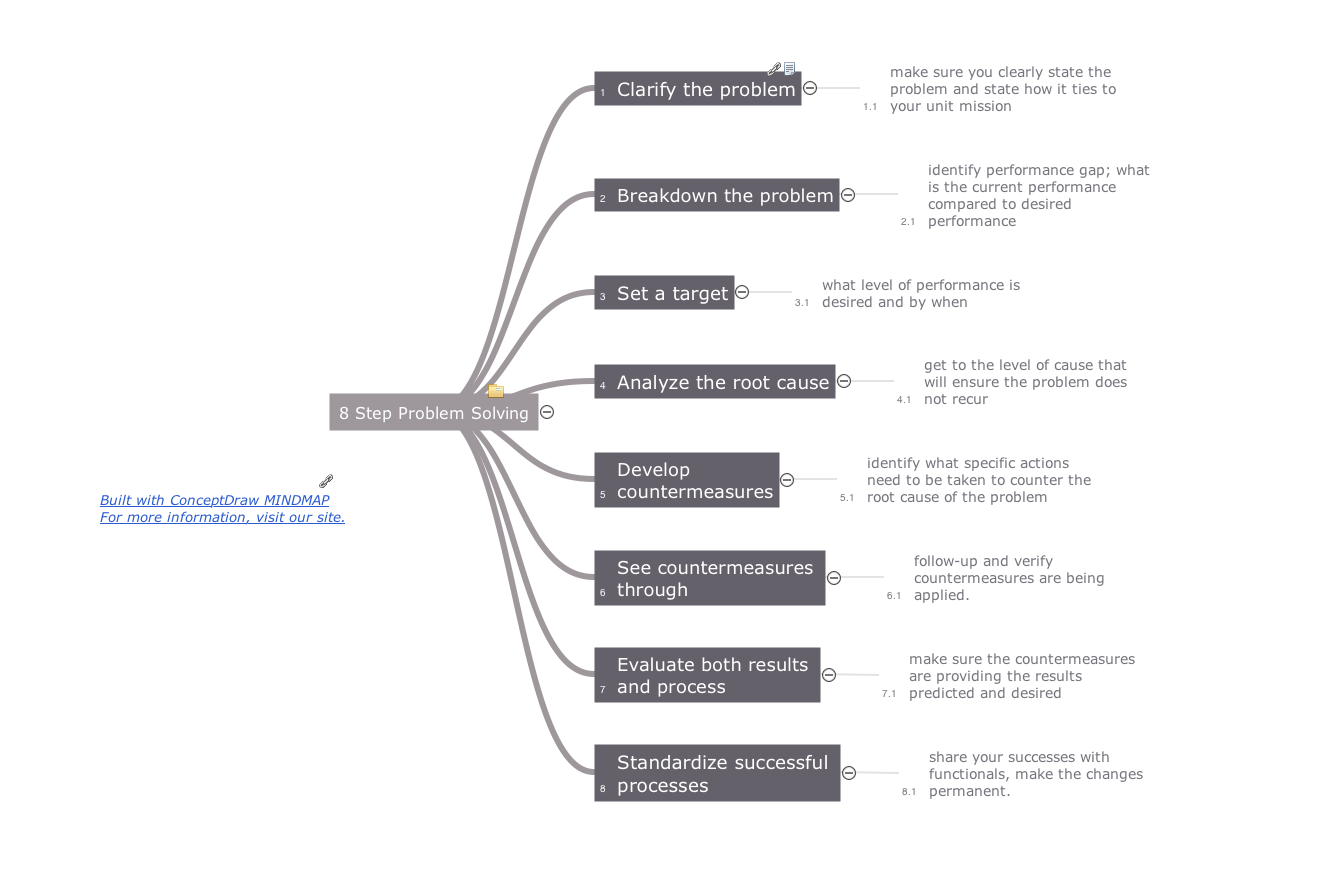
Picture: Quality Management Teams
Related Solution:
Chemical and Process Engineering solution contains variety predesigned process flow diagram elements relating to instrumentation, containers, piping and distribution necessary for chemical engineering, and can be used to map out chemical processes or easy creating various Chemical and Process Flow Diagrams in ConceptDraw DIAGRAM.
Picture: Process Flow Diagram Symbols
Related Solution:
AWS platform is great to develop reliable applications. If you are already aware of all the benefits that Amazon Web Services diagrams bring, then you'll need also a diagramming tool for architecture to share your vision. Luckily, ConceptDraw DIAGRAM has a special AWS Diagrams solution with vector icons and templates that are easy to edit.
The AWS architecture diagram, you see on this drawing, was designed using ConceptDraw Amazon Web Services Architecture Diagrams (AWS) solution. The 14 libraries, delivered with this solution introduces near 250 vector graphic images used to draw AWS Diagrams. The AWS Architecture Diagrams solution is a valuable tool for programmers, software architects and other IT professionals. It enables them to develop reliable applications with a high stage of interaction with AWS cloud.
Picture: Amazon Web Services Diagrams diagramming tool for architecture
Using Skype for Business will let you control teams and deliver information worldwide in a real-time. This is an important tool for everyday work.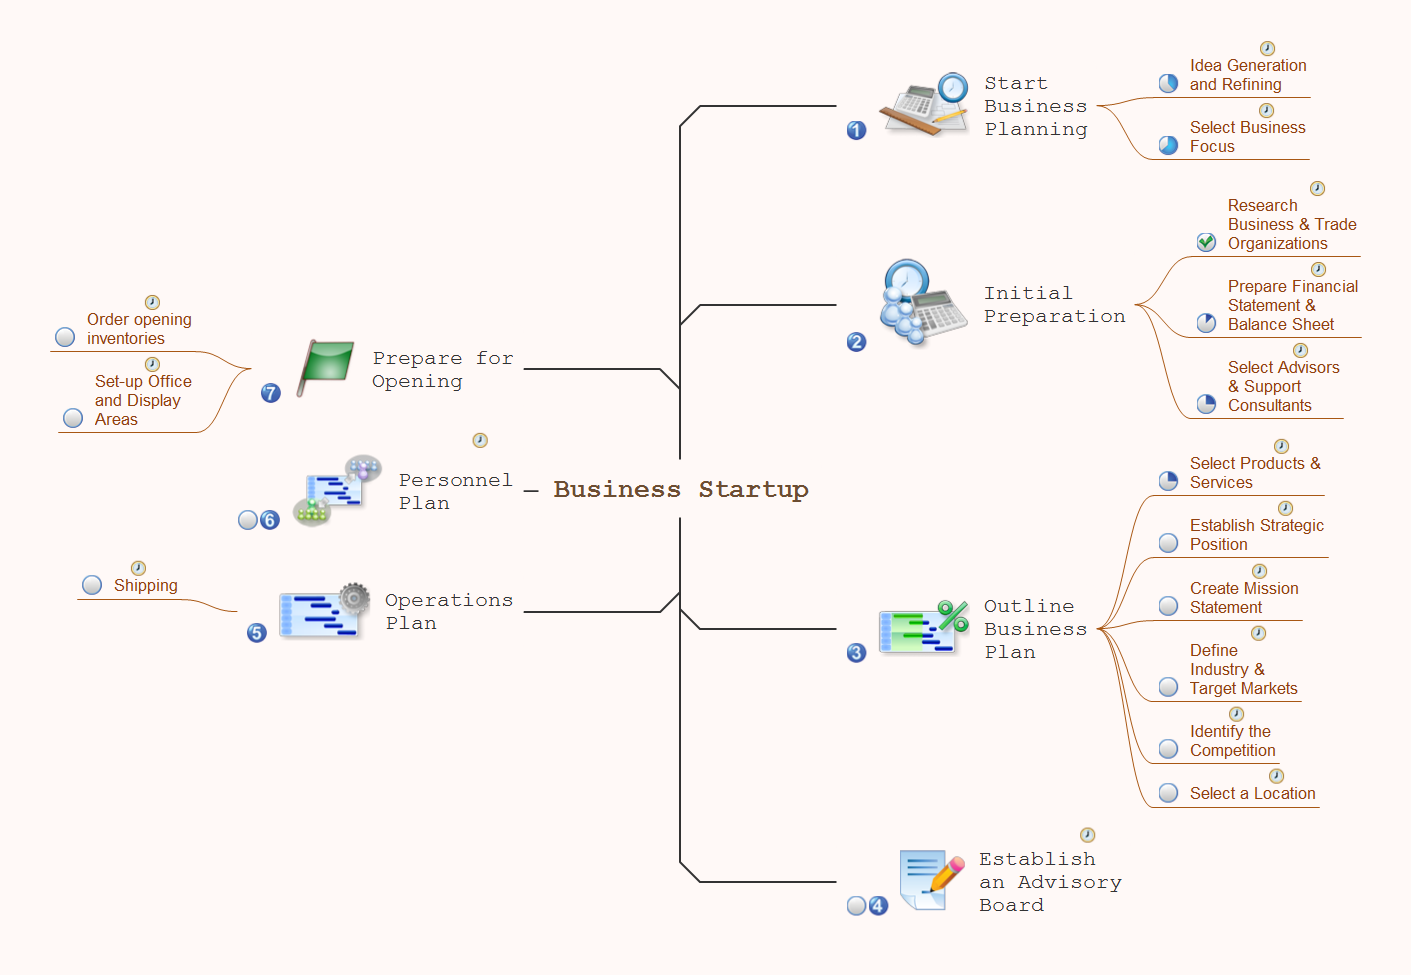
Picture: How To Use Skype for Business
Related Solution:
Successful quality management implemented in a company of any size is a critical component of a company organization.
Picture: What is a Quality Management
Related Solution:
ConceptDraw MINDMAP is a powerful business and personal productivity software application that provides visual organization and access to information for individuals and organizations.
Picture: ConceptDraw MINDMAP :Brainstorming, Mind Mapping for macOS and Windows
ConceptDraw
MINDMAP 16