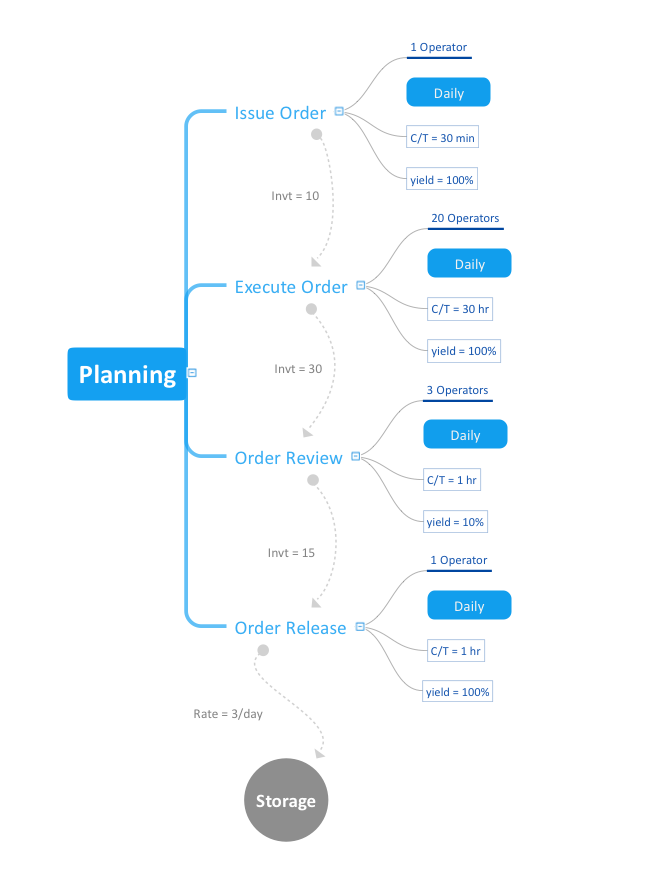
Pic.1 VSM mindmap.
This mind map was created in ConceptDraw MINDMAP and is available as a part of the Quality Mind Map Solution in the ConceptDraw Solution Park.
This mind map shows how Value Stream Maps can be represented as a mind map. Value Stream Maps can help a manufacturing team visualize the material and information flow required to deliver a product or a service to customers. Value Stream Maps are used in the Lean Manufacturing methodology to analyze and identify potential process improvement opportunities.
See also Samples:
TEN RELATED HOW TO's:
Working as a designer, you might find developing projects exciting and difficult at the same time. It is a challenging task to create a usable interior design that will fulfill all the customer’s requirements. So, in order to aid yourself, you can use special software to create site plans, landscape designs, furniture layouts.
This example of an interior plan introduces an internal area of a small cafe. The floor plan demonstrates interior angle "view from above". It involves many different elements of furniture such as tables , chairs and various cushioned furniture. Also it includes a kitchen fixtures and furniture. Making this plan was managed by the ConceptDraw Cafe and Restaurant Floor Plan solution. The libraries, composing this solution contain about vector graphic 300 objects. It can be use to help interior designers to develop interior design proposals, communicate ideas and concepts that relate to a interior design.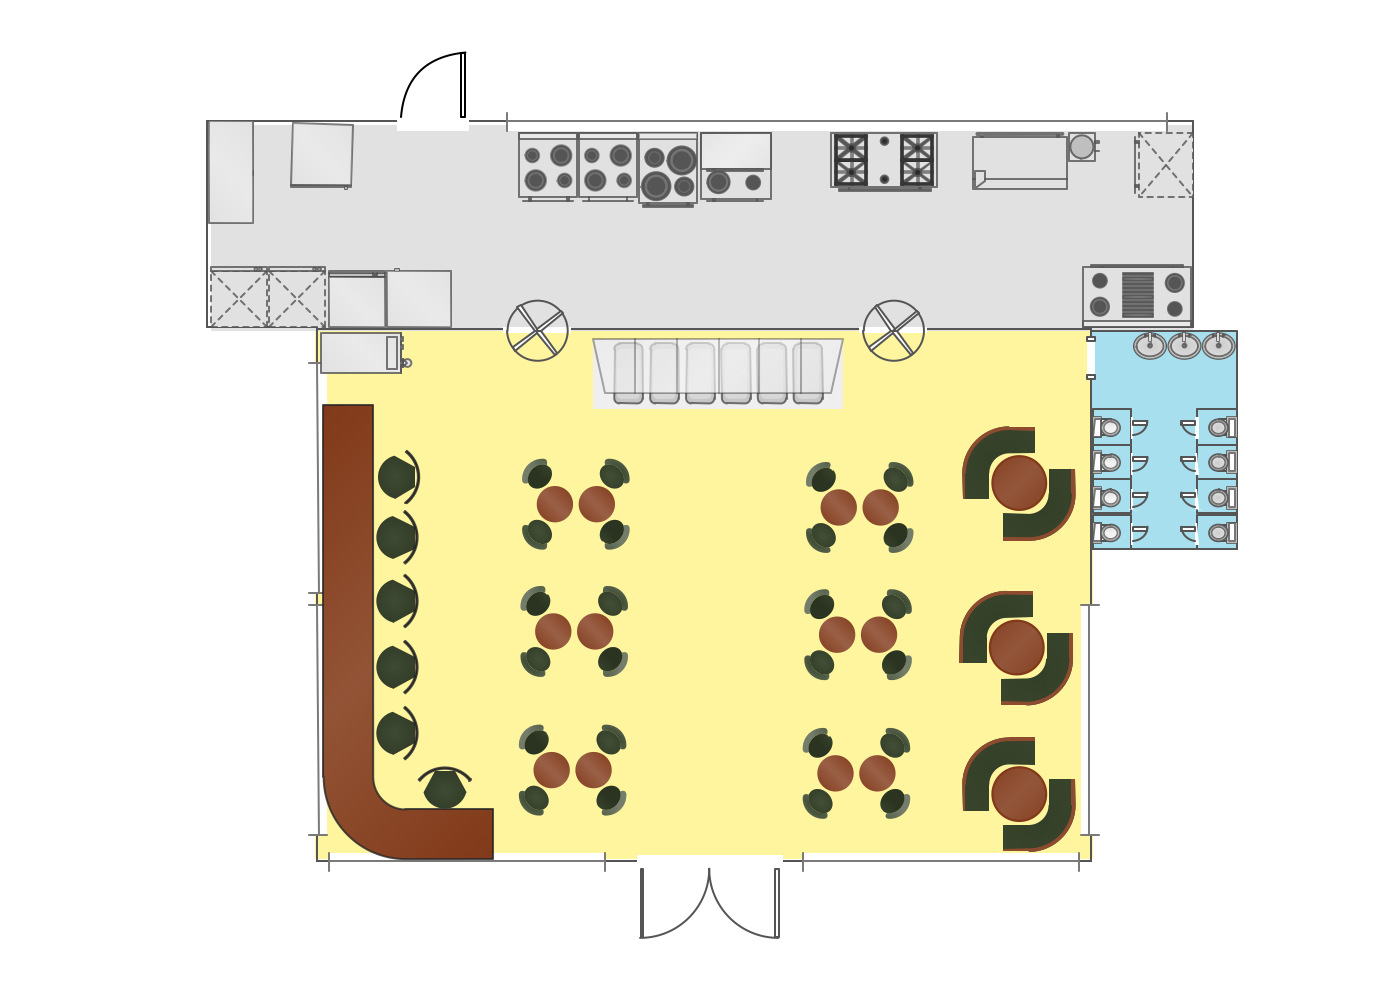
Picture: Interior Design
Related Solution:
High competition among the restaurants at the food court requires original design ideas. To attract visitors and increase sales are used many kinds of advertising products, brightly colored signboards, menus and show-cases, often are used the molds of beautifully decorated dishes. Now designing of colorful F&B (food and beverage) materials is easier than ever thanks to the ConceptDraw DIAGRAM diagramming and vector drawing software extended with Food Court Solution from the Food and Beverage Area of ConceptDraw Solution Park.
Picture: F&B
Related Solution:
ConceptDraw Value Stream Maps visualize for a manufacturing plant the material and information flow required to deliver a product/service to customers.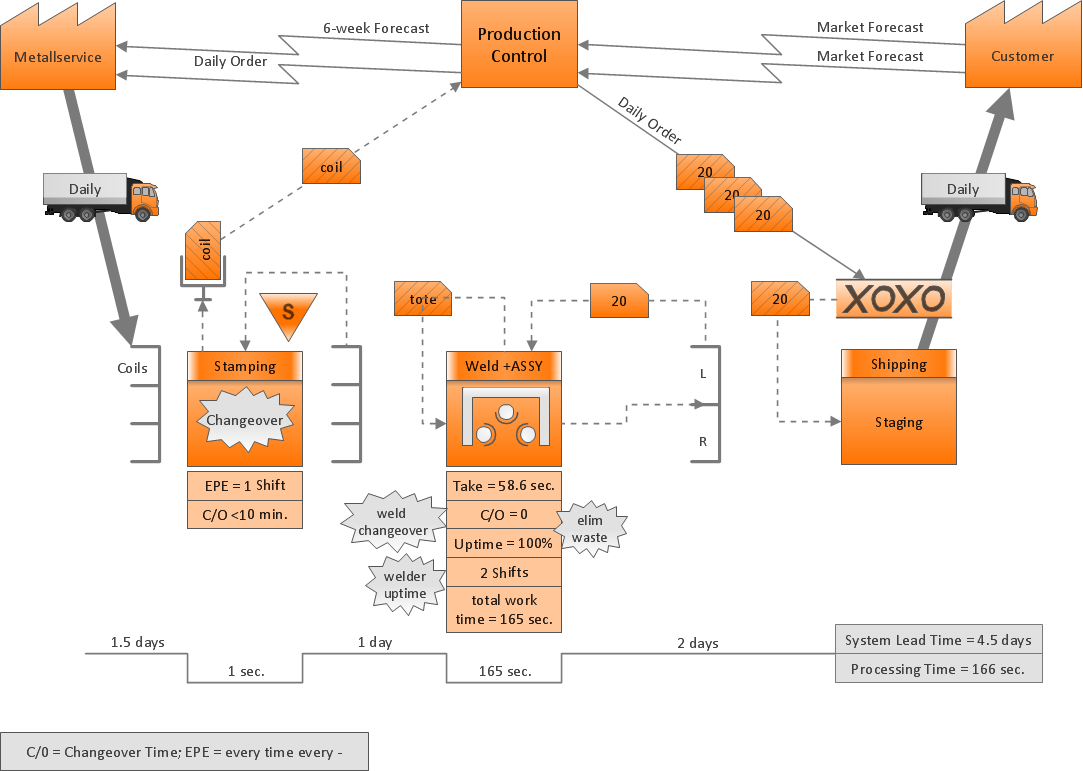
Picture: Purposes of a Value Stream Management Tool
Related Solution:
Quality Management Mind Maps - Presentations, Meeting Agendas, Problem will be solved.
The visual form of mind maps is helpful in all stages of quality management, from describing problem to describing and documenting a decision.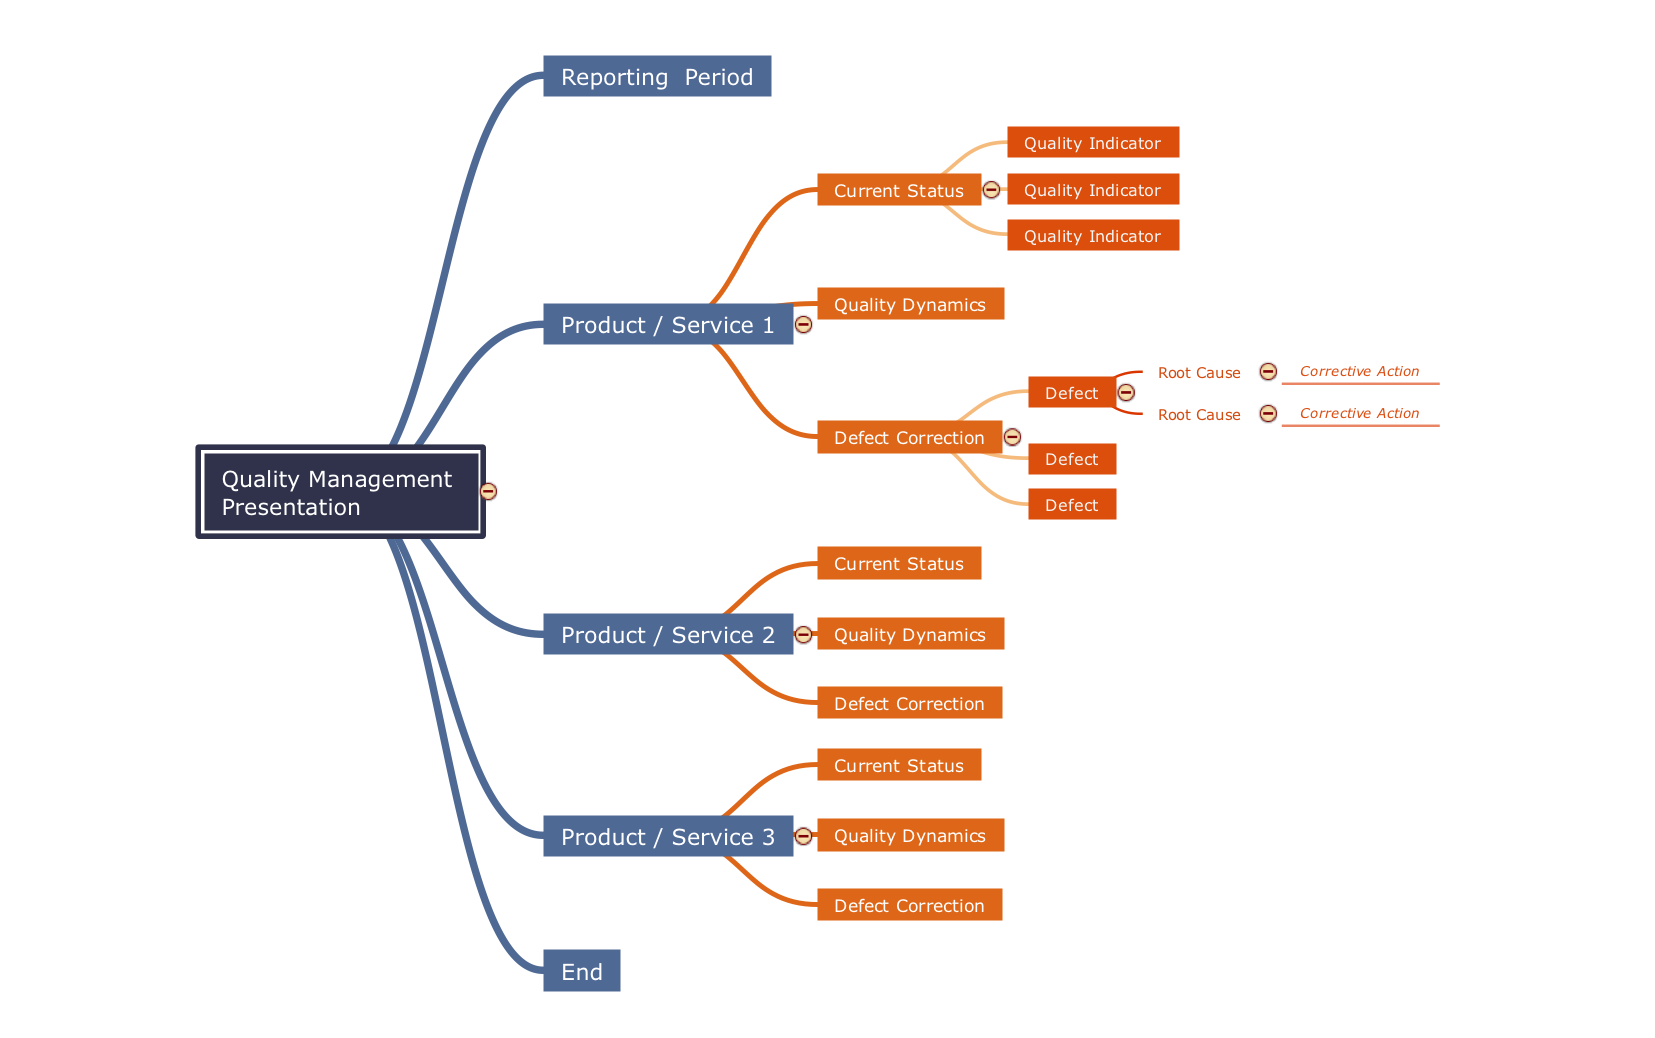
Picture: Quality Criteria MindMap
Related Solution:
How to draw Metro Map style infographics of New York subway.
New York Subway has a long history starting on October 27, 1904. Since the opening many agencies have provided schemes of the subway system. At present time are 34 lines in use. This page present New York City subway map construct with Metro Map Solution in Conceptdraw DIAGRAM software. This is a one-click tool to add stations to the map. It lets you control the direction in which you create new stations, change lengths, and add text labels and icons. It contains Lines, Stations, and Landmarks objects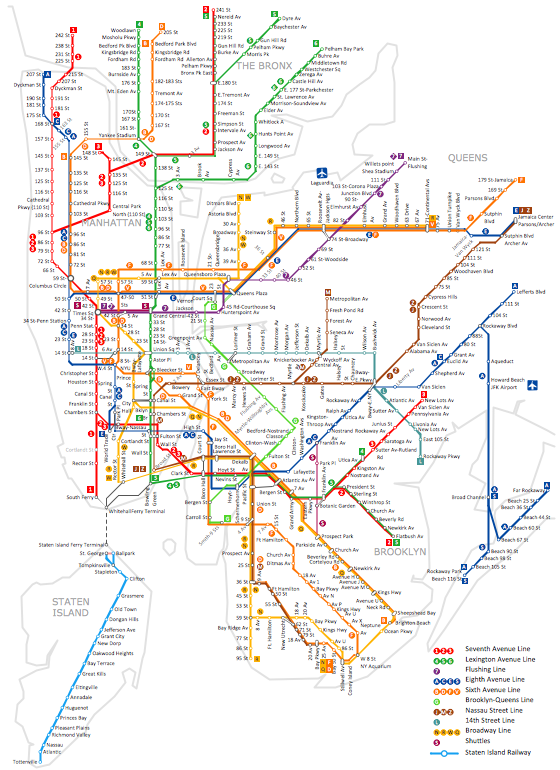
Picture: How to draw Metro Map style infographics? (New York)
Related Solution:
Using ConceptDraw quality mind maps is a perfect addition to quality visualization in your company.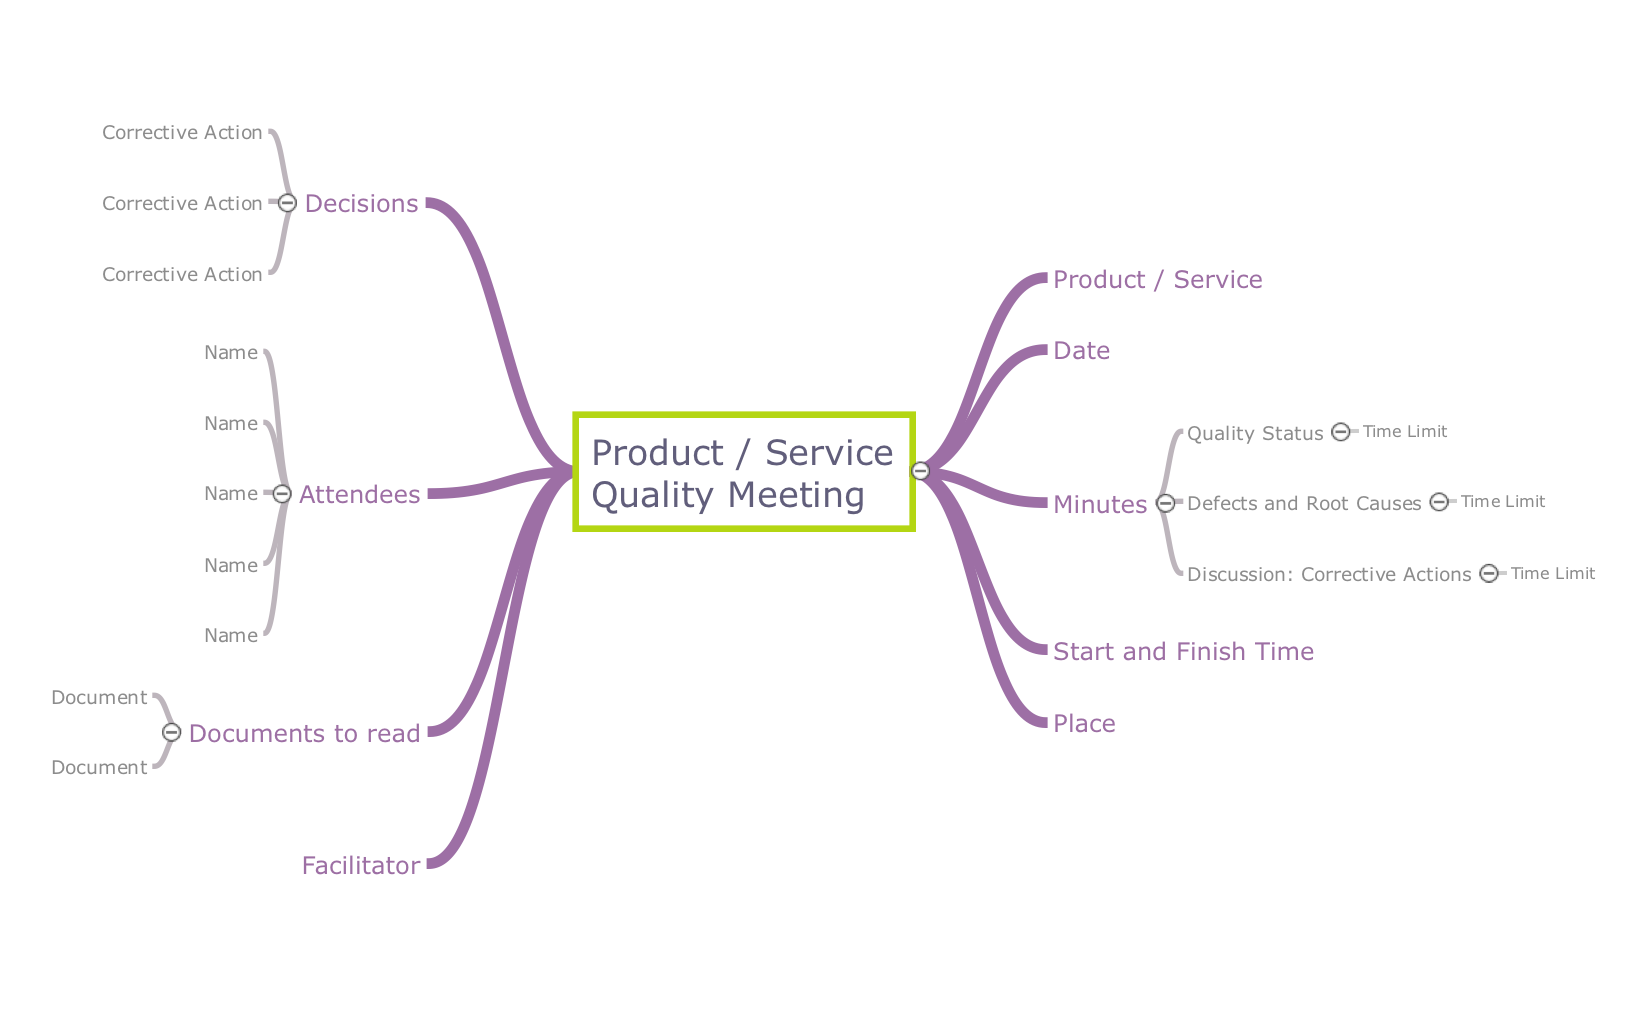
Picture: Quality visualization in your company
Related Solution:
Mind map template of a strategy map that can help you display a variety of performance measures that can have an impact on your organization.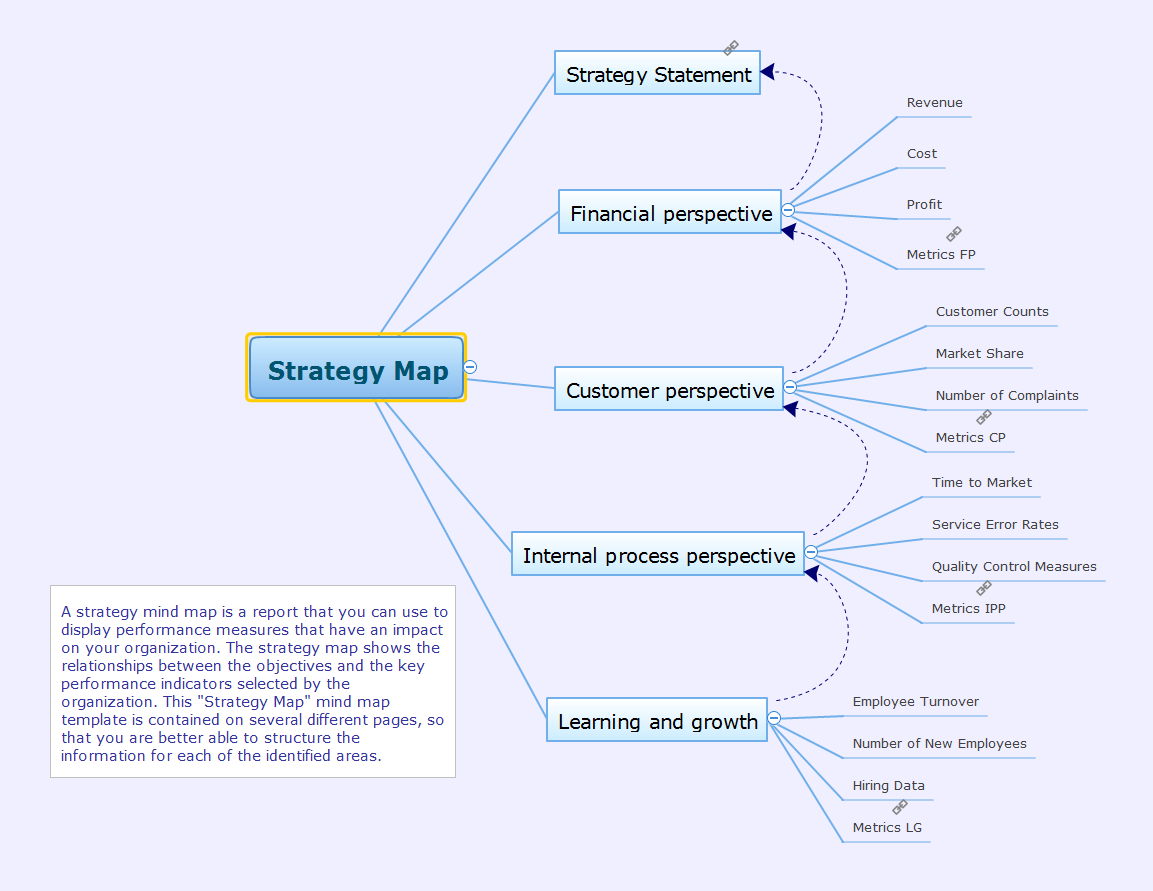
Picture: Strategy Map
Related Solution:
The food has great importance in human life, but it is very important that the food was tasty and salubrious. Preparing the food with help of different recipes from the fashion magazines, popular cookbooks, Internet cooking sites, we firstly pay attention to the recipe's design, how delicious and aesthetically the dish is presented on the picture.
Use the ConceptDraw DIAGRAM diagramming and vector drawing software extended with Cooking Recipes solution from the Food and Beverage area of ConceptDraw Solution Park for easy design colorful and eye-catching food recipes illustrations.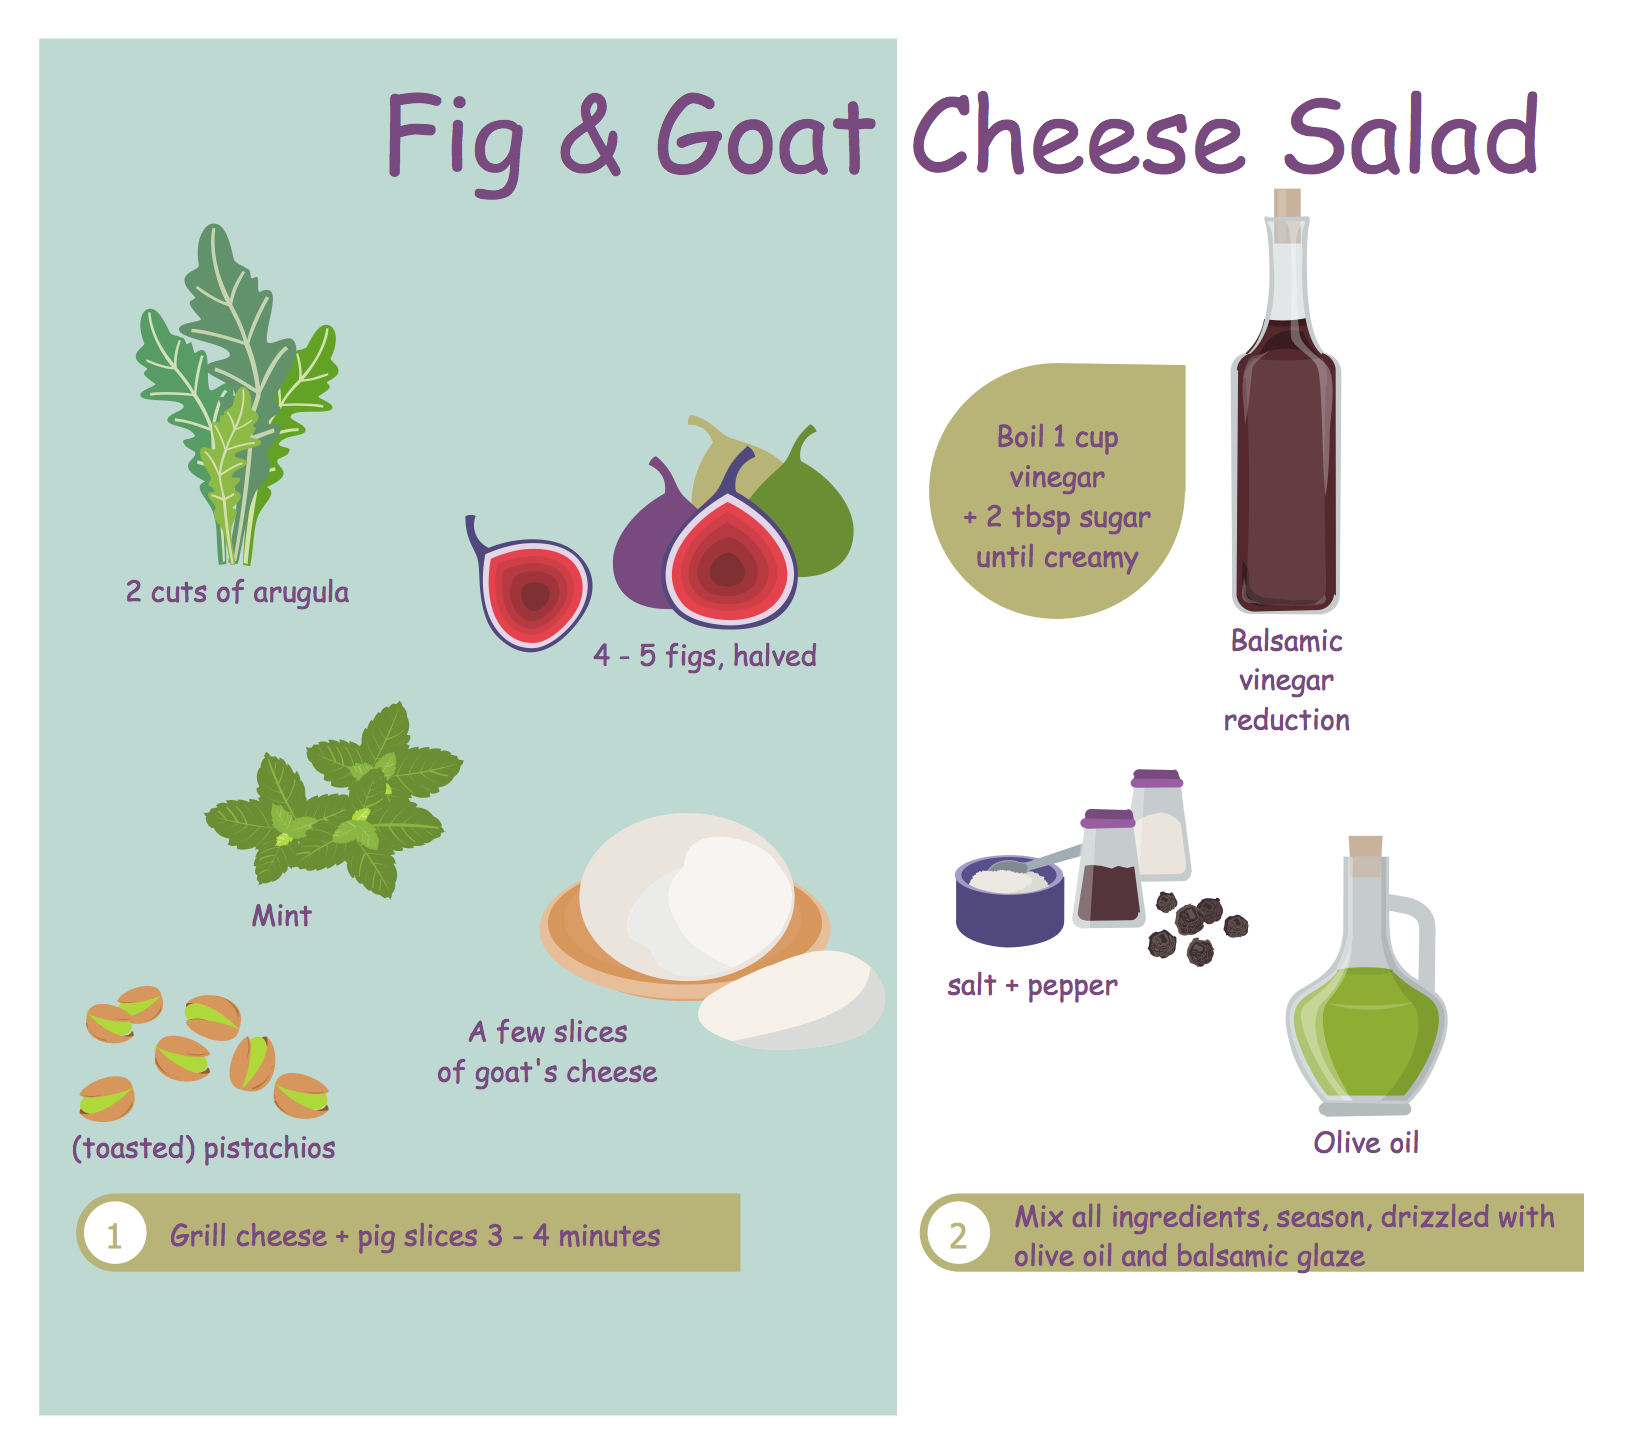
Picture: Food Recipes
Related Solution:
A flowchart is a simple but very functional tool when it comes to understanding a workflow or to removing unnecessary stages from a process. When drawing flowcharts, keep in mind that there are four common types of flowcharts, like document flowcharts and data flowcharts that show control over a data or document flow over a system. To show controls on a physical level, use system flowcharts. In addition, to show controls in a program, you can draw a program flowchart.
This flowchart diagram represents the piece of an article editing process, that involves the author and editor. It was created using the Basic Flowchart notation that consists from the basic flowchart symbols. The start and the end of the process are indicated with "Terminator" symbols. The "Process" symbols show the action steps consisting from making edits and searching for a compromise, when the author does not agree with the suggestions of the editor. The "Process" symbol is the general symbol in process flowcharts. The "Decision" symbol indicates a branching in the process flow. There are two branches indicated by a Decision shape in the current flowchart (Yes/No, Disagree/Agree). This basic flowchart can be used as a repeating unit in the workflow diagram describing the working process of some editorial office.
Picture: Types of Flowcharts
Related Solution:
When you prepare professional-looking presentation, you need to use ConceptDraw MINDMAP software for the amazing result.
Picture: Create Captivating Presentations Easily
Related Solution: