
Sample 1. Mindmap presentation - Sales plan.
Presentation Exchange solution extends ConceptDraw MINDMAP software with the ability to import presentations from Microsoft PowerPoint, as well as enhancing its existing presentation capabilities.
With the Presentation Exchange solution you can easily extract the content from a PowerPoint presentation to see how it all fits together in a single view. You can review slide content, see how the slides support one another, and refine the story.
TEN RELATED HOW TO's:
ConceptDraw DIAGRAM diagramming and vector drawing software extended with Target and Circular Diagrams solution from the Marketing area of ConceptDraw Solution Park is perfect for the Circular Flow Diagram creating.
Picture: The Circular Flow Diagram
Related Solution:
Flow charts are used in chemistry to draw chemical processes. ConceptDraw DIAGRAM software extended with Chemical and Process Engineering solution is the easiest for using a multifunctional diagramming tool, which will help to create a Flow Chart in chemistry, Chemistry diagrams of any type, and Chemistry flow diagrams with ease. You can illustrate any chemical processes in a few minutes, including refinery processes, distillation, the release of natural gas condensate, and many more.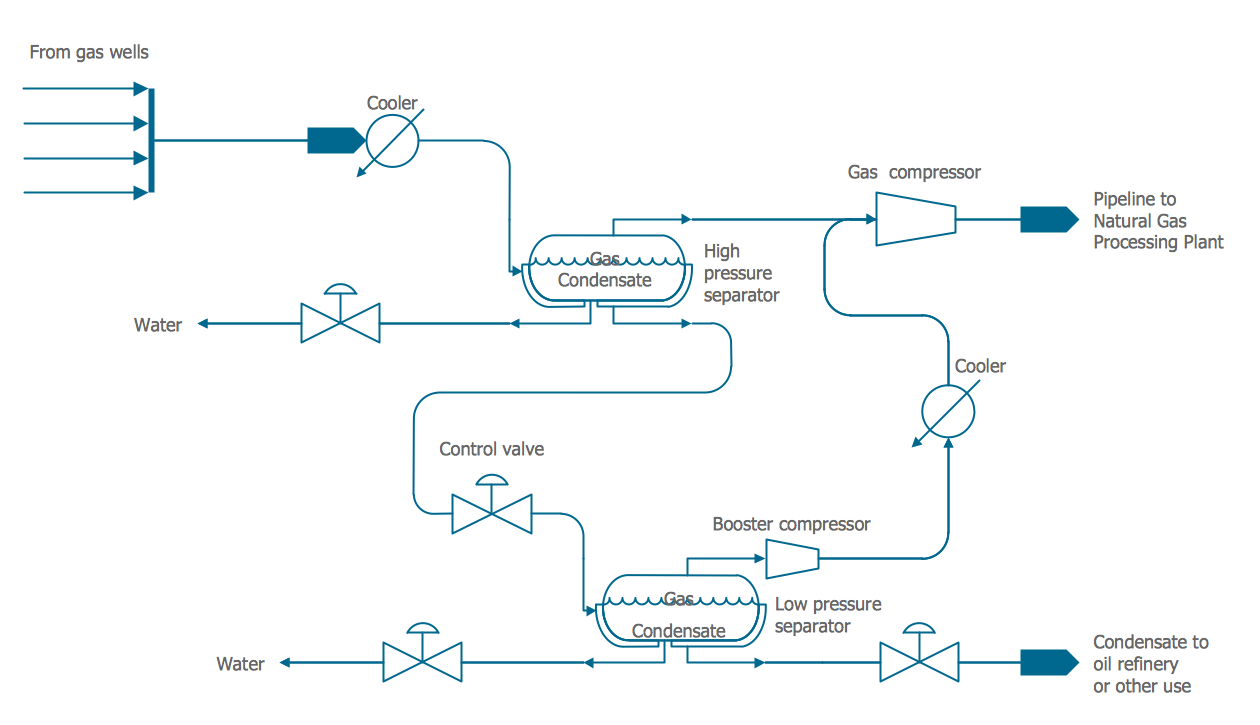
Picture: Flow Chart in Chemistry
Related Solution:
IT world is extremely rational and logical. So what can be more precise than Software Diagrams to rate the results of work? Visual statistics is the best way to understand the data.
This figure demonstrates the data flow diagram (DFD), which was created to describe the electronic system of custom purchase. This is the process of buying using electronic bar code scanning system. Such systems are used in large stores. The cashier scans the bar code, the system outputs the data on the price of the goods and carries out a purchase process. This DFD utilizes the Gane/Sarson notation. To create it The ConceptDraw DFD solution has been applied.
Picture: Software Diagrams
This sample shows the Flowchart that displays the architecture of SQL Exception Translation.
This sample was created in ConceptDraw DIAGRAM diagramming and vector drawing software using the Flowcharts solution from the Diagrams area of ConceptDraw Solution Park.
Picture: Sample Project Flowchart. Flowchart Examples
Related Solution:
Interactive tool helps you find the appropriate response to social media mentions quickly.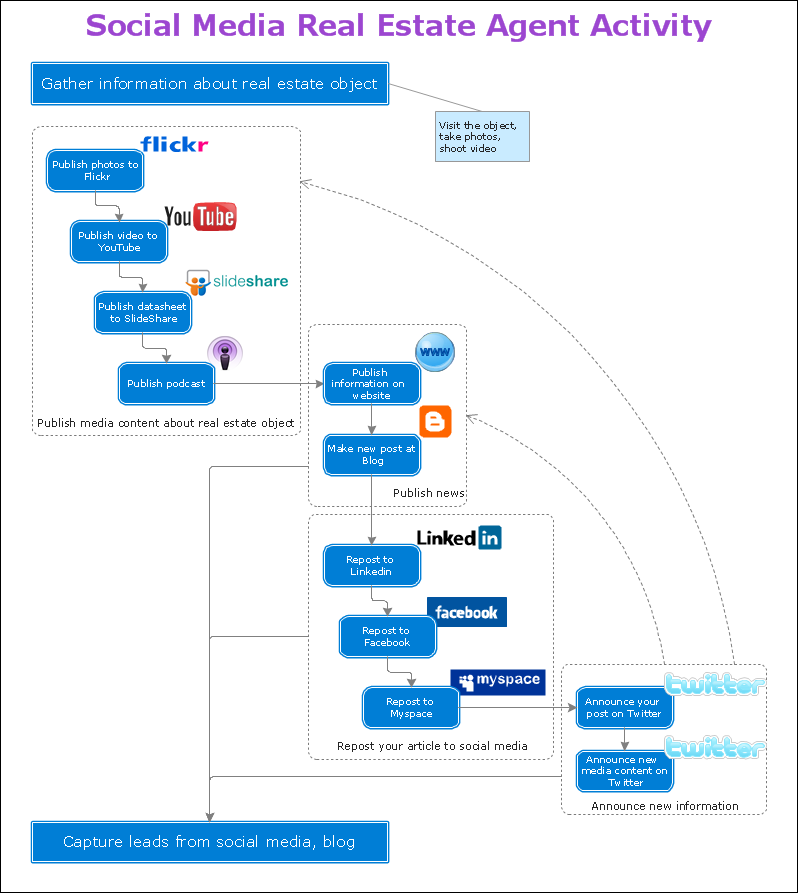
Picture: Organizing and Selecting Social Media Response Action
Related Solution:
Nowadays, more and more attention is paid to the comfort in the workplace, so that employees might be more motivated. Thus, it can be said with full confidence that office layout plays an important role for employees and influences company reputation. Many worldwide known companies have headquarter offices resembling more of a campus than of an office building.
Every organization has its own unique office design ideas, needs and requirements. Each of office position requires a certain type of person who has his own requirements, needs and habits. Office layout should be designed to facilitate its business function. The well-organized office space plays an important role in a workflow enhancement and productivity improvement. This office layout diagram demonstrates a typical cubical office layout. This diagram can be use as a template for cubicle office layout organization. This visual example can help shape ideas and design your office layout conception. You can start with adding your requested office furniture objects into your office floor plan. Plants help to create a healthy indoor environment. You can design an office space that totally fits your needs.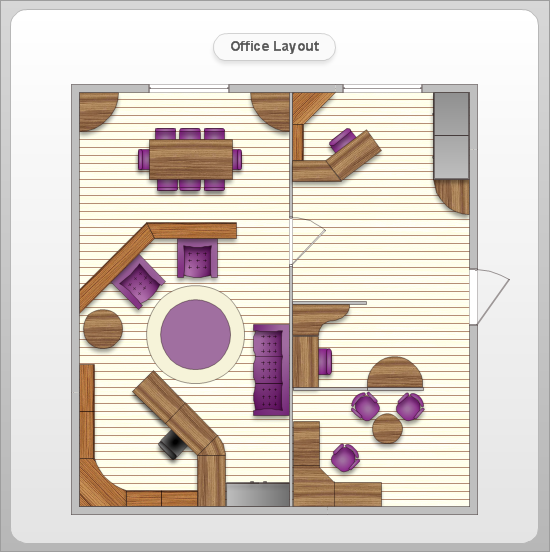
Picture: Office Layout
Related Solution:
To support you in your tasks you can use the power of ConceptDraw DIAGRAM providing intelligent vector graphics that are useful for Business Process diagramming and ConceptDraw MINDMAP for key Business Process mind maps.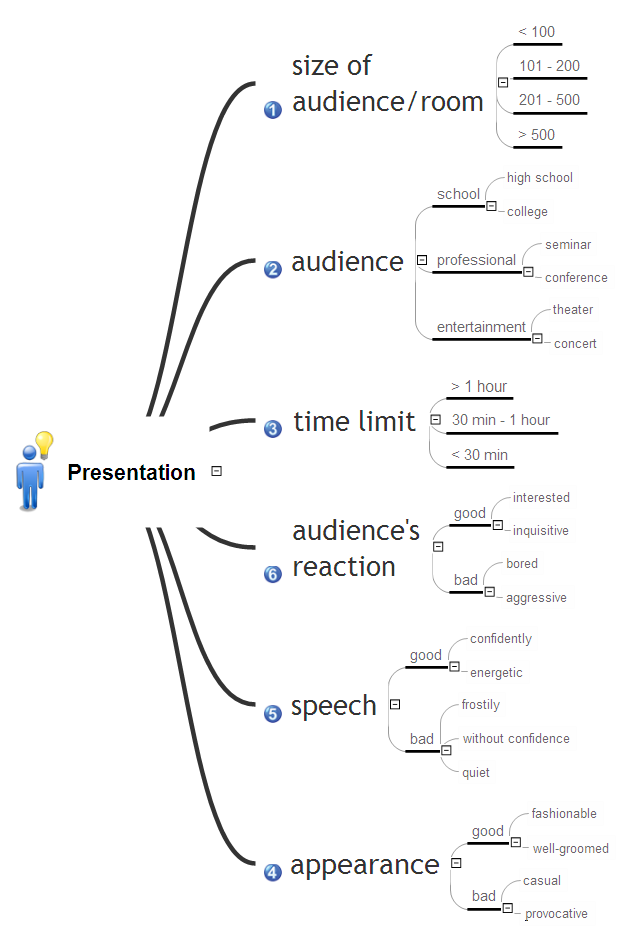
Picture: Business Process
Related Solution:
Users can create Value Stream Mapping Presentations using presentation mode in ConceptDraw DIAGRAM.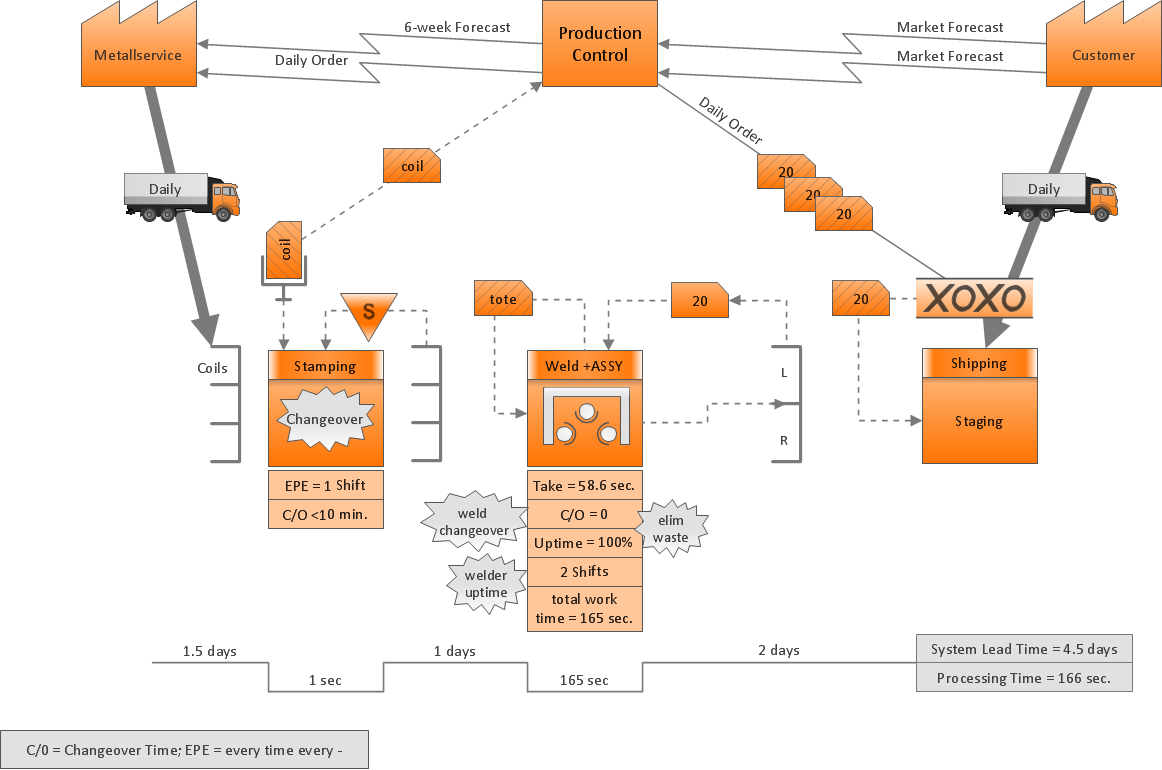
Picture: Value Stream Mapping Presentations
Related Solution:
Great examples of Infographic Maps, they are needed for inspiration.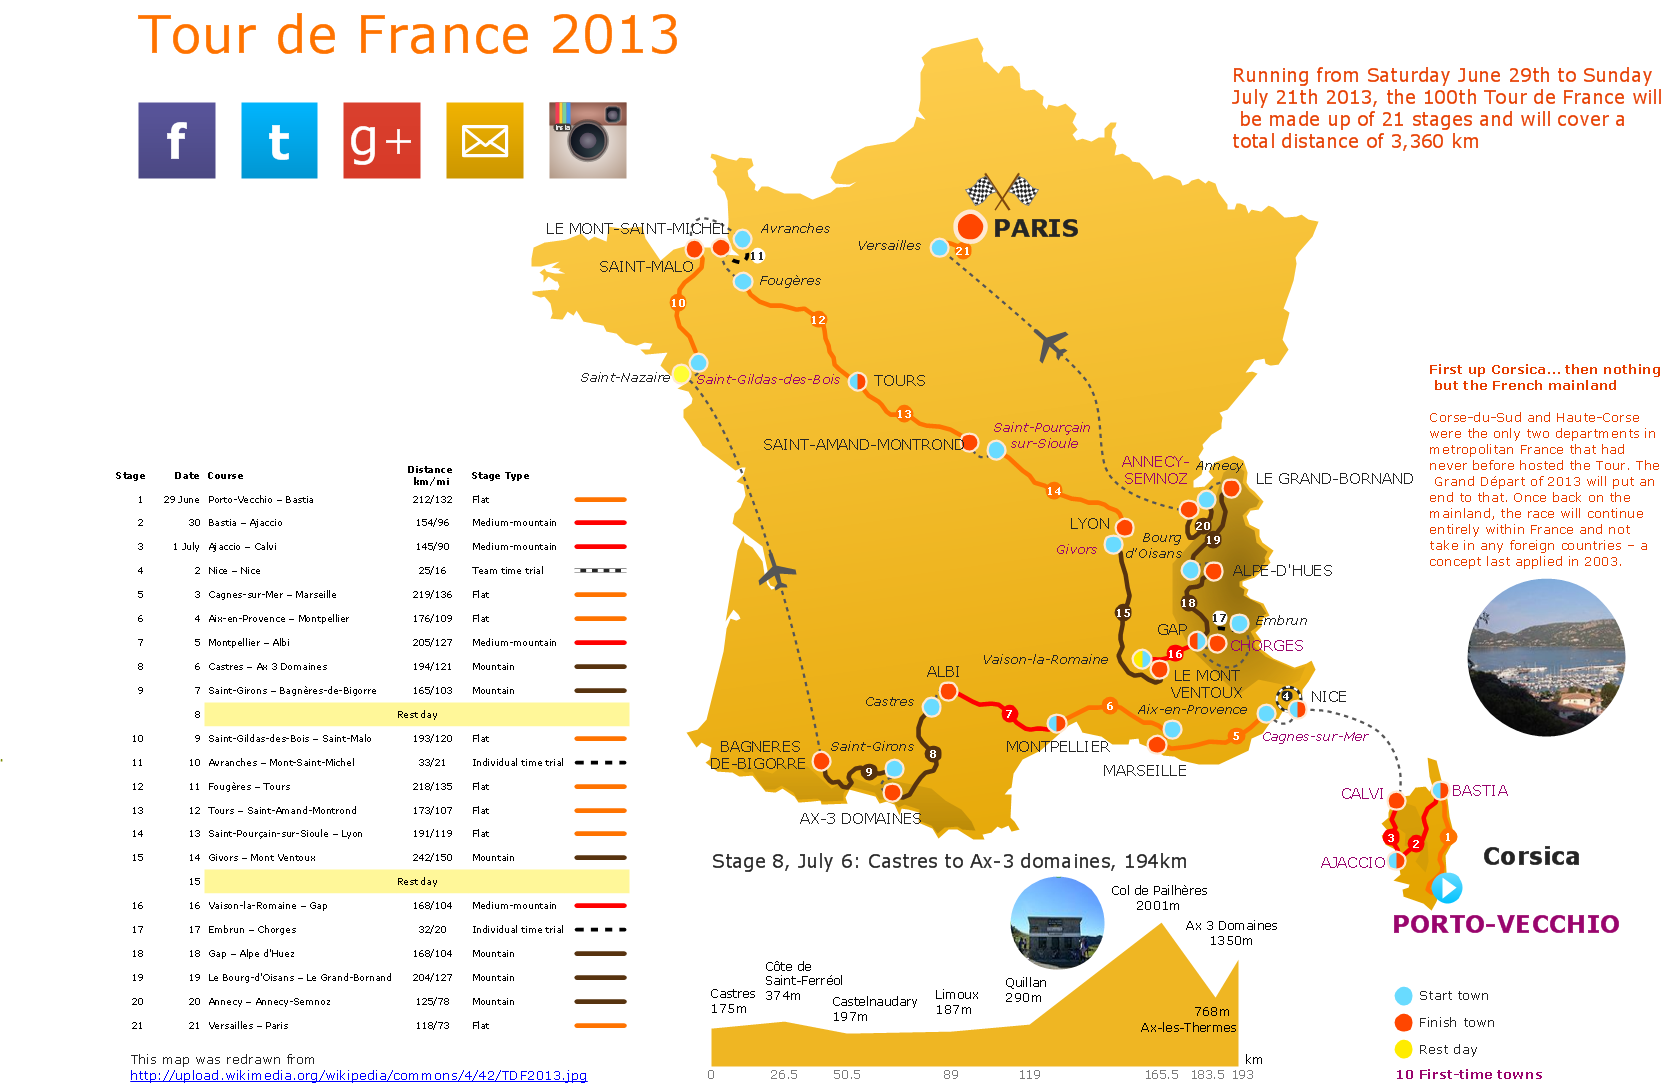
Picture: Superb Examples of Infographic Maps
ConceptDraw MINDMAP and Evernote has a multitude of options for users — you can save any part of a mind map: including topics, branches, and entire maps to your Evernote.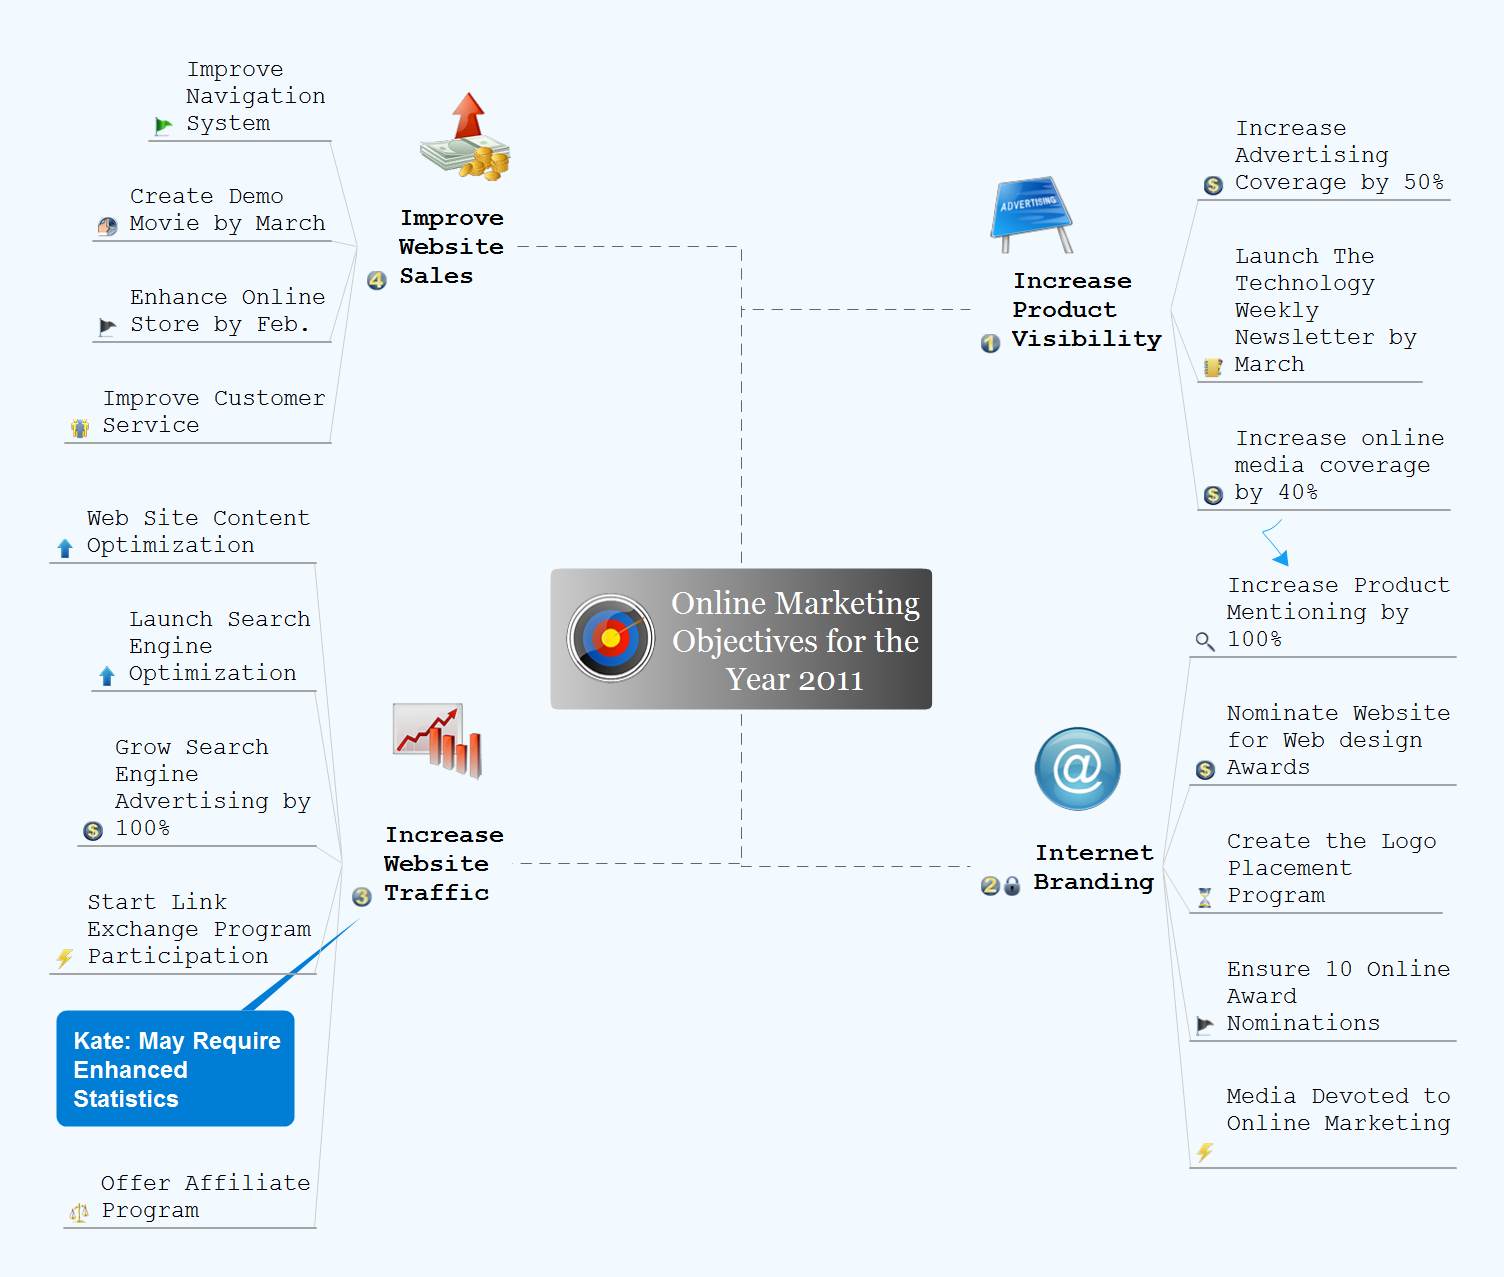
Picture: Evernote + MindMapping
Related Solution: