This mind map was created in ConceptDraw MINDMAP and it is available as a part of the Quality Mind Map Solution.
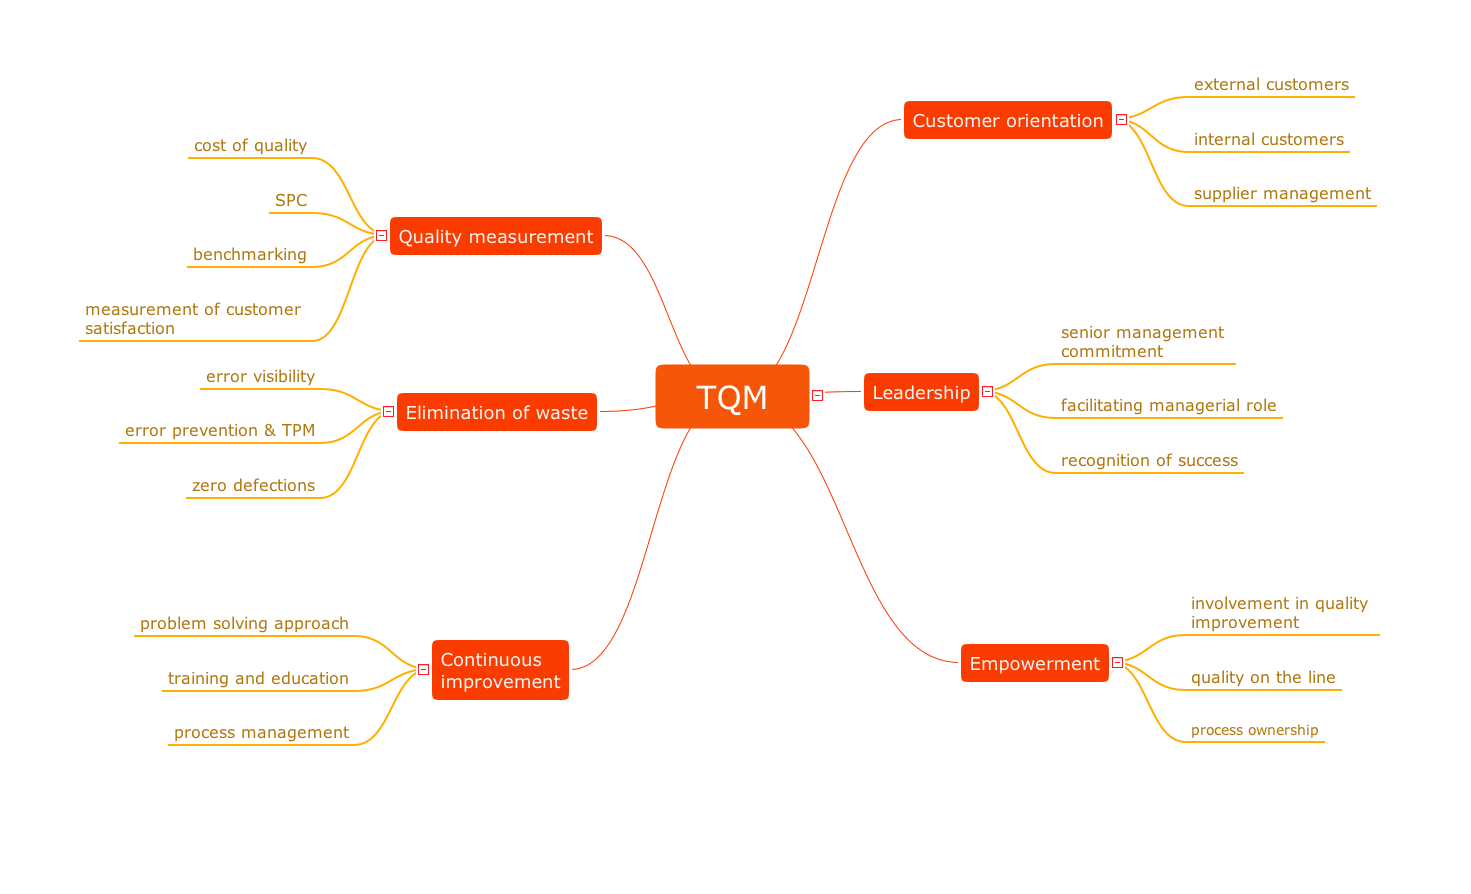
This mind map demonstrates how the well-known Total Quality Management (TQM) methodology can be presented in a mind map. Using mind mapping for quality management is a creative approach that allows one to structure all key quality points on the one page.
TEN RELATED HOW TO's:
The visual form of mind maps is helpful in all stages of quality management, from describing problem to describing and documenting a decision.
Picture: Quality Project Management with Mind Maps
Related Solution:
The HR Management Software is an incredibly powerful tool for those who need to analyze or present human resource process flows in a visually effective manner.
Picture: HR Management Software
Related Solution:
ConceptDraw MINDMAP has impressive import and export capabilities includes following formats: OPML, Mindjet MindManager; Microsoft Office products: PowerPoint, Project, Word; FreeMind (import only); XMind (import only).
Now ConceptDraw MINDMAP users and Mindjet MindManager users can freely exchange their mind maps using the Mind Map Exchange solution available in Solution Park.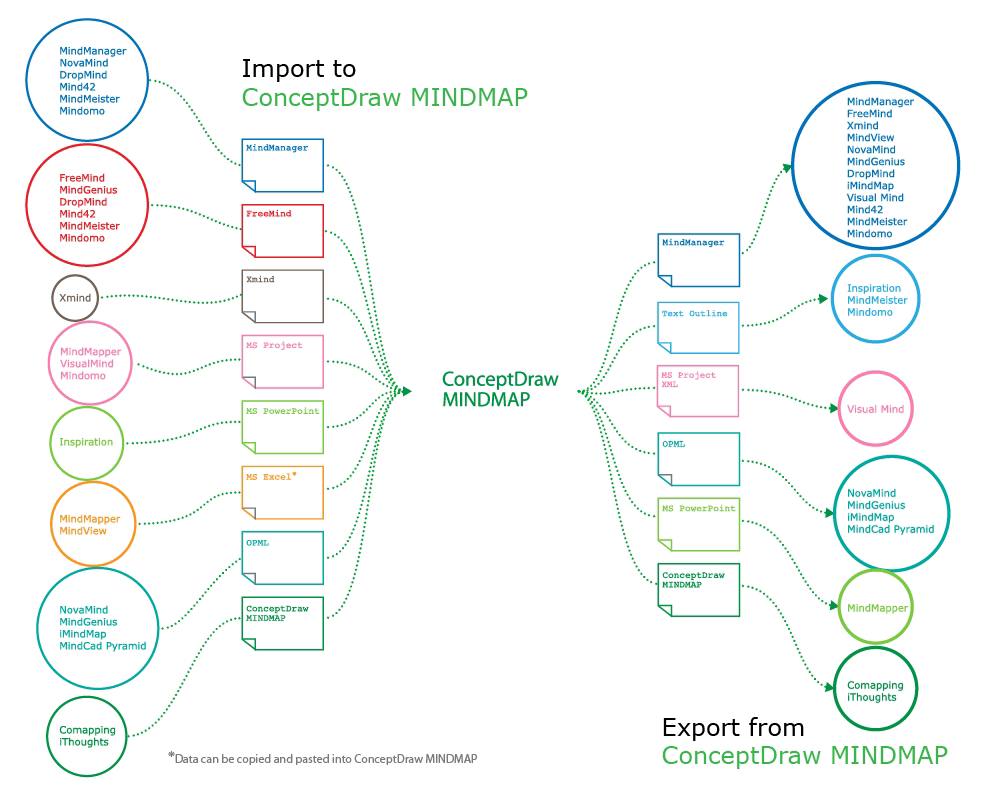
Picture: How to Import Mind Maps from XMind
Related Solution:
Successful quality management implemented in a company of any size is a critical component of a company’s organization.
You can use mind maps for a complete quality process analysis, giving more visibility to the focal points that you need to get clear.
Picture: Successful Quality Management
Related Solution:
While creating flowcharts and process flow diagrams, you should use special objects to define different statements, so anyone aware of flowcharts can get your scheme right. There is a short and an extended list of basic flowchart symbols and their meaning. Basic flowchart symbols include terminator objects, rectangles for describing steps of a process, diamonds representing appearing conditions and questions and parallelograms to show incoming data.
This diagram gives a general review of the standard symbols that are used when creating flowcharts and process flow diagrams. The practice of using a set of standard flowchart symbols was admitted in order to make flowcharts and other process flow diagrams created by any person properly understandable by other people. The flowchart symbols depict different kinds of actions and phases in a process. The sequence of the actions, and the relationships between them are shown by special lines and arrows. There are a large number of flowchart symbols. Which of them can be used in the particular diagram depends on its type. For instance, some symbols used in data flow diagrams usually are not used in the process flowcharts. Business process system use exactly these flowchart symbols.
Picture: Flowchart Symbols: Meaning and Examples
Related Solution:
Use Task Board to visualize the Scrum-ban Task Board as a mind map.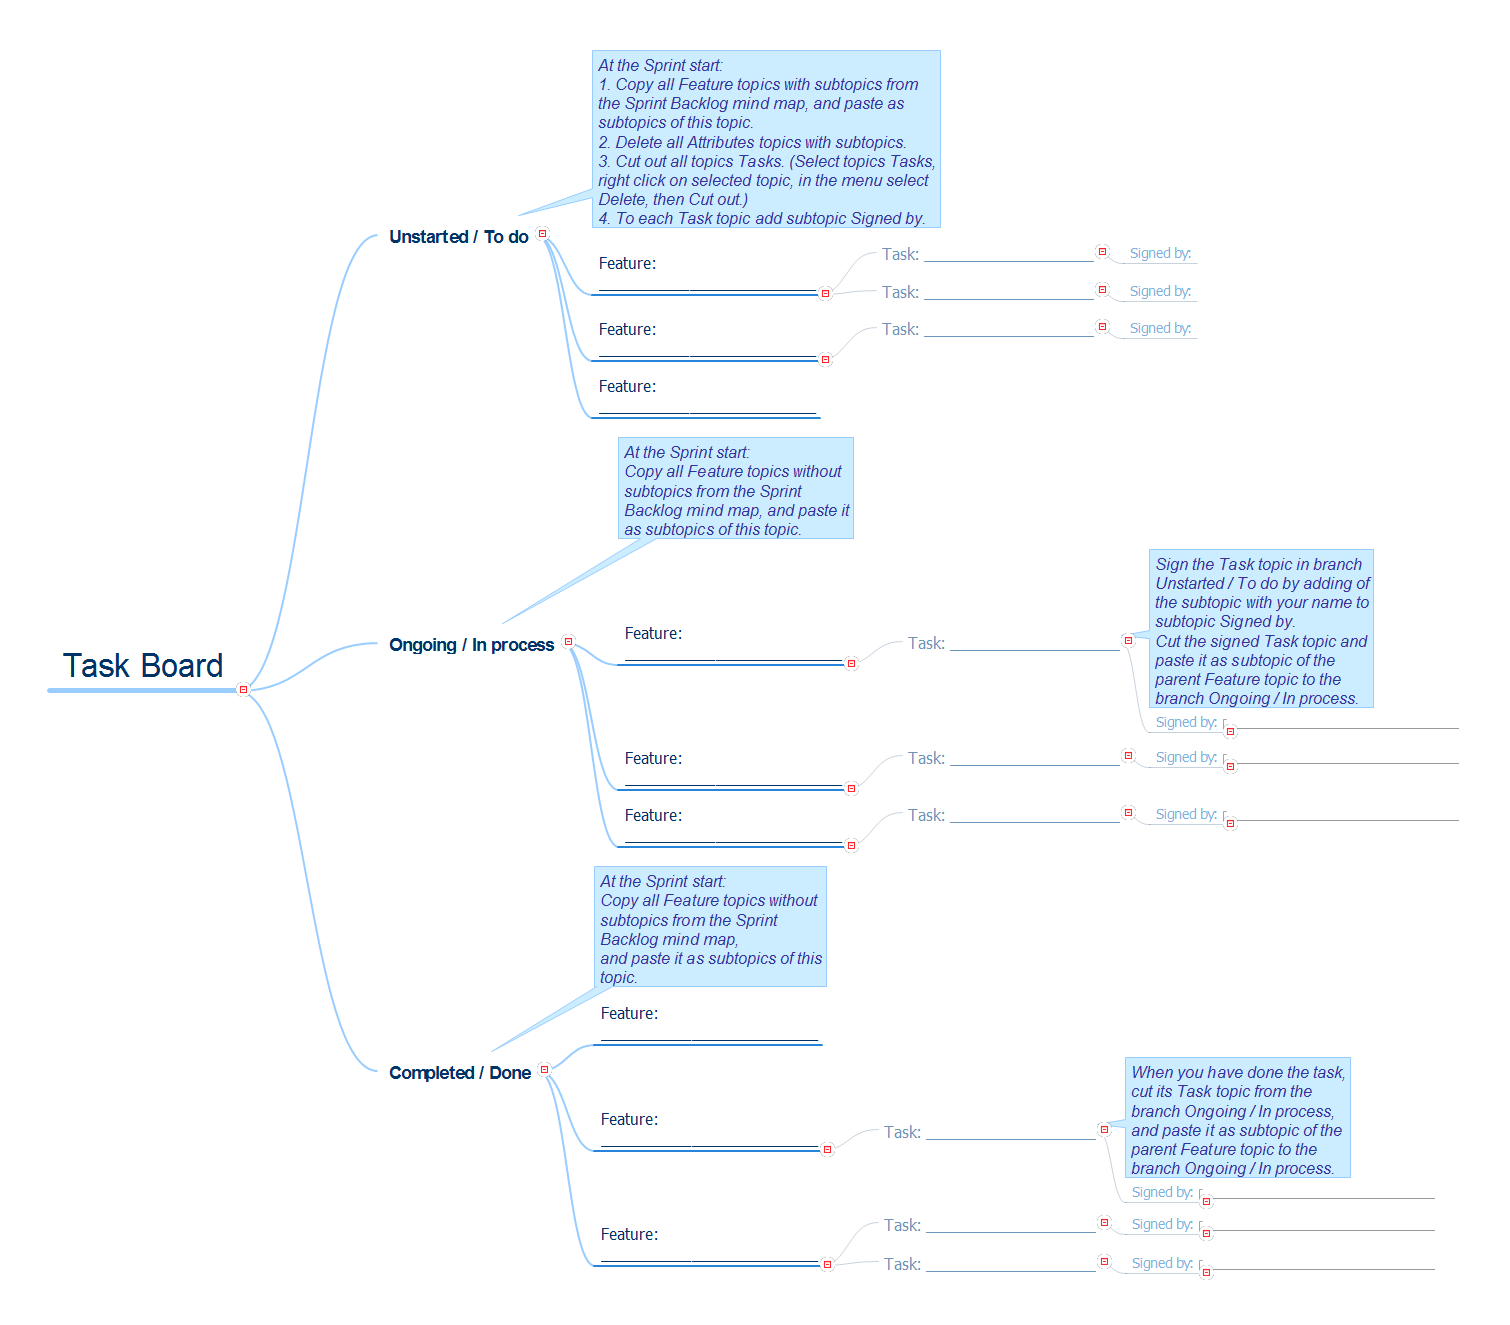
Picture: Task Board
Related Solution:
Use ConceptDraw DIAGRAM software with Flowcharts Solution to create Process Flow Charts, Flow Chart Process Maps, and High-Level Process Flow Charts to illustrate ✔️ high-level processes in industrial, chemical, and process engineering, ✔️ major plant processes, ✔️ minor details
Picture: Process Flow Chart
Related Solution:
Using ConceptDraw quality mind maps is a perfect addition to quality visualization in your company.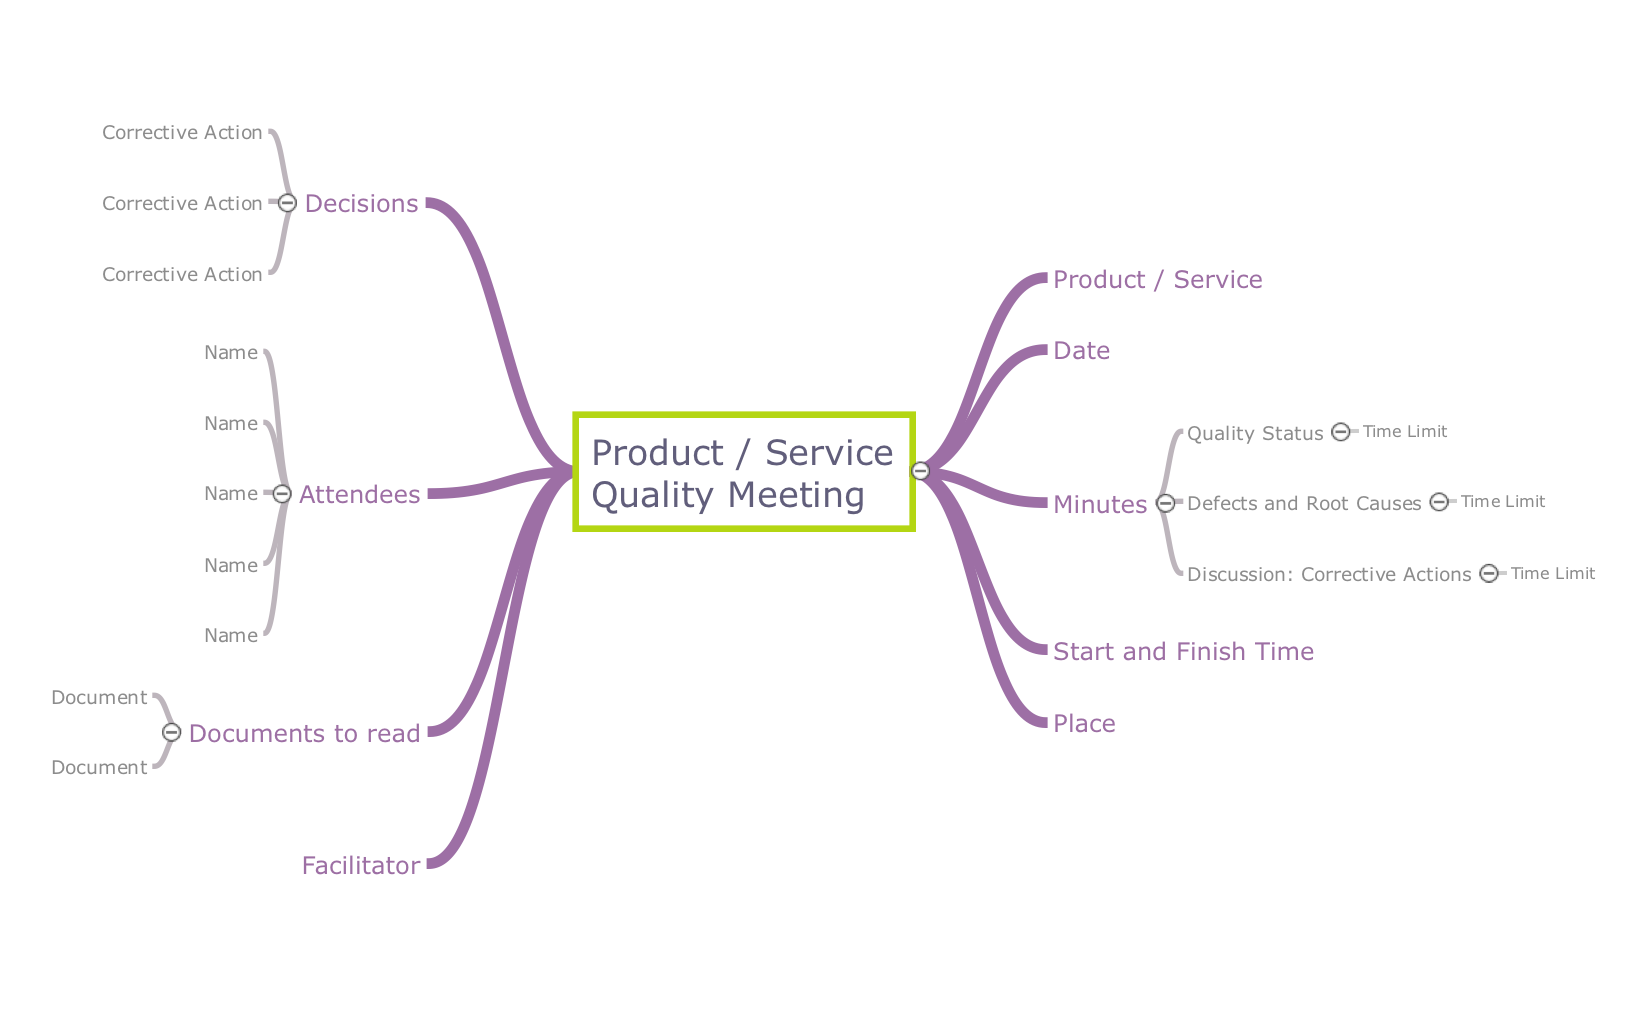
Picture: Quality visualization in your company
Related Solution:
The Secret Weapon: Evernote and ConceptDraw MINDMAP. They have a multitude of the options — you can save any part of a mind map: including topics, branches, and entire maps to your Evernote.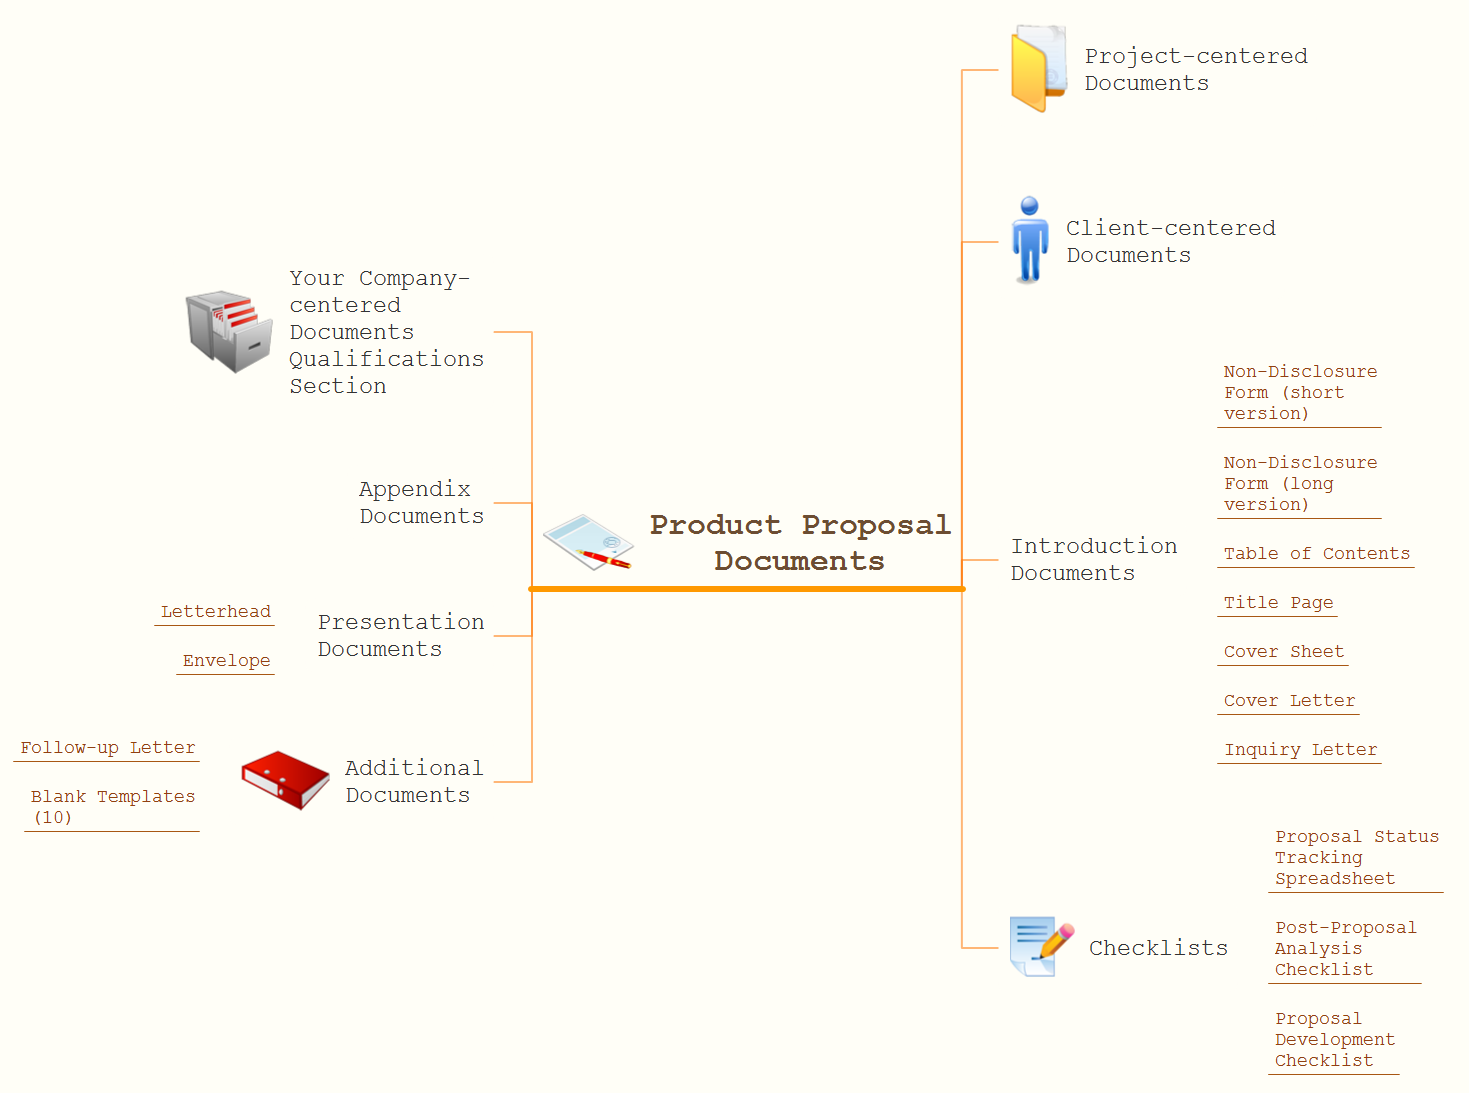
Picture: The Secret Weapon: Evernote
Related Solution:
Website wireframe is a detailed view of design or its skeleton. It shows all the important elements of the final website, the main groups of contents, information structure, describes the user's interaction with interface and its estimated visualisation.
ConceptDraw DIAGRAM extended with Website Wireframe solution from the Software Development area is the best wireframing software. Using the wireframe tools, libraries of vector objects, template and examples which offers a Website Wireframe solution, you will easily design the websites wireframes of any complexity.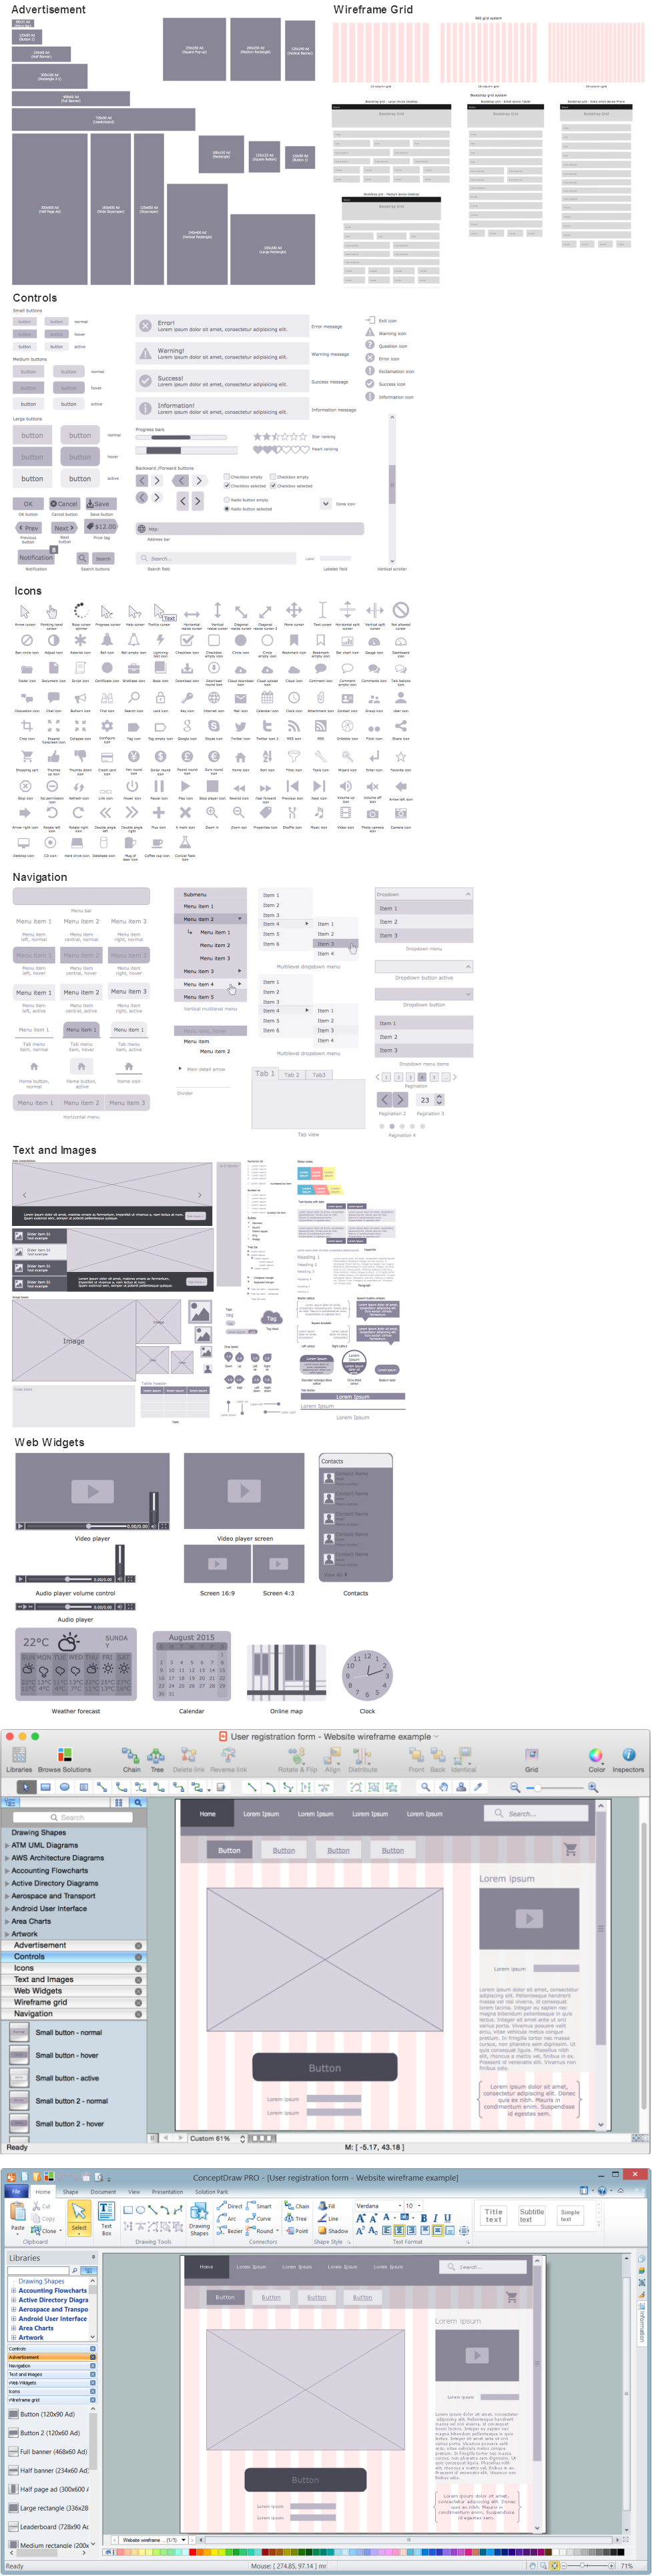
Picture: Wireframing
Related Solution: