Quality Mind Maps - samples and templates
ConceptDraw MINDMAP with the new Quality MindMap solution is a perfect addition to quality visualization in your company. The mind map sample you see on this page were created in ConceptDraw MINDMAP as a demonstration of the creative approach to implementing quality management methods into daily work that Quality Mind Map solution offers. You can use these samples and templates to describe your own quality processes, brainstorm, and structure quality issues; then quickly present it to your team.
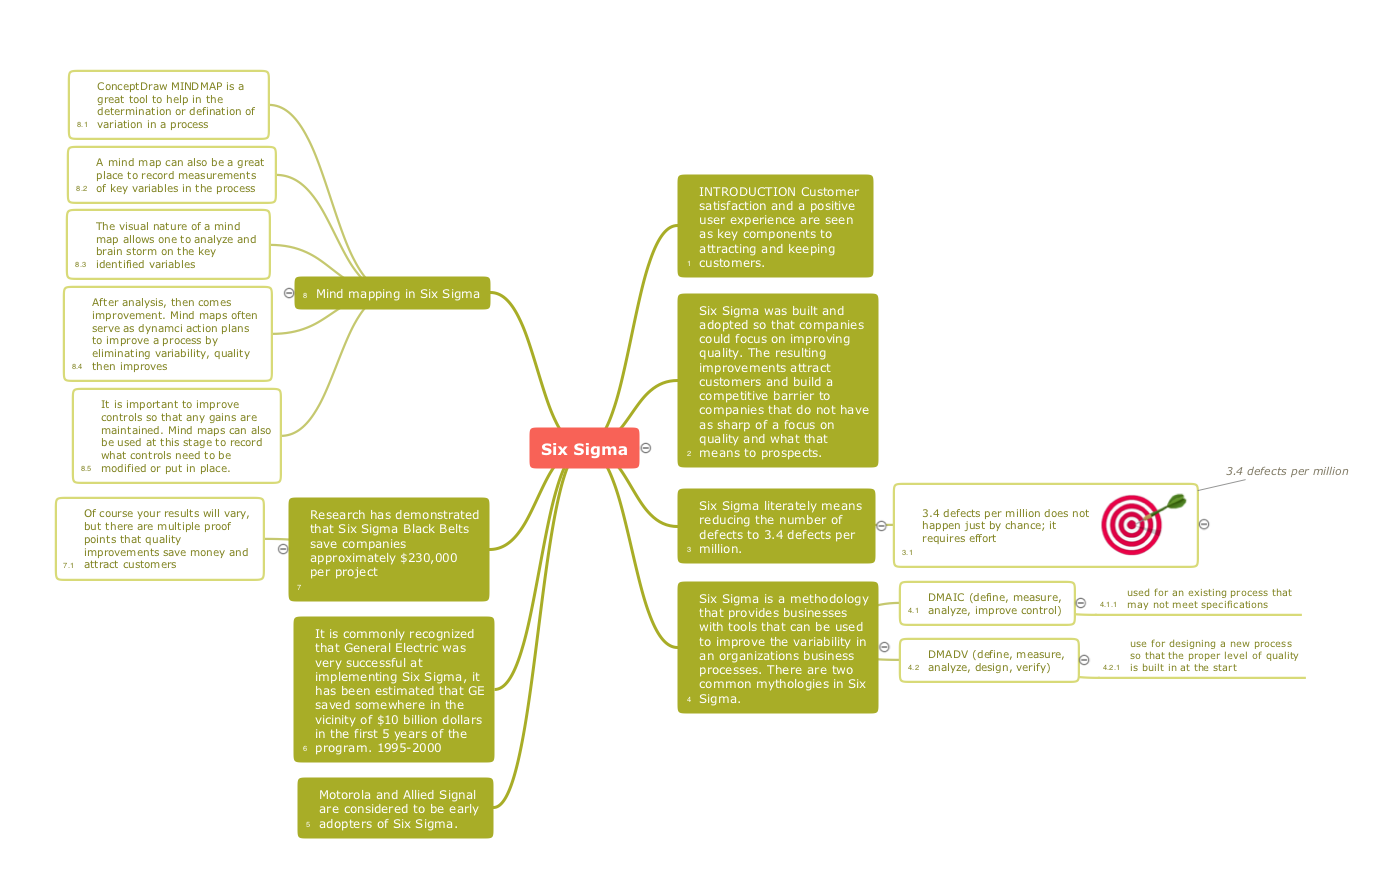
Pic.1 Six sigma - Quality mindmap.
This sample mind map is about Six sigma methodology of quality management, and about using mindmapping in Six sigma.
See also Samples:
TEN RELATED HOW TO's:
A network diagram represents the set of computers and network devices and the connections among them. This scheme can be developed for any institution or establishment. To illustrate this concept let’s take for example, a hotel network topology diagram or a school network diagram. These diagrams depict access points, servers, workstations, firewalls and another equipment needed to provide a network.
On this masterpiece drawing one will see a simple scheme a of connecting computers together. Such form of connecting can be applied for a hotel, guest house, bungalow, hut or something else. This diagram shows the images of the real LAN components. So, it represents a physical category of a network construction. It looks similar to a star - so this network configuration is named a star topology. The typical feature of this construction is a center point - usually it is hub, or router. The rays of this star means network connections. Computers, peripherals and other network details are placed on the ends of the star rays.
Picture: Hotel Network Topology Diagram
Related Solution:
Communication is the main challenge and the key success factor for remote project management. Communicating visually via Skype you bring all team and customers onto the one page.
Remote Presentation for Skype solution for ConceptDraw MINDMAP helps communicate with remote team and customers in visual manner on wide range of issues. Using this solution for regular status meetings allows you to push your team on tasks and keep task statuses up to date.
Picture: Communication Tool for Remote Project Management
Related Solution:
When you need to focus on the problem, professional diagramming tool helps you create a Fishbone diagram also known as Ishikawa diagram. Understanding of the problem via Fishbone diagram will improve the processes between departments and teams.
ConceptDraw DIAGRAM extended with Fishbone Diagrams solution gives a powerful tool for improving problem solving and focus with Fishbone diagrams.
Picture: Improving Problem Solving and Focus with Fishbone Diagrams
Related Solution:
Cause and Effect Analysis - The Seven Management and Planning Tools is a tool for Cause and Effect Analysis that allows users to analyze the root causes for factors that influenced the problem. This diagram is constructed separately for each highly prioritized factor. The Diagram is then used for further formulation of potential actions.
Picture: Cause and Effect Analysis
A concept map is a way of representing relationships between ideas, images, or words.
How to draw a Concept Map quick, easy and effective? ConceptDraw DIAGRAM offers the unique Concept Maps Solution from the Diagrams Area that will help you!
Picture: Concept Map
Related Solution:
When you prepare professional-looking presentation, you need to use ConceptDraw MINDMAP software for the amazing result.
Picture: Create Captivating Presentations Easily
Related Solution:
You can describe your own quality processes, brainstorm, and structure quality issues; then you can easily and quickly present it to your team.
Quality Management Mind Maps - Presentations, Meeting Agendas, Problem will be solved.
Picture: Why do you need the quality management for the organization
Related Solution:
The Affinity Diagram shows the structure of large, complex factors that have an influence on a problem, and then divides them up into a smaller and simpler structure. The Affinity Diagram does not show a causal relationship between the factors. This diagram is designed to prepare the data for further analysis of the cause-effect relationships.
Picture: Affinity Diagram
Related Solution:
6 sigma →
This mind map shows how Six Sigma methodology be represented as a mind map. Six Sigma is a quality management methodology allows reducing the number of defects to 3.4 defects per million.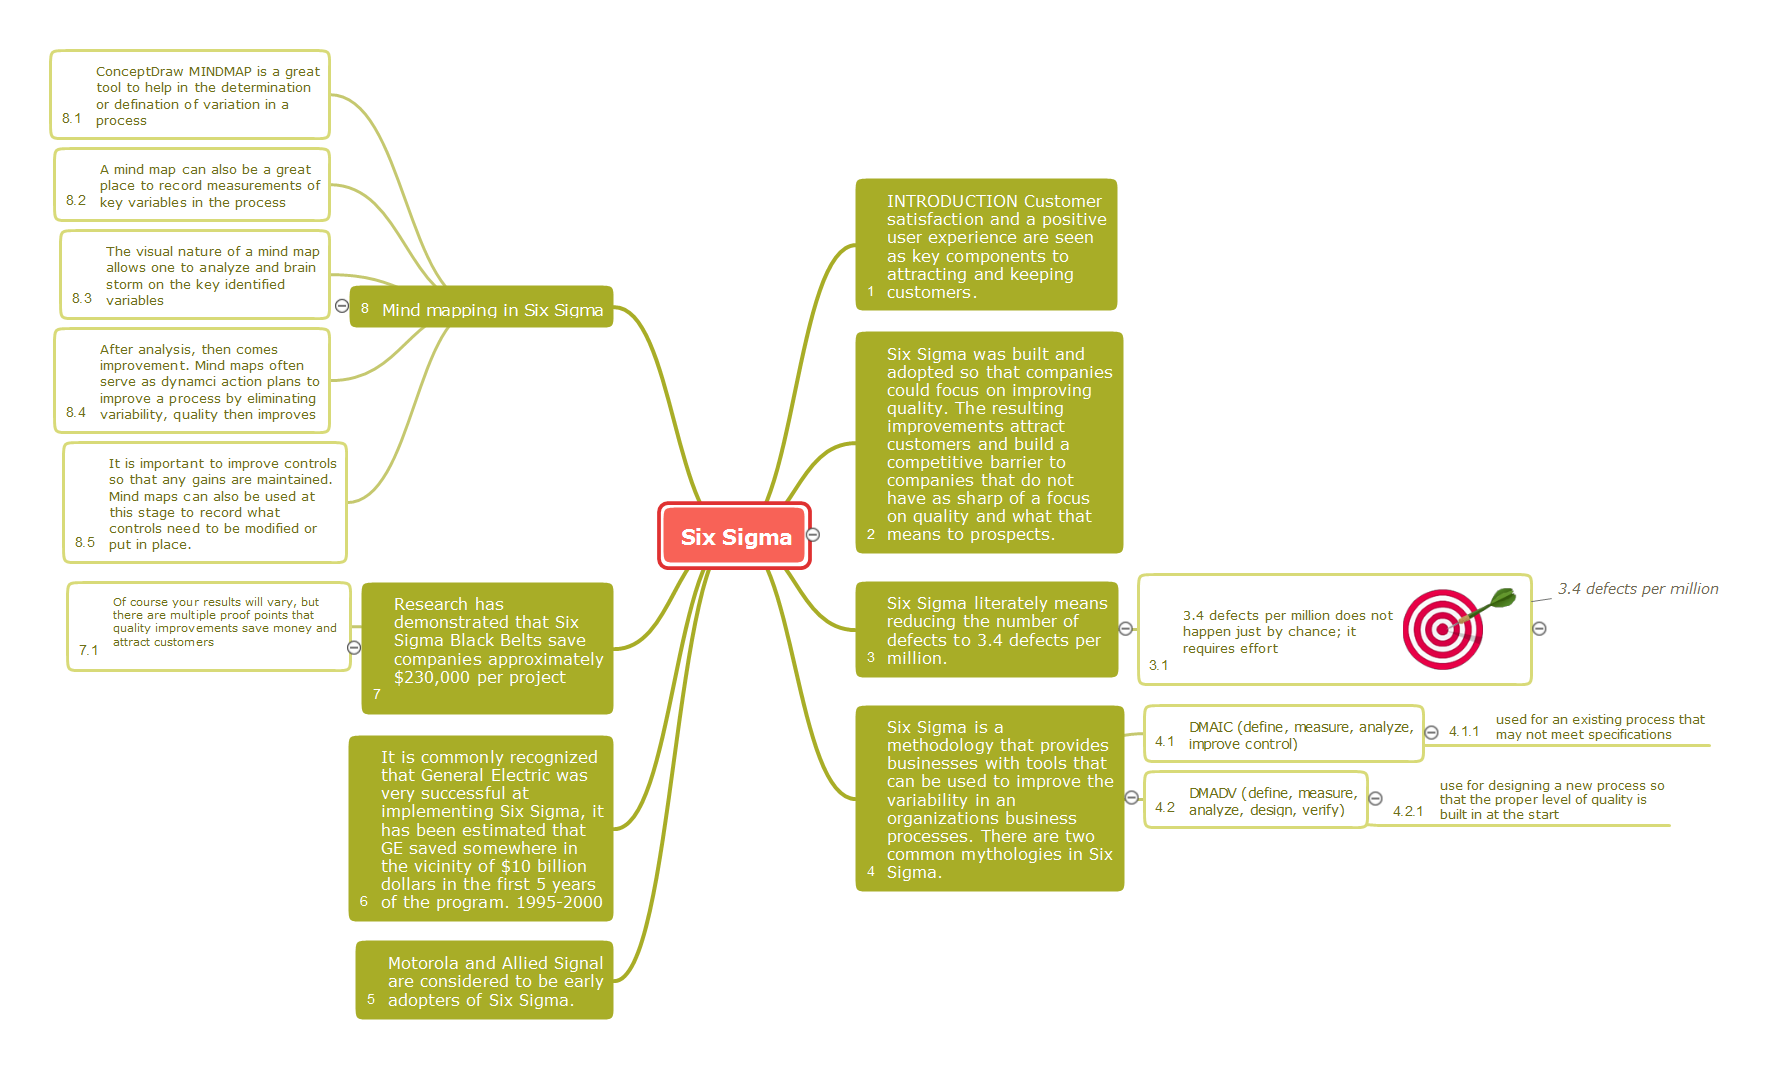
Picture: 6 sigma
Related Solution:
The Quality Mind Map Solution extends ConceptDraw MINDMAP with the addition of a number of Quality Management Mind Maps (Presentations, Meeting Agendas, and problem-solving techniques).
Picture: Quality Mind Map Solution
Related Solution:
ConceptDraw
MINDMAP 16