Export from ConceptDraw MINDMAP
into MS Word Document
|
We use mind maps in our daily life to gather information and structure our thoughts and ideas. Often we need to share them with other people, and sometimes the best way is through using a text document. ConceptDraw Word Exchange solution gives you the ability to export mind maps to MS Word. It also allows stylizing the resulting document by using a custom MS Word template. 
Pic. 1. ConceptDraw MINDMAP document example - Shakespeare essay. |
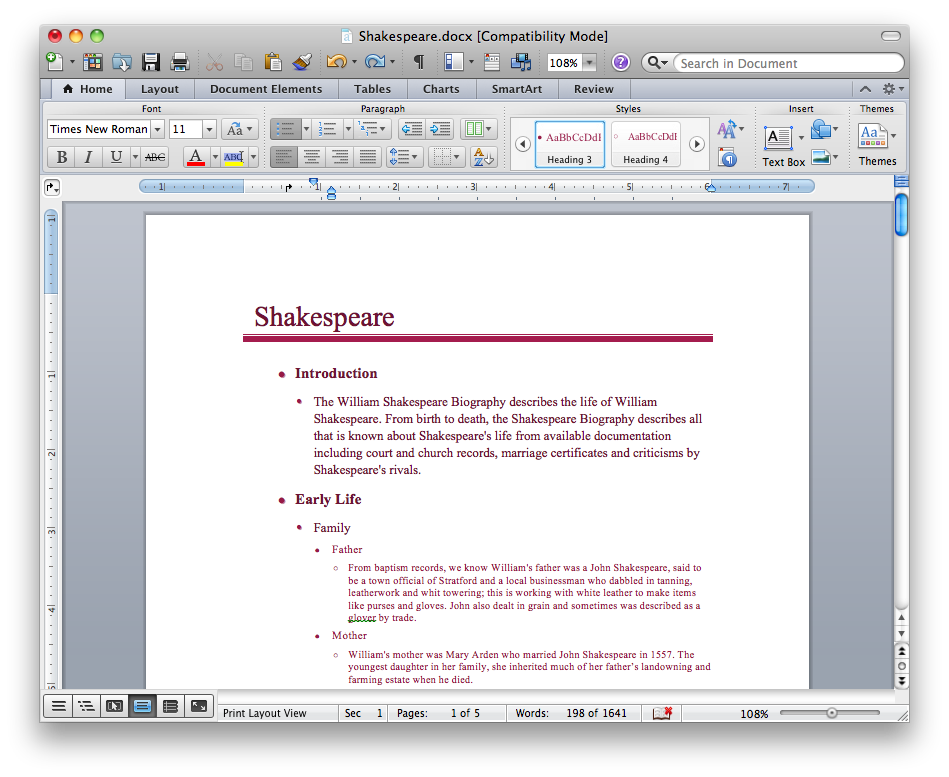
Pic. 2. MS Word document created from ConceptDraw MINDMAP document.
Now you’ll have no difficulty turning a ConceptDraw MINDMAP document into a ready-to-use Microsoft Word document.
See also Samples of mind maps:
- Mind Maps
- Mind Maps — Marketing
- Mind Maps — Idea Communication
- Mind Maps — Mind Map Exchange
-
Mind Maps — Presentation Exchange
TEN RELATED HOW TO's:Flowcharts can be used in designing and documenting both simple and complex processes or programs and, similar to the other types of diagrams, they can help visualize what happens and so help understand some definite process, and, as a result, find flaws, bottlenecks and other features within it.
 Picture: Flowchart Programming Project. Flowchart ExamplesRelated Solution:Explore practical flowchart examples including business process diagrams, workflow charts, swimlane flowcharts, and IT troubleshooting flows. Review common patterns and start from ready templates.
 Picture: Flowchart ExamplesRelated Solution:To create flowcharts in MS Word, programs designed specifically for the purpose of creating flowcharts are particularly well-suited to the task.
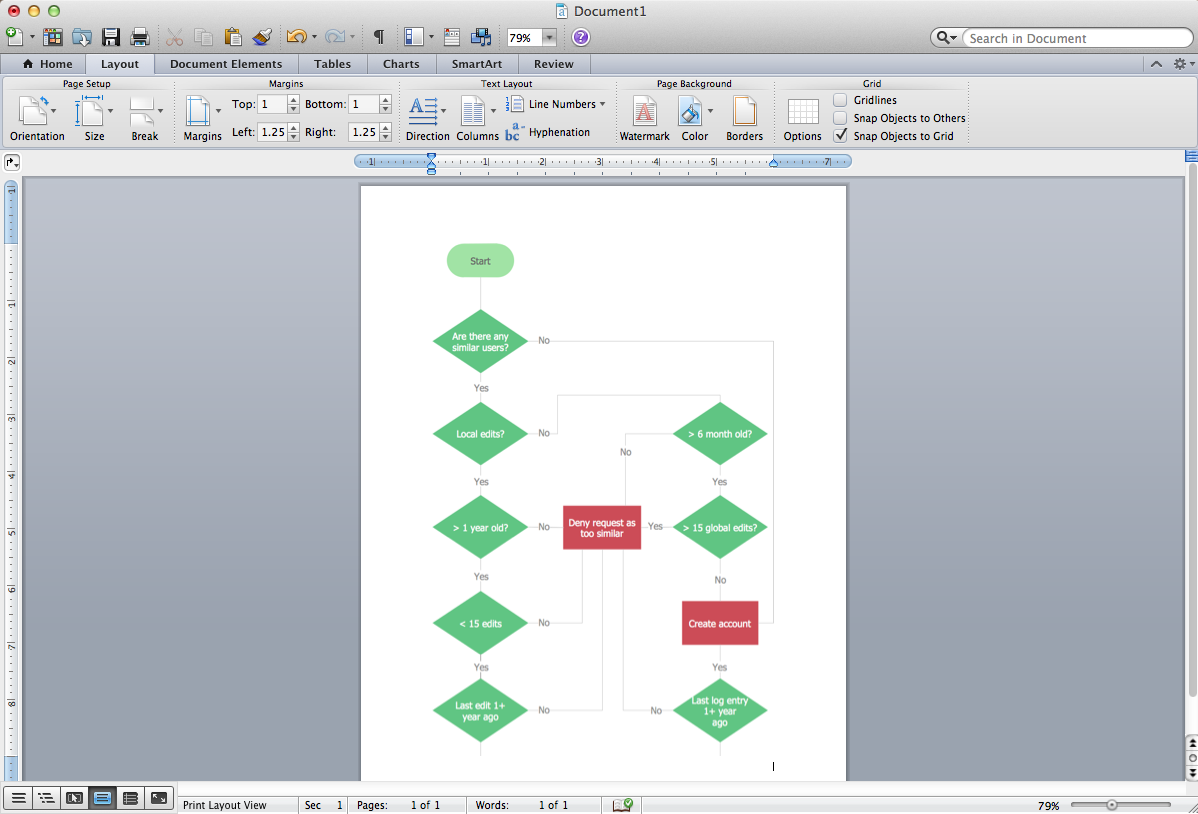 Picture: Flowcharts in WordRelated Solution:While creating flowcharts and process flow diagrams, you should use special objects to define different statements, so anyone aware of flowcharts can get your scheme right. There is a short and an extended list of basic flowchart symbols and their meaning. Basic flowchart symbols include terminator objects, rectangles for describing steps of a process, diamonds representing appearing conditions and questions and parallelograms to show incoming data. This diagram gives a general review of the standard symbols that are used when creating flowcharts and process flow diagrams. The practice of using a set of standard flowchart symbols was admitted in order to make flowcharts and other process flow diagrams created by any person properly understandable by other people. The flowchart symbols depict different kinds of actions and phases in a process. The sequence of the actions, and the relationships between them are shown by special lines and arrows. There are a large number of flowchart symbols. Which of them can be used in the particular diagram depends on its type. For instance, some symbols used in data flow diagrams usually are not used in the process flowcharts. Business process system use exactly these flowchart symbols.
 Picture: Flowchart Symbols: Meaning and ExamplesRelated Solution:ConceptDraw MINDMAP the will guide you in creating and demonstrating powerful mind map presentations.
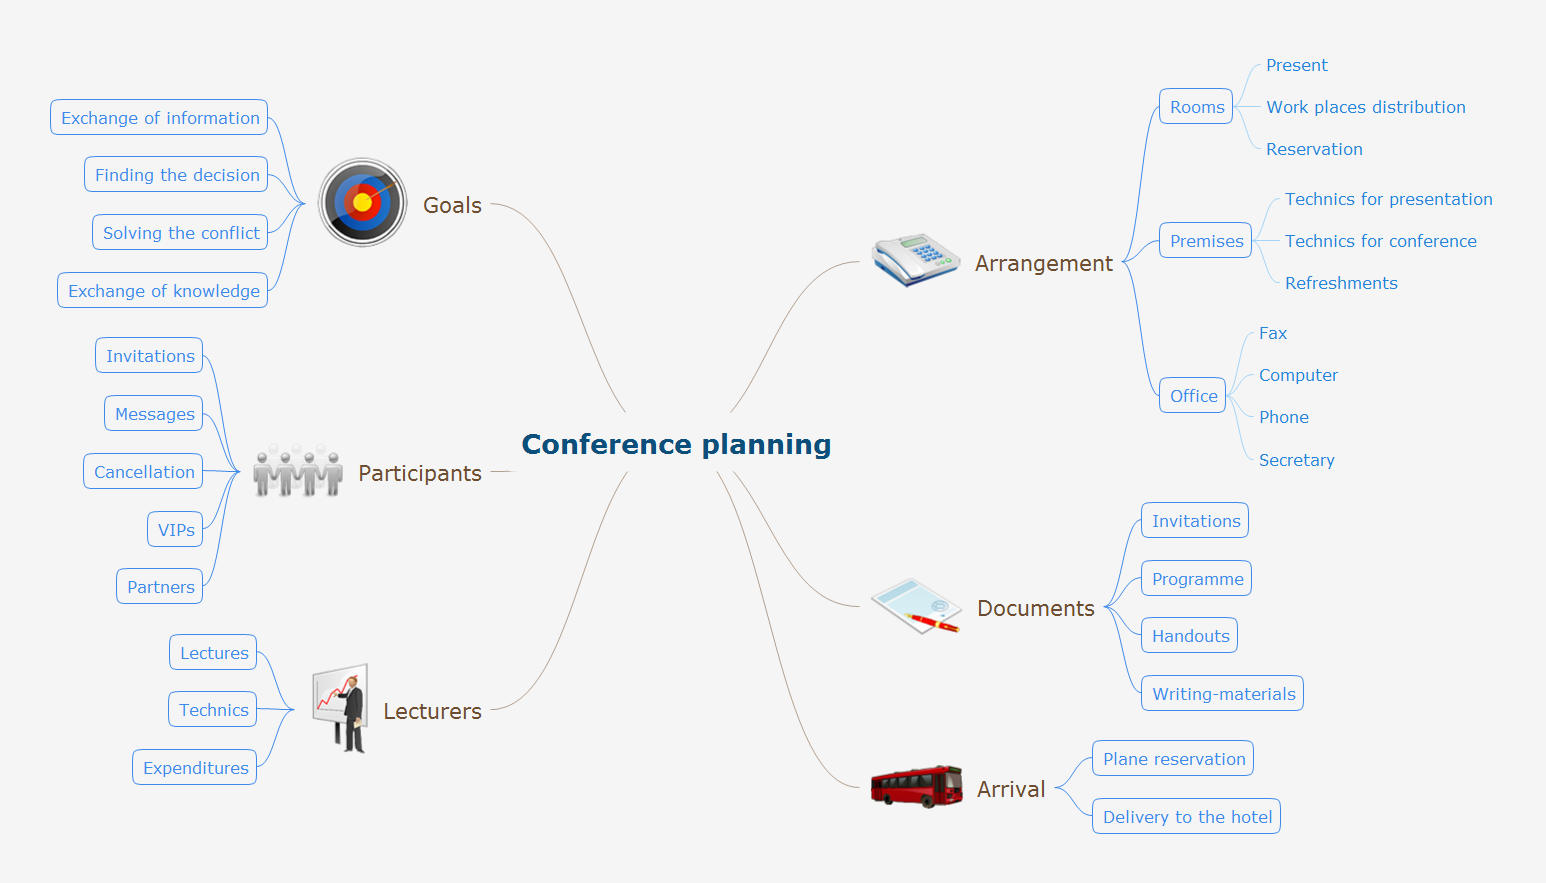 Picture: Program for Making PresentationsRelated Solution:ConceptDraw MINDMAP can export to MS Project file from a mind map; it can also import a project file from MS Project giving team members who use Macintosh or Windows, a working visual map of a planned project. The ability to import/export MS Project files is made possible because of the Project Exchange solution.
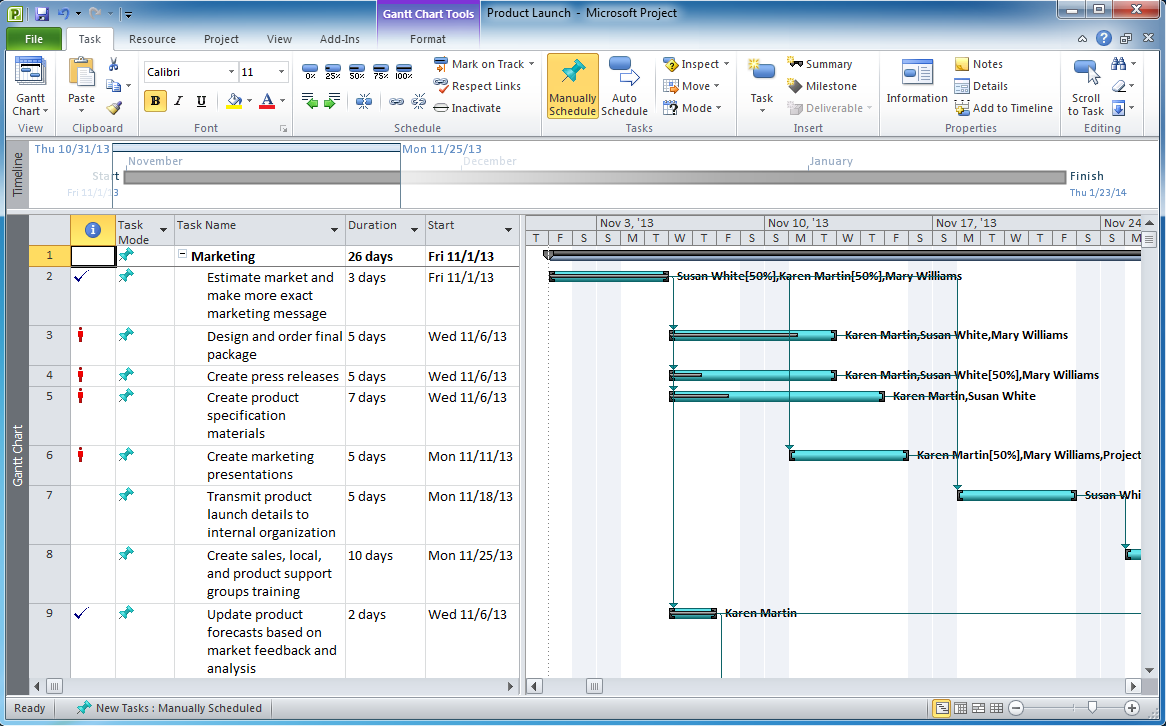 Picture: Export from ConceptDraw MINDMAP to MS Project® XMLRelated Solution:The power, economy, and versatility of ConceptDraw MINDMAP takes personnel and team productivity to another level. Discover today what this means to you.
 Picture: Mind Map Making SoftwareRelated Solution:ConceptDraw MindMap benefits comparing to Mindjet Mindmanager: Economical. (Lower license price, support is no charge maintenance is an optional one-time fee that delivers to you the next major release) ConceptDraw products are structured to save you money from the date of purchase for the life of the product. When you compare ConceptDraw MINDMAP to Mindjet Mindmanager the cost savings will be obvious. Flexible Licensing. ConceptDraw is licensed per-named-user. Want ConceptDraw on 2 PCs, 2 Macs, or a PC and a Mac? Straightforward licensing makes this easy.
 Picture: Looking at ConceptDraw MINDMAP as a Replacement for Mindjet MindmanagerRelated Solutions:An example of marketing analysis diagram, can be used to analyse product market and define marketing strategy. This sample shows the Feature Comparison Chart of the digital scouting cameras. It can be useful for digital cameras production field, marketing, sales, etc.
 Picture: Feature Comparison Chart SoftwareRelated Solution:The Pie Chart visualizes the data as the proportional parts of a whole and looks like a disk divided into sectors. The pie chart is type of graph, pie chart looks as circle devided into sectors. Pie Charts are widely used in the business, statistics, analytics, mass media. It’s very effective way of displaying relative sizes of parts, the proportion of the whole thing.
 Picture: Pie Chart Word Template. Pie Chart ExamplesRelated Solution:ConceptDrawMINDMAP 16