Flowchart Programming Project. Flowchart Examples
A flowchart which is a type of a diagram representing an algorithm, workflow, process, etc. works in a way of showing the steps using the shapes, such boxes of various kinds, and putting them in order by connecting them with arrows of different lengths and shapes too. Such diagrammatic representation named “flowchart” can help to illustrate a solution model to some given problem and so to solve it within a shorter period of time, rather than trying to explain something using only text, but no drawings at all. Flowcharts are very useful illustrations and they are commonly used in analyzing, designing, documenting and managing fields of business activity.
Flowcharts can be used in designing and documenting both simple and complex processes or programs and, similar to the other types of diagrams, they can help visualize what happens and so help understand some definite process, and, as a result, find flaws, bottlenecks and other features within it.
There are very many different types of flowcharts. Each of these types always has its own way of placing the boxes and notational conventions. The most common types of boxes which are commonly used in flowcharts drawings are: a rectangular box illustrating a processing step, usually called “activity”, and a diamond which illustrates a decision made.
Flowcharts can be called as "cross-functional" ones in case the page is divided into different swimlanes and they are commonly used for describing the control of the different organizational units within one organization. This type of flowchart allows to show the responsibility for making some particular decision correctly and it also helps to show the responsibility of each organizational unit for conducting some process within business activity.
Flowcharts can also be called as flow charts, process flowcharts, functional flowcharts, process maps, process charts, functional process charts, business process models, process models, process flow diagrams, work flow diagrams, business flow diagrams, etc. But the most commonly used terms are "flowcharts" and "flow charts".
The structure of a flowchart, which is represented in a way of graph, is called a “flow graph”. It abstracts the node types away as well as their contents and other information. There are many types of flowcharts, including “decision flowcharts”, “logic flowcharts”, “systems flowcharts”, “product flowcharts”, “process flowcharts”, etc., and all of them can be used in business and government activity.
The most common design symbols, used for drawing the flowcharts, are Flow lines, Terminal, Process, Decision, Input/Output, Annotation, Predefined Process, Preparation, On-page connector, Off-page connector, etc.
Flow line is usually an arrow which comes from 1 symbol and ends at another one. It represents the fact that control passes from one to another symbol this arrow points to. The line for the arrow can be either dashed or solid. The meaning of using the arrow with dashed line can be different and it may differ from one flowchart to another as well as it can be defined in the legend.
Terminal is usually represented in a way of circles, ovals, rounded rectangles, etc. These shapes usually contain one of the words - "Start" or "End" – but they can also include some other phrase in order to show the start and end of some process.
Process is usually represented in a shape of a rectangle. This rectangular shape is used for the purpose of showing that something is performed.
Decision is represented in a way of a diamond shape and this shape shows whether a decision is necessary to make using Yes/No answers to the questions asked. This diamond symbol has two arrows which come out of it and usually they come out from the bottom point as well as from the right point. One of them represents “Yes” or “True” answer and another – “No” or “False”. It is always better to label the arrows in order to see the opportunities and options. Making such flowchart you can use more than two arrows, but really, it is more common to use only two.
Input/Output can be represented in a way of a parallelogram. Input/Output involves receiving data as well as displaying the already processed data. It can only go from input towards output, but never vice versa.
Annotations are used for the purpose of representing some particular comments or remarks about the flowchart itself. These annotations have no effect on the interpretation or behavior of any of the flowcharts created. Sometimes these annotations are illustrated in a way of a shape which is a box with dashed lines.
Predefined process can be represented in a way of rectangles with double-struck vertical edges. Such rectangles are used for the purpose of showing some complex processing steps. These steps can be also illustrated with help of separate simple flowcharts or in one complex flowchart.
Preparation can be shown in a way of a hexagon. This process (preparation) can also be called “initialization” and it represents operations which have no effect, but preparing a value for a decision step. This very shape can be also used for replacing the Decision Shape in certain cases.
On-page connector can be represented with help of a circle which shows where the multiple control flows converge in a single exit flow. This circle usually has more than one arrow coming into it, but only one arrow going out of it. It can happen when some circle has an arrow point to another arrow instead.
Off-page connector can be represented in a shape of a pentagon. This off-page connector can be shown the same way as the on-page connector, but it also can allow to place some connector connecting to another page.
All of the shapes mentioned above were already created by the IT specialist and they all can be found in one of the libraries of Cross-Functional Flowcharts solution, which can be downloaded from the Business Processes area of ConceptDraw Solution Park or from ConceptDraw STORE application which is another product of ConceptDraw DIAGRAM and which can be used as the source of different solutions, each of which is full of all of the needed design symbols as well as samples and templates.

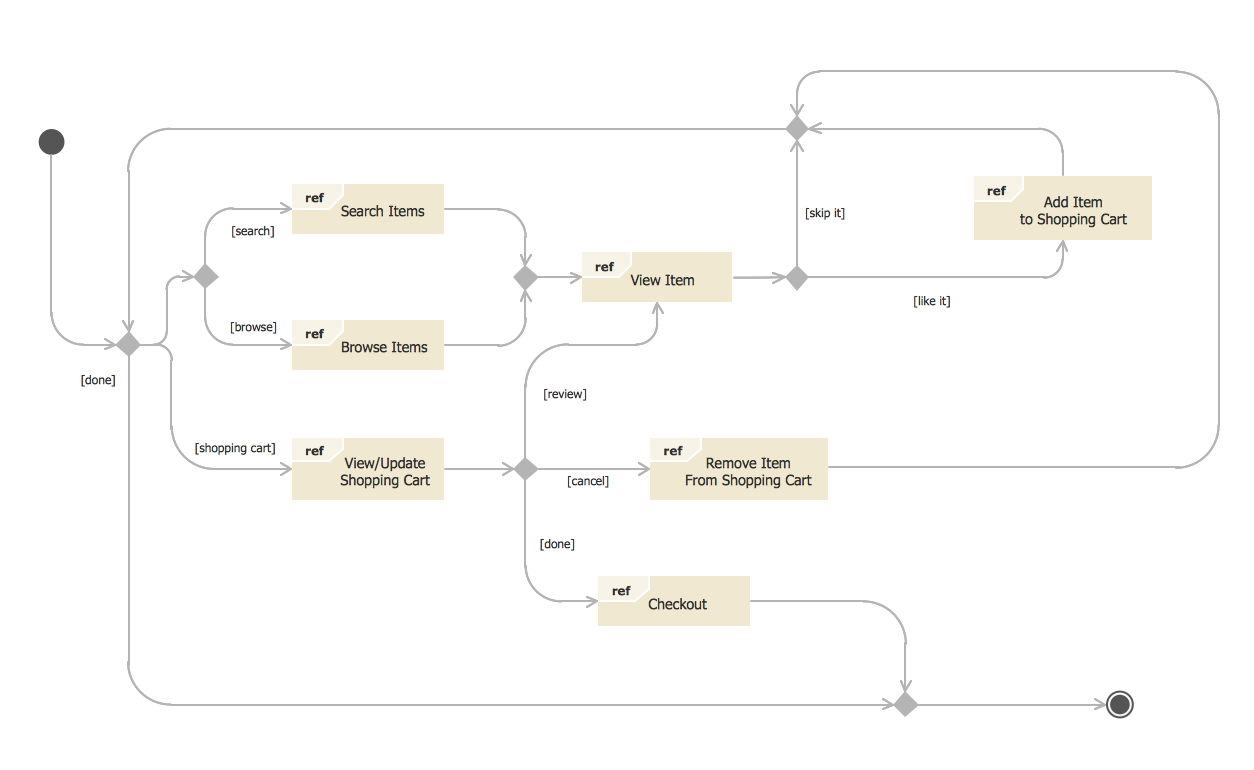
Example 1. Flowchart Programming Project
This software application flowchart example shows the logical process of execution.
Create you own flow charts of process-driven software applications using the ConceptDraw DIAGRAM vector drawing software extended with the Cross-Functional Flowcharts solution from the Business Processes area of ConceptDraw Solution Park.

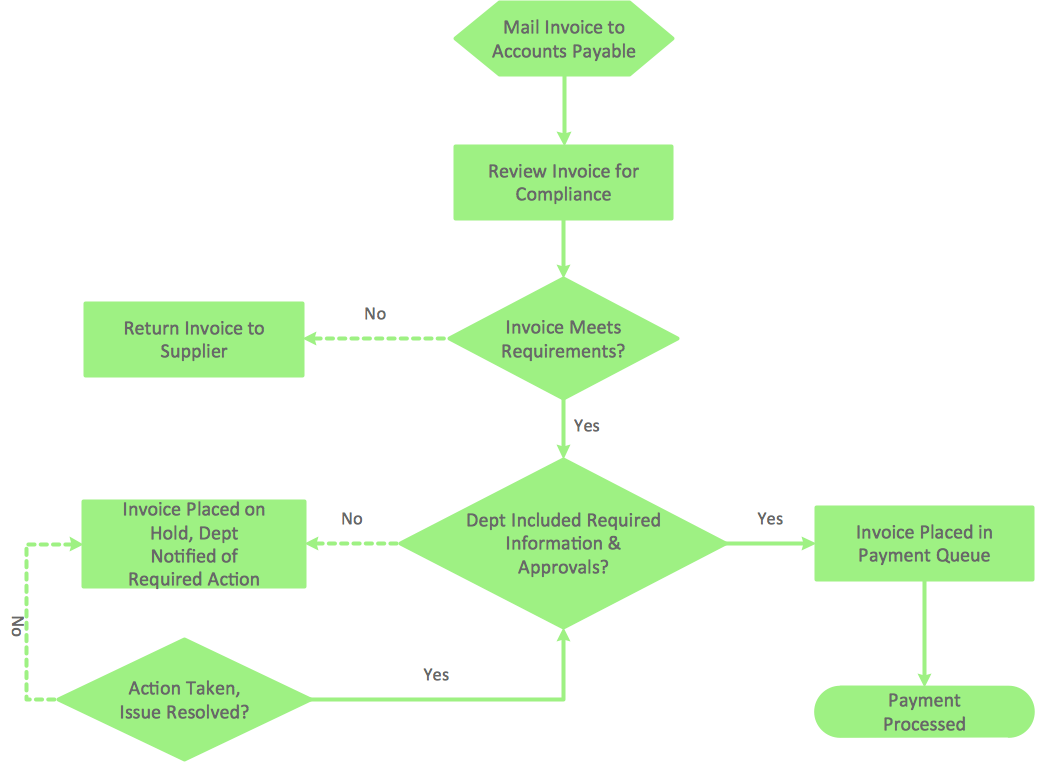
Example 2. Flowchart programming project solution. Flowchart examples
See also Samples:
-
Flowcharts
- Orgcharts
- Business Charts — Area, Line and Scatter
- Marketing — Charts & Diagrams
- Quality and Manufacturing Charts
- Business Process Diagrams — Flow Charts
- Flowcharts & Process Diagrams
- Business Diagrams — Concept Maps
- Business processes — Flow charts
- Marketing — Flowcharts and Process Diagrams
- Finance and Accounting
- Marketing — Social Media
- Business Diagrams
- Orgcharts


This template shows the Context Diagram. It was created in ConceptDraw DIAGRAM diagramming and vector drawing software using the Block Diagrams Solution from the “Diagrams” area of ConceptDraw Solution Park. The context diagram graphically identifies the system. external factors, and relations between them. It’s a high level view of the system. The context diagrams are widely used in software engineering and systems engineering for designing the systems that process the information.

