
Sample 1. Payment flow chart.
Accounting Flowcharts solution from ConceptDraw Solution Park provides templates, samples and library of vector shapes for drawing the Accounting Process Flowcharts.
Use ConceptDraw DIAGRAM with Accounting Flowcharts solution to document and communicate visually how accounting processes work, and how each operation is done.
NINE RELATED HOW TO's:
ConceptDraw DIAGRAM is a professional software for creating great looking flowcharts. The samples included in this set of software allows users to draw any type of flowchart.
Picture: Flowchart Process Example
Related Solution:
ConceptDraw is your tool for driving social integration and managing change across and streamline social media processes of your organisation.This tool keeps the entire team on the same page allowing you to realize your social media strategy, improve the quality of your answers, and minimize the time it takes to respond.
Picture: Social Media Response Management DFD Charts - software tools
Related Solution:
ConceptDraw DIAGRAM is a professional software for building of great-looking Flowcharts ✔️ of various types and any degree of complexity, ✔️ in a few simple steps, ✔️ even if you have no experience, ✔️ using RapidDraw technology, ✔️ to perform different tasks in different fields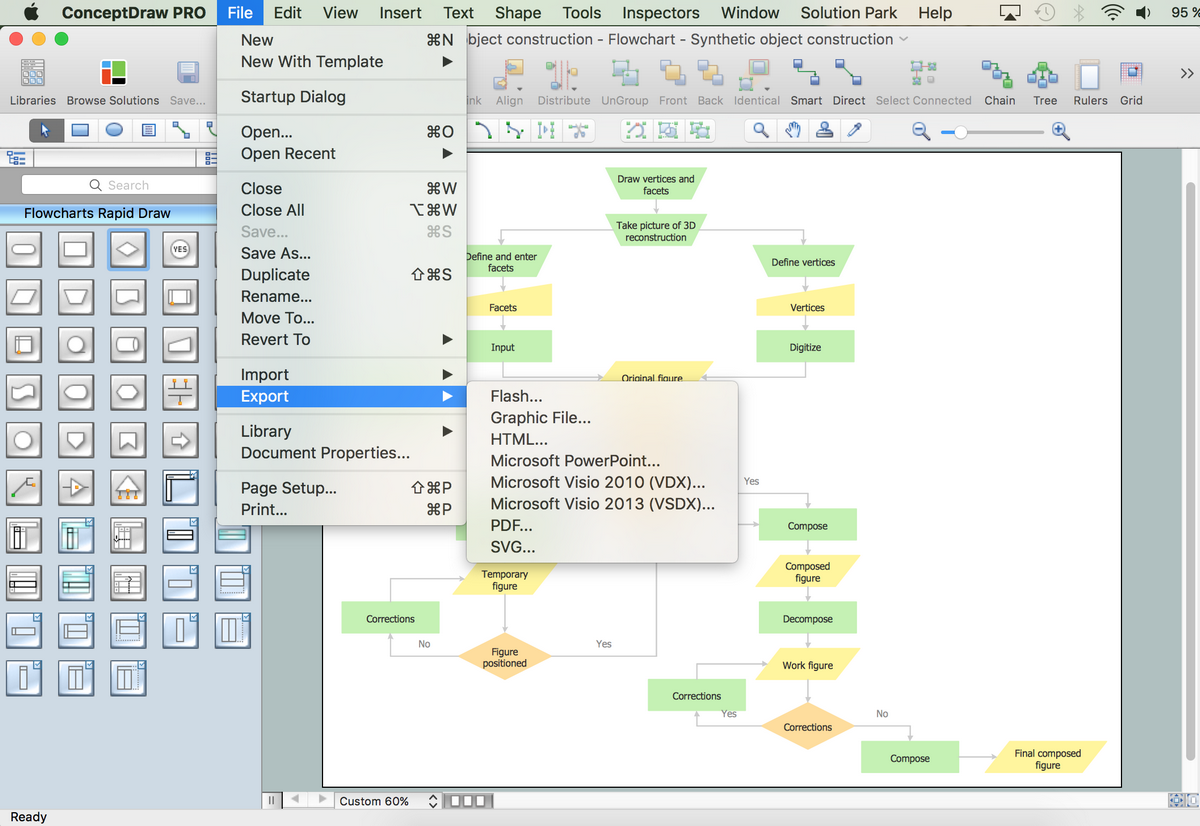
Picture: How to Build a Flowchart
Related Solution:
ConceptDraw DIAGRAM is a powerful diagramming and vector drawing GUI software. Extended with Mac OS User Interface solution from the Software Development area, ConceptDraw DIAGRAM is the best software for designing professional looking user interfaces for new OS X 10.10 Yosemite operating system developed for Macintosh computers. Mac OS User Interface solution offers you large quantity of Mac OS templates, samples and user interface design examples.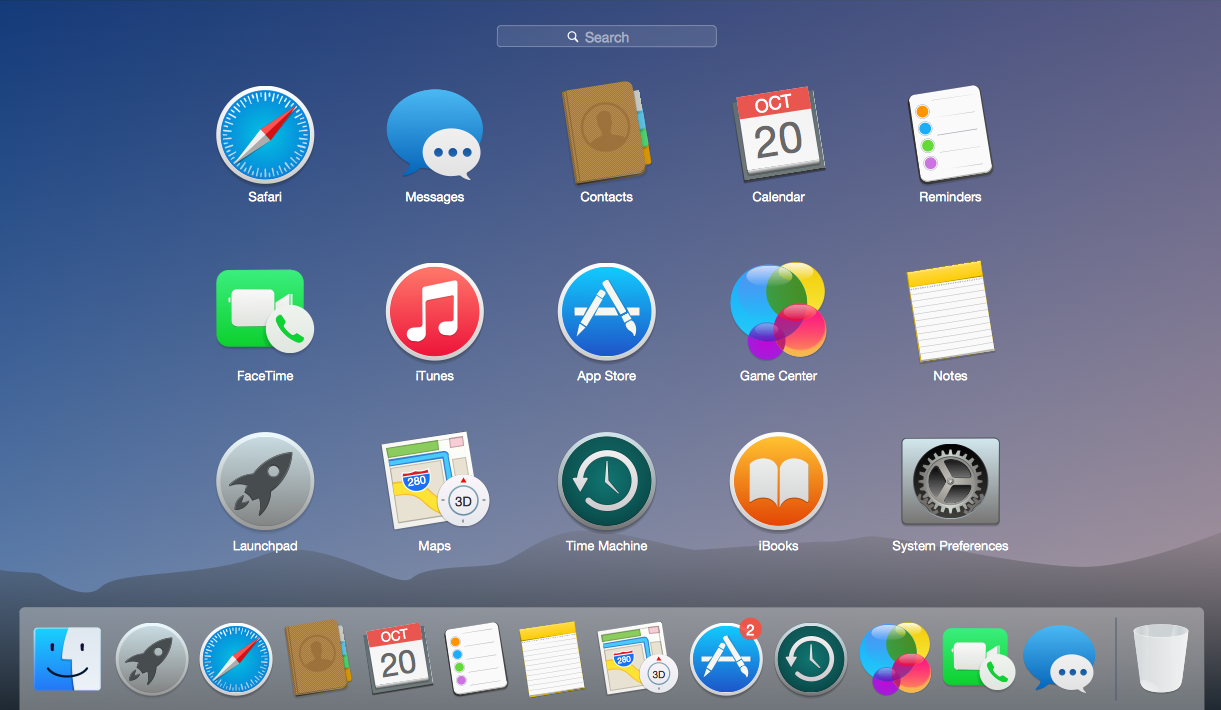
Picture: Mac OS User Interface Design Examples
Related Solution:
Quality Control Chart Software (ISO Flowcharting) - ConceptDraw DIAGRAM extended with Total Quality Management TQM Diagrams Solution from the Quality Management Area is the best diagramming and vector drawing software that allows you to draw the quality control charts quick and easy.
The quality control chart is a graphic that illustrates the accordance of processes or products to the intended specifications and degree of differences from them. Depending on what type of data you need analyze, there are used different types of quality control charts: X-bar charts, S charts, Np charts.
Picture: Quality Control Chart Software — ISO Flowcharting
Related Solution:
A competent delegation of responsibilities between workers guarantees business success in most cases. At first sight, it might seem that workflow diagram symbols are quite similar to a regular flowchart. But workflow diagram is a more accurate way to present working processes.
Workflow diagrams are helpful for a working process analyzation, to depict a pathway of process issues, personalize responsibilities and identify resources that will help to optimize a workflow. Generally, Workflow diagram deploys flowchart symbols for displaying work process steps and relationships. But, often it require some additions and improvements to become more professional and illustrative. The Workflow solution for ConceptDraw DIAGRAM provides the user with a big library of symbols that are designed especially for workflow diagrams.
Picture: Workflow Diagram Symbols
Related Solution:
Event-Driven Process chain Diagrams for improvement throughout an organisation. Best software for Process Flow Diagram. The Event-driven Process Chain (EPC) Diagrams allows managers to plan processes and resources.
Picture: Business process Flow Chart — Event-Driven Process chain (EPC) diagrams
Related Solution:
How to make a Concept Map fast and easy? ConceptDraw DIAGRAM diagramming and vector drawing software extended with Concept Maps Solution from the Diagrams Area is the best choice for those who want design professional looking Concept Map in minutes.
Picture: How To Make a Concept Map
Related Solution:
A flowchart is a picture of the separate steps of a process in sequential order.
ConceptDraw DIAGRAM is a Process Flowcharts software. This software includes basic package of process flow examples. The software contains object libraries with vector stencils that allows you use RapidDraw technology. By clicking on direction arrows you can add a new object to the flowchart.
Picture: Example Process Flow
Related Solution: