Data Flow Diagram Process
Data Flow Diagram (DFD) in the structured-systems analysisA graphical representation of the flow of data through an information system by modeling its process aspects is called a “data flow diagram”, also known as DFD. A DFD is often used as a step for creating an overview of the system without going into detail. DFDs can also be used for the purpose of the visualization of data processing being used in the structured design. Each DFD shows the way each kind of information will be input to and output from some particular system as well as in what way the data will advance through this system. It is also important to mention the place where the data will be stored. It does not show information about the timing of process or information about whether processes will operate in sequence or in parallel. “Flow Chart” can be also used for such purpose of illustrating a flow of some particular data and they can be used instead of the “data flow diagrams”. “Flow diagrams” in general can be “Entity Relationship Diagrams” (or “ERD”), “Unified Modeling Language” (or “UML”) diagrams, “Data Flows Diagrams” (or “DFD”), “Windows and Macintosh Graphics User Interface (GUI)” design diagrams as well as “Structured Systems Analysis and Design Method” (“SSADM”). One of the most popular among them is a “data flow diagram”. “DFD”, as it was already mentioned before, is simply a graphical representation of the "data flow" in an information system. With its help you can illustrate a system overview in outline using ConceptDraw DIAGRAM The “data flow diagram” can also be used for the illustration and so the visualization of the data processing in a structured design. All ConceptDraw DIAGRAM users can make any needed data flow diagram any time they want within only a short period of time. “Data flow diagrams” are very widely used nowadays and there is a reason for such usage: these diagrams show what particular kind of information can be input to as well as output from some particular system. These diagrams also show the way this data, which is about to be illustrated, can advance via this system. With the help of DFD you can also show where data can be stored. Another name for “data flow diagrams” is “bubble charts”. There are “context-level data flow diagrams” which include a “Level 1 DFD” and they can be created in order to show some of the system’s details being modeled. The “Level 1 data flow diagrams” show the way some system is or can be divided into the smaller “sub-systems”, allowing to follow the way, in what each of these “sub-systems” deals with the “data flows”. With the aid of the “data flow diagrams” you can always identify the internal data stores, which as a general rule have to be presented in a way of such diagram. These diagrams are the ones of the three perspectives of the “SSADM”. While creating such diagrams the sponsor of the project and the end user can be consulted at each of the stages of a system's evolution and it is always convenient to track this “evolution” with the help of such DFD, that is why using this type of diagram as a simple way of representing the operating system, as well as what it accomplishes with is a good way. You can also mention how the plans for this system can be implemented. DF diagrams can be used for a purpose of providing the end user with the information about the inputting data, as well as the information in what the system can be developed both in analysis and design phases. There are different notations that can be used for drawing any of the needed data flow diagrams, mainly the “Gane and Sarson” and the “Yourdon and Coad” ones. You can use these notations for defining the different visual representations of the data flows, data stores, external entities as well as the other different processes. “Logical Data Flow Diagram” can be also made in ConceptDraw DIAGRAM and it is useful for capturing the data flows, necessary for the system to operate, as well as describing the needed processes and the data required. “Physical Data Flow Diagram” is another type of “Data flow diagrams” which you can use to show the way in what some system is implemented at this very moment. “Physical Data Flow Diagram” is also known as a “Current Physical Data flow diagram”. In general “Data flow diagrams” are well known and very commonly used for a reason of the need of representing some data flow in a system as a part of the “Structured Systems Analysis and Design Methodology” and these diagrams may consist of different components. These components are functions and processes, with the aid of which you can represent the actions happened in an information system. All of the main DFD elements are external entities, processes, data flow and data store. “Yourdon – de Marco” notation can be used for the purpose of illustrating the ”Data Flow Diagram” objects, which are interpreted in a way of processes transform the input data flows into the output data flows as well as data depositories serve them only for keeping the “ingoing” data and not to change them. If you want to make any of the DFDs mentioned above, then everything you need is to download ConceptDraw DIAGRAM software and start using it. Having this application means having a great looking result after having very relaxing and entertaining process of creating any needed type diagrams, including all mentioned above. You can always use this software as well as the needed solution from ConceptDraw STORE application and you can be sure that your final result will look simply great as well as smart and professional drawings. The “Data Flow Diagrams Solution” can simplify your work of drawing the needed DFD and it definitely will be very helpful for those ConceptDraw DIAGRAM users, who intend to make a great looking and smart diagrams, including the “data flow” ones. The “Object Library” can be found in the “Data Flow Diagram Solution” from ConcepDraw STORE and it contains lots of design symbols, including all of the needed elements, such as icons, that can be used for your representing of the data flows, data storage, processes, objects as well as other data flow entities.
Example 1. Data Flow Diagram (DFD) Solution The Data Flow Diagrams solution contains three vector stencils libraries with DFD symbols:
Use the Data Flow Diagrams solution to draw your own DFDs using the ConceptDraw DIAGRAM diagramming and vector drawing software. |
 Solution")

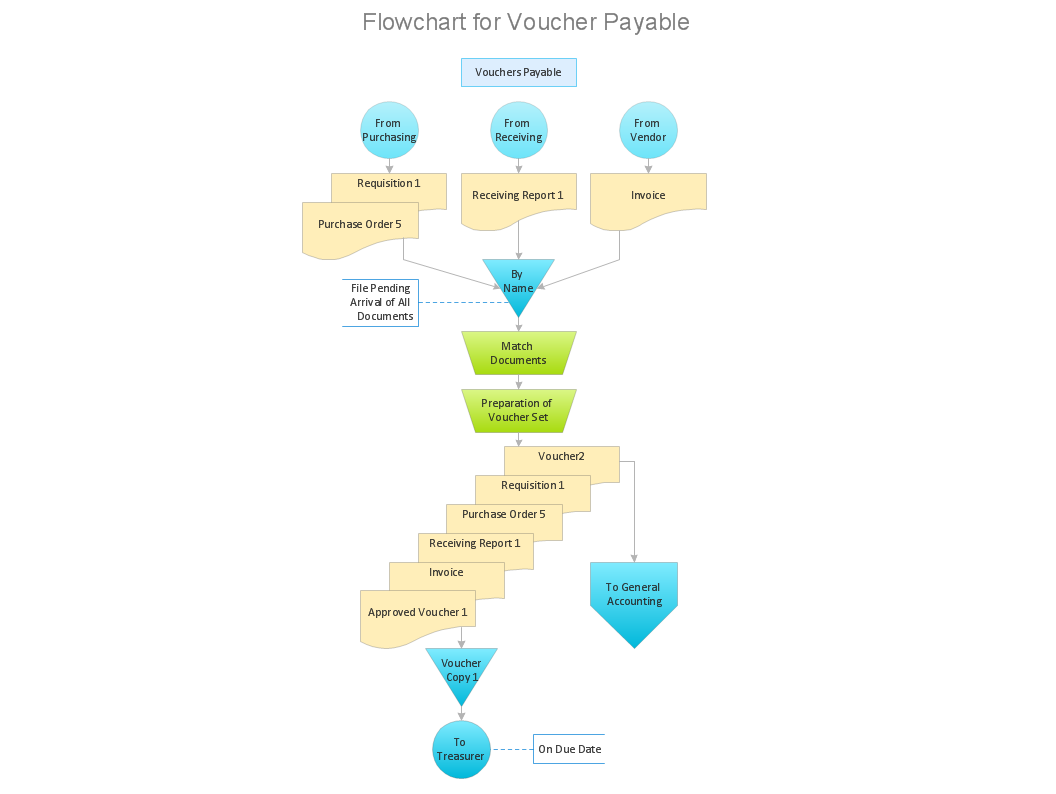
Example 2. DFD Process of account receivable
This example is created using ConceptDraw DIAGRAM enhanced with solution Data Flow Diagrams. It shows the process of account receivable.
Data Flow Diagrams Sample: