Gane Sarson Diagram
What is the Gane and Sarson Model?
"The Gane & Sarson method is based on the building of a logical model of the system, using graphical techniques to enable users, analysts, and designers to get a clear and common picture of the system and how its parts fit together to meet the user's needs.
The methodology involves building a system top-down by successive refinement. First, an overall system data flow is created. Then, detailed data flows are created. Next, the details of the data structures and the process logic is determined. Finally, design of modular structures is begun.
The focus of analysis in the Gane and Sarson method is the Data Flow diagram, which is used to describe the processes of the system, and how the processes transform data."
[Gane & Sarson Methodology. ibm.com]
The vector stencils library Gane-Sarson Notation from the solution Data Flow Diagrams contains specific symbols of the Gane-Sarson notation such as process symbol, connector symbol, jump symbol for ConceptDraw DIAGRAM software. The Data Flow Diagrams solution is contained in the Software Development area of ConceptDraw Solution Park.
Use the Data Flow solution to draw data flow diagrams for your business documents, presentations and websites.

Example 1. Gane Sarson Diagram
The example above illustrates the Gane-Sarson notation usage for drawing a data flow diagram for on-line appointment scheduling. "The patient enters a web inquiry which generates two checks against different databases, and the information is returned to the patient for acceptance."
ConceptDraw DIAGRAM is a Perfect Tool for:
- Designing and planning tasks such as:
- Developing Visualization Solutions
- Project Planning (Gantt Charts, Timelines, Project Schedules)
TEN RELATED HOW TO's:
Holiday recipes are always recipes of amazingly delicious and beautiful dishes that delight by decoration and miraculous combination of ingredients, and remain long in the memory. Design of illustrations for recipes of holiday dishes for cookbooks, magazines and websites is a special art, because one of the main criteria for selection the recipe and its next cooking is colorful and appetizing illustration.
ConceptDraw DIAGRAM diagramming and vector drawing software extended with powerful tools of Cooking Recipes solution from the Food and Beverage area of ConceptDraw Solution Park will help easy create colorful, bright, attractive and appetizing illustrations on preparation and decoration holiday dishes.
Picture: Holiday Recipes
Related Solution:
AWS platform is great to develop reliable applications. If you are already aware of all the benefits that Amazon Web Services diagrams bring, then you'll need also a diagramming tool for architecture to share your vision. Luckily, ConceptDraw DIAGRAM has a special AWS Diagrams solution with vector icons and templates that are easy to edit.
The AWS architecture diagram, you see on this drawing, was designed using ConceptDraw Amazon Web Services Architecture Diagrams (AWS) solution. The 14 libraries, delivered with this solution introduces near 250 vector graphic images used to draw AWS Diagrams. The AWS Architecture Diagrams solution is a valuable tool for programmers, software architects and other IT professionals. It enables them to develop reliable applications with a high stage of interaction with AWS cloud.
Picture: Amazon Web Services Diagrams diagramming tool for architecture
Activity on Node Network Diagramming Tool - Activity Network and Project Evaluation and Review Technique, or PERT, charts are a way of documenting and analyzing the tasks in a project.
This sample shows the Activity on node network diagramming method. It was created in ConceptDraw DIAGRAM diagramming and vector drawing software using the Seven Management and Planning Tools solution from the Management area of ConceptDraw Solution Park.
Picture: Activity on Node Network Diagramming Tool
Related Solution:
ConceptDraw DIAGRAM extended with Mathematics solution from the Science and Education area is a powerful diagramming and vector drawing software that offers all needed tools for mathematical diagrams designing.
Mathematics solution provides 3 libraries with predesigned vector mathematics symbols and figures:
Solid Geometry Library, Plane Geometry Library and Trigonometric Functions Library.
Picture: Mathematics Symbols
Related Solution:
ConceptDraw DIAGRAM diagramming and vector drawing software extended with Rapid UML Solution from the Software Development Area is a powerful online diagram tool that will help you design any types of UML diagrams simply and fast.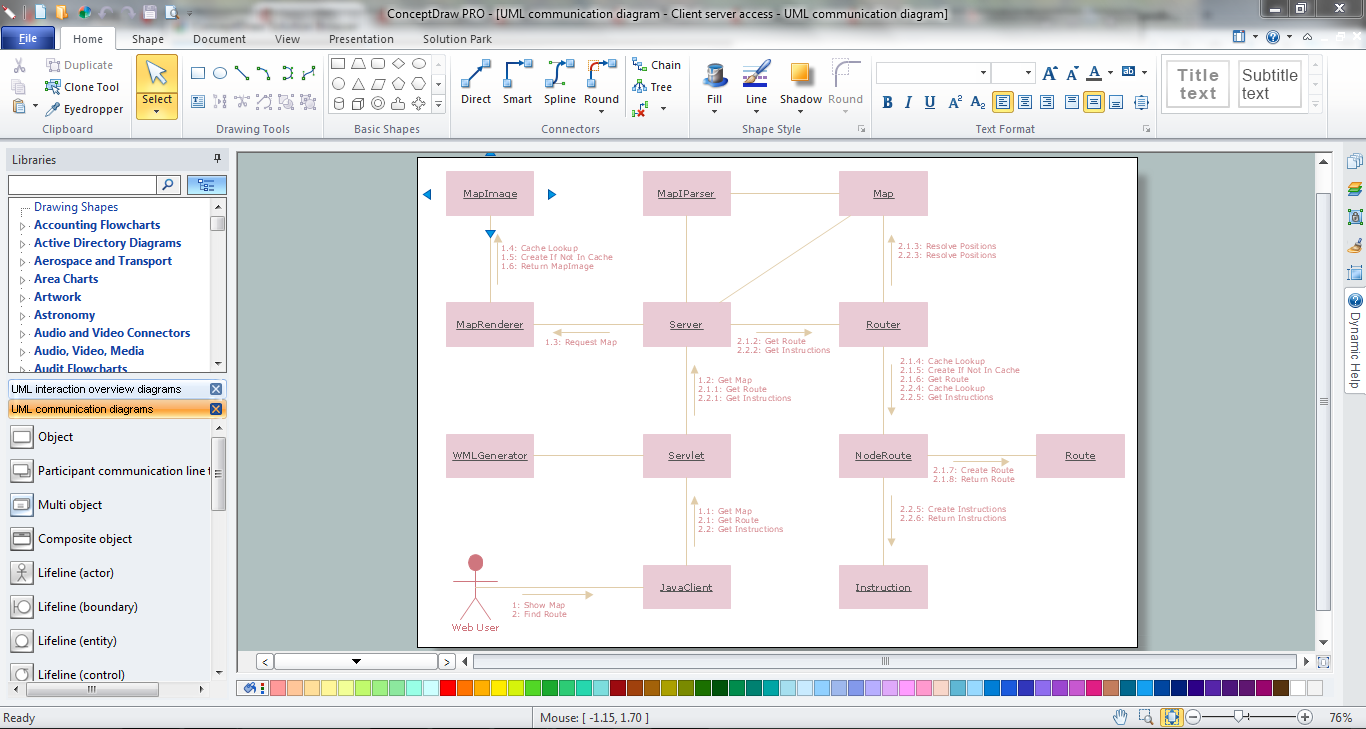
Picture: Online Diagram Tool
Related Solution:
Compare flowchart software by type, features, and workflow fit. Learn the difference between desktop and online tools and choose the right solution for documentation or collaboration.
Picture: Flowchart Software: Tools for Process and Workflow Diagramming
Related Solution:
ConceptDraw DIAGRAM - business process modeling software for mac offers the Business Process Diagram Solution with powerful tools to help you easy represent the business processes and create the business process diagrams based on BPMN 1.2 and BPMN 2.0 standards that allows to create of both simple and complex (nested) models of processes.
There are 16 BPMN 1.2 and BPMN 2.0 stencil libraries containing 230 vector objects: Rapid Draw library, Connections library, Gateways and Artifacts libraries, Data library, Gateways library, Choreographies library, Conversations library, Activities libraries, Events libraries, Expanded Objects libraries, Swim lanes libraries.
Picture: Business Process Modeling Software for Mac
Related Solution:
Wireless Networks solution from ConceptDraw Solution Park extends ConceptDraw DIAGRAM to help network engineers and designers efficiently illustrate wireless network mode diagrams.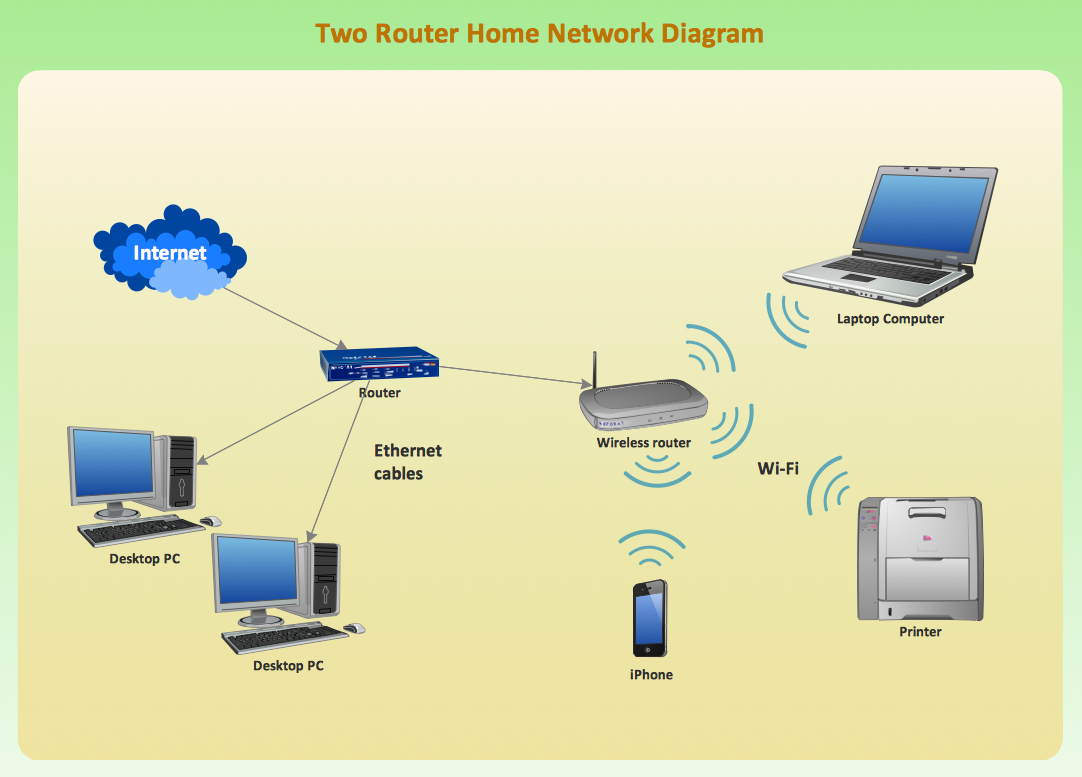
Picture: Wireless Network Mode
Related Solution:
Value Stream Mapping for the lean office is a tool that uses a flow diagram to document in great detail every step of a manufacturing process.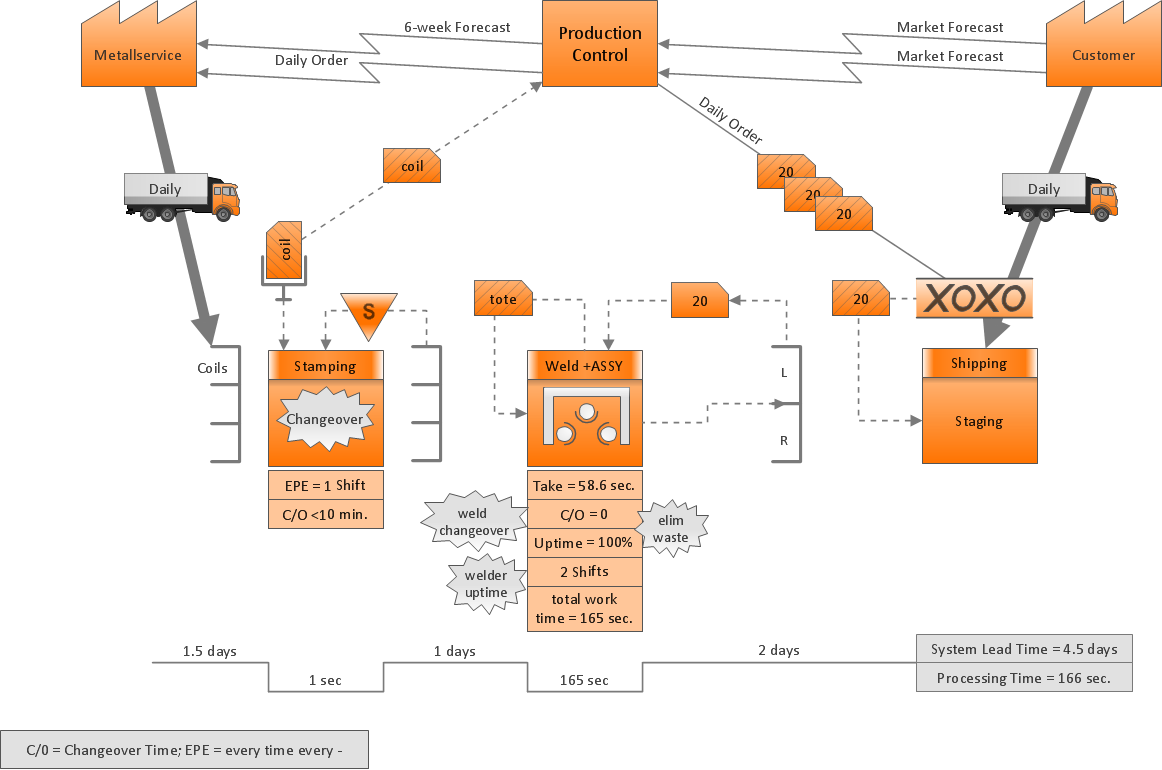
Picture: Value Stream Mapping for the Lean Office
Related Solution:
A waterfall model describes software development process as a sequence of phases that flow downwards. SSADM is one of the implementations of waterfall method. It’s easier to learn about structured systems analysis and design method (SSADM) with ConceptDraw DIAGRAM because this software has appropriate tools for creating data flow diagrams. You can use all the three main techniques of SSADM method with special tools and predesigned templates.
This data flow diagram illustrates the Structured Systems Analysis and Design Method. This method method considers analysis, projecting and documenting of information systems. Data flow models are the most important elements of SSADM and data flow diagrams are usually used for their description. It includes the analysis and description of a system as well as visualization of possible issues.
Picture: Structured Systems Analysis and Design Method. SSADM with ConceptDraw DIAGRAM
Related Solution: