
Example 1. Scrum
SCRUM Workflow Solution provides numerous collection of Scrum samples and examples, and 8 libraries with large variety of ready-to-use scrum design elements and live objects.
All these objects are vector and ready-to-use, simply drag desired of them from the libraries to your document to design your Scrum diagram in minutes.
Scrum definition
The first Scrum definition was given in 1986 by Hirotaka Takeuchi and Ikujiro Nonaka in the New Product Development Game. They defined the scrum as "a flexible, holistic product development strategy where a development team works as a unit to reach a common goal".
Now, Scrum is a widely used methodology which allows the team quickly react and adapt to the changing market conditions and new technologies, and accordingly to the changing needs.

Example 2. Scrum Sprint Cycle
Scrum Methodology and Project Management
At this moment is used large quantity of different methodologies for effective management of people, companies, processes and projects, Scrum is one of them. Scrum is successfully applied at the process of software development and creation of informational management systems.
Regardless that Scrum methodology appeared relatively recently, it immediately received great recognition because it is an universal project management system that lets to obtain high values of efficiency and development when spending the minimal resources.

Example 3. Scrum Create Project Vision
The samples you see on this page were created in ConceptDraw DIAGRAM using the SCRUM Workflow Solution for ConceptDraw DIAGRAM These Scrum diagrams successfully demonstrate solution's capabilities and professional results you can achieve. An experienced user spent 10-15 minutes creating each of these samples.
Use the SCRUM Workflow Solution for ConceptDraw DIAGRAM software to create your own professional looking Scrum diagrams, illustrations and infographics of any complexity quick, easy and effective.
All source documents are vector graphic documents. They are available for reviewing, modifying, or converting to a variety of formats (PDF file, MS PowerPoint, MS Visio, and many other graphic formats) from the ConceptDraw STORE. The SCRUM Workflow Solution is available for all ConceptDraw DIAGRAM users.
TEN RELATED HOW TO's:
You need to draw Authority Matrix Diagram quick and easy? Design it with ConceptDraw DIAGRAM!
ConceptDraw DIAGRAM extended with Seven Management and Planning Tools solution from the Management Area is the best Authority Matrix Diagram Software.
Picture: Authority Matrix Diagram Software
Related Solution:
Jackson System Development (JSD) is a linear method of system development created by Michael A. Jackson and John Cameron in the 1980s. It comprises the whole software life cycle directly or providing a framework for more specialized techniques.
When implementing the Jackson System Development method and designing JSD diagrams, you can succesfully use the powerful and helpful tools of ConceptDraw DIAGRAM software extended with Entity-Relationship Diagram (ERD) solution from the Software Development area of ConceptDraw Solution Park.
Picture: JSD - Jackson system development
Related Solution:
Job duties in small companies are usually spread randomly among workers, causing lots of problems and misunderstanding. One of the ways to restore order in business processing is to create a cross-functional flowchart with swim lanes that would represent every step in production system. Another advantage of using swim lanes flowchart is that it represents not only processes, but people responsible for them.
Swim lane diagram is a kind of a process flow diagram. Its special feature is that it joins the features of process flow diagrams with organizational charts. Thus, a swim lane diagram display a participant of the business process in a conjunction with general flow of the business system. A swim lane diagram is looks similar to a swimming pool's lanes. Lanes can be horizontal and vertical. The lanes are pointed out relatively to resource name, which is assigned on implementation of the given part of the business process. ConceptDraw Business Process Mapping solution delivers the ability to design develop swim lanes flowcharts using the vector graphic objects of Swim Lanes library.
Picture: Swim Lane Diagrams
Related Solution:
3D Network Diagrams are very popular diagrams in the field of network technologies. They have more visual, clear, attractive and understandable look than 2D. ConceptDraw DIAGRAM gives the opportunity to draw the professional looking 3D Network Diagrams easy, quick and effective.
This example shows the 3D Network Diagram. It was created in ConceptDraw DIAGRAM using the 3D network elements from the Computer and Networks solution from the Computer and Networks area of ConceptDraw Solution Park.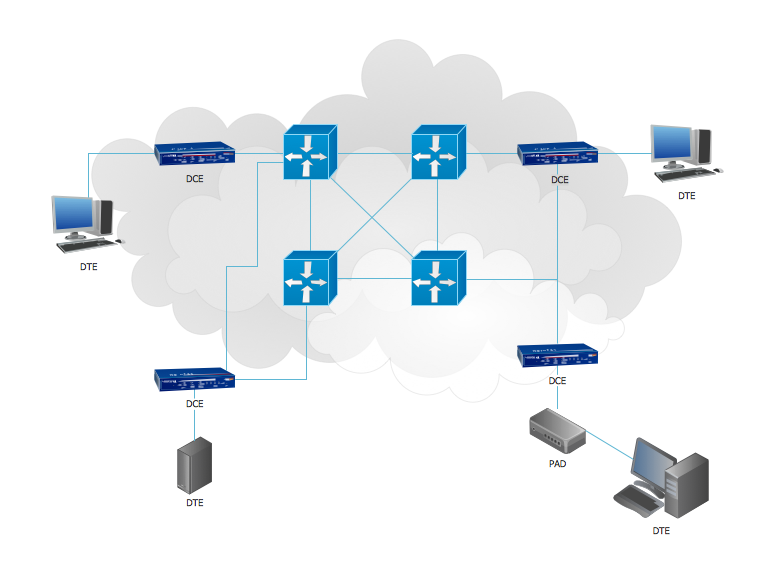
Picture: 3D Network Diagrams. Computer and Network Examples
Related Solution:
The term “cloud” is very popular and widely used now, it is a server, data processing centre, or a network which lets to store the data and software, provides access to them, allows to run applications without installation and gives the possibility to process data hosted remotely via the Internet connection.
For documenting the Cloud Computing Architecture with a goal to facilitate the communication between stakeholders are successfully used the Cloud Computing Architecture diagrams. It is convenient and easy to draw various Cloud Computing Architecture diagrams in ConceptDraw DIAGRAM software with help of tools of the Cloud Computing Diagrams Solution from the Computer and Networks Area of ConceptDraw Solution Park.
Picture: How to Build Cloud Computing DiagramPrincipal Cloud Manufacturing
Related Solution:
You can design the Prioritization Matrix by hand on the paper, but we offer you the most easier way — to use the ConceptDraw DIAGRAM diagramming and vector drawing software extended with Seven Management and Planning Tools Solution from the Management Area.
Picture: Prioritization Matrix
Related Solution:
There are many tools that are used within data modeling processes but to make the correct model it is always better to draw it graphically so it becomes more obvious whether it is good enough to use or not. Having the ConceptDraw DIAGRAM diagramming and drawing software may lead to creating the great looking ORM drawings, such as ORM diagrams, especially if you have the Object-Role Modeling (ORM) solution downloaded from the ConceptDraw STORE application — another product of CS Odessa that can be used by all the ConceptDraw DIAGRAM users.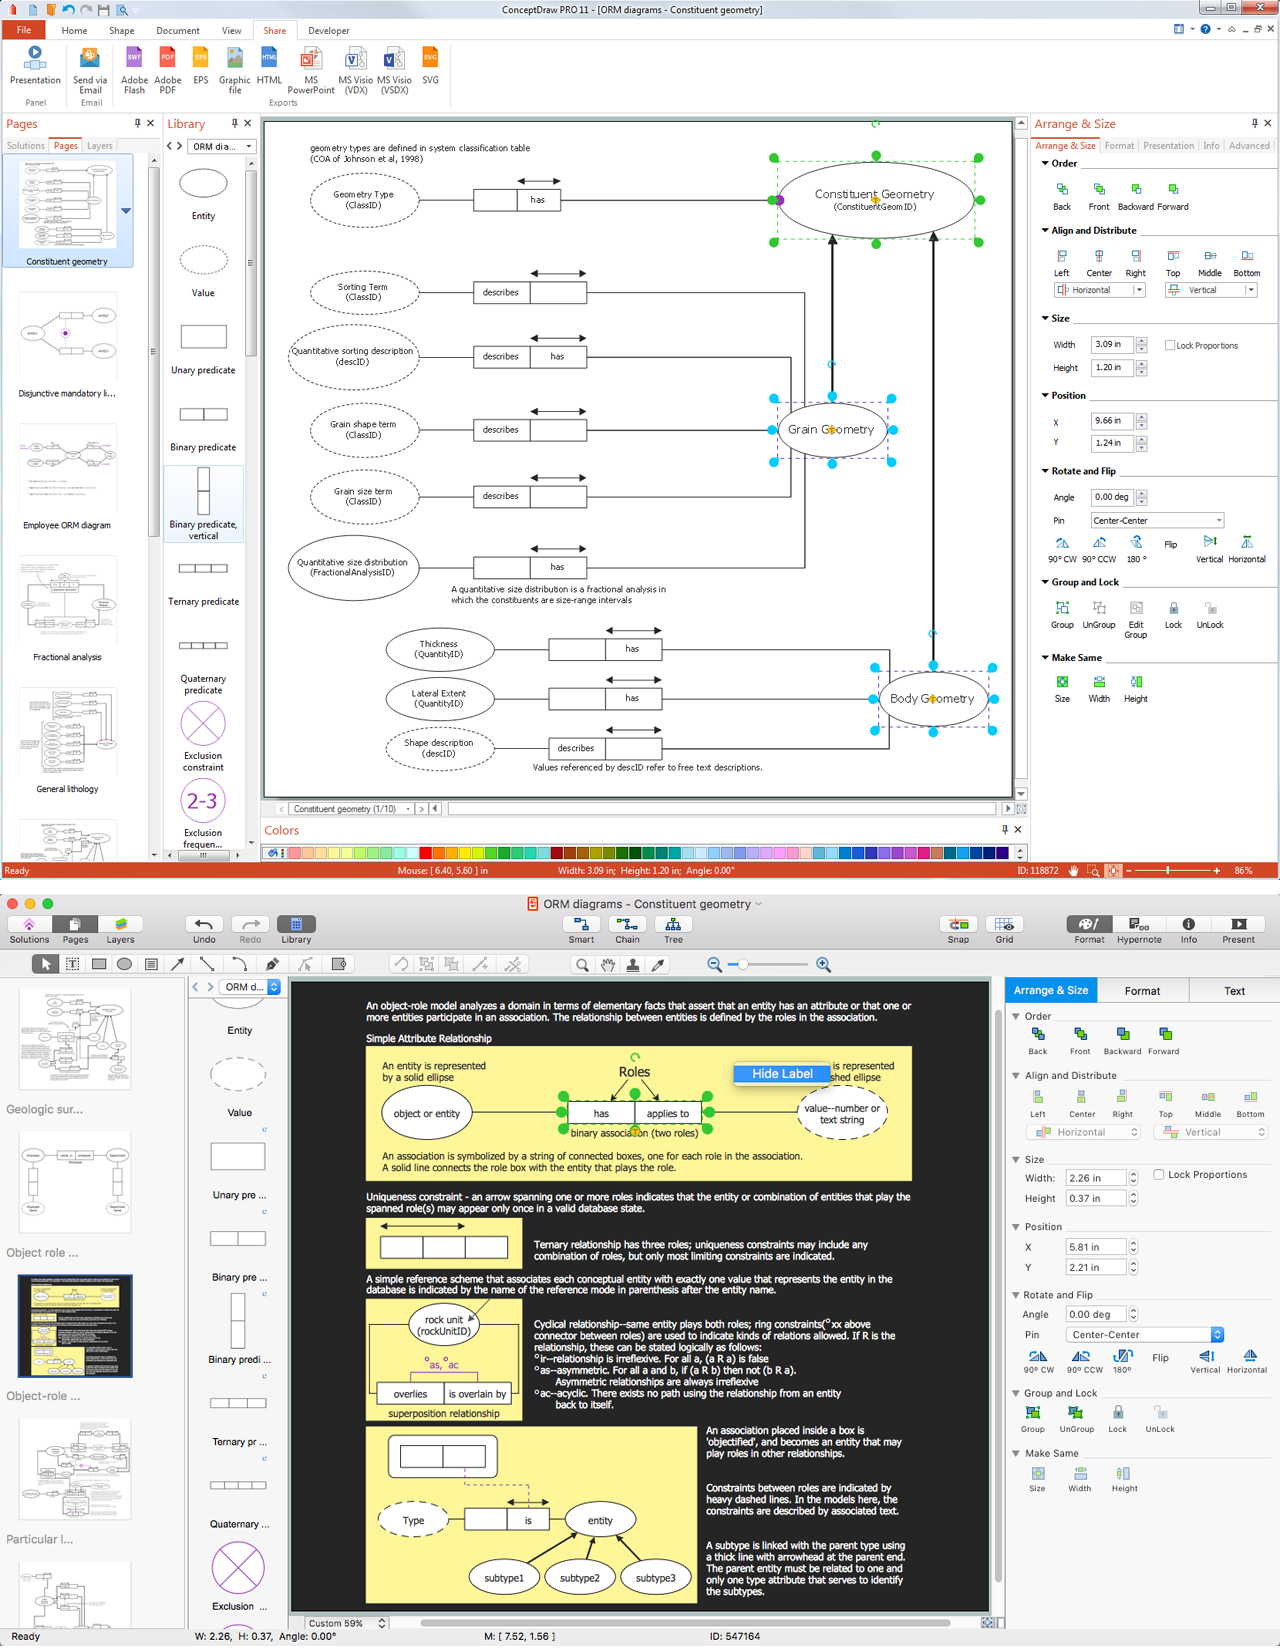
Picture: Data Modeling Tools
Related Solution:
Onion diagram is a type of circular diagram that consists of the core circle representing the product/solution and concentric circles around it, which dependent on the core and look like the cross sections of onion.
ConceptDraw DIAGRAM diagramming and vector drawing software supplied with Stakeholder Onion Diagrams Solution from the Management Area of ConceptDraw Solution Park is an ideal software for effective Onion diagram process design.
Picture: Onion Diagram Process Design
Related Solution:
ConceptDraw DIAGRAM diagramming and vector drawing software extended with Specification and Description Language (SDL) Solution from the Industrial Engineering Area of ConceptDraw Solution Park provides powerful drawing tools for quick and easy creating well-designed FSM diagrams.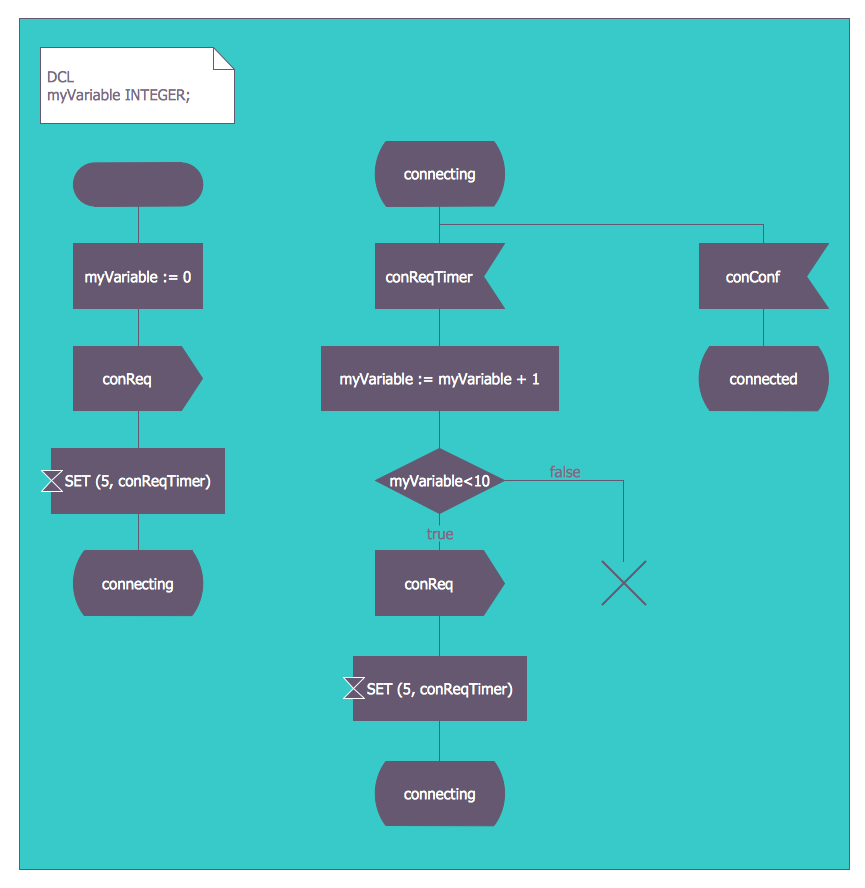
Picture: FSM — Finite-state Machine
Related Solution:
ConceptDraw helps you to start designing your own UML Collaboration Diagrams with examples and templates.
Picture: Diagramming Software for Design UML Collaboration Diagrams


