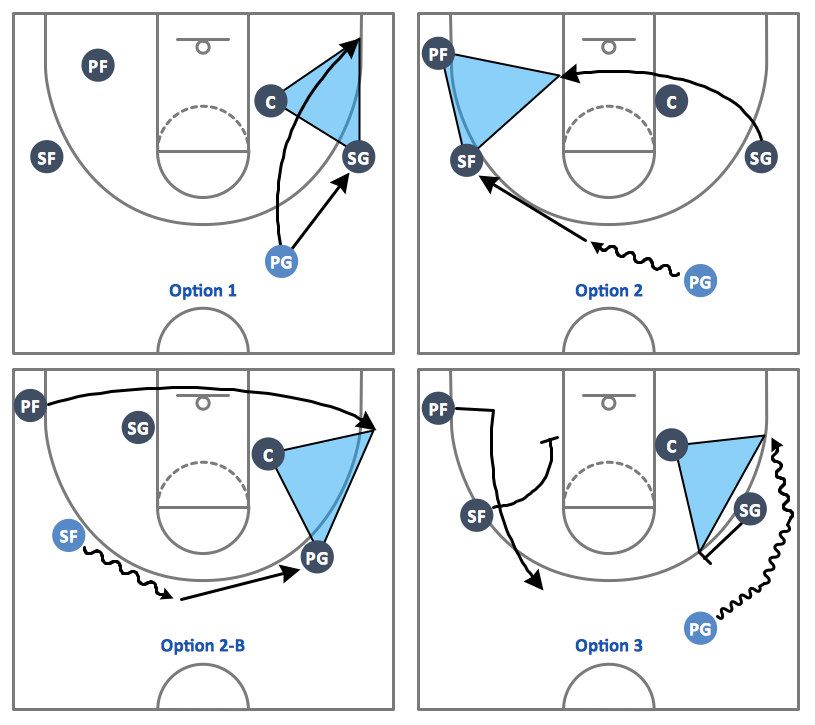
Sample 1. Basketball Plays – Triangle Offense
Use various court clipart from the "Basketball Courts" library to show the game in details from the different angles of view.

Sample 2. Design Elements – Basketball Courts
The library objects are scalable vector images that can be easily exported to PDF format, Microsoft PowerPoint, Microsoft Visio, graphic image file, or HTML.

Sample 3. Basketball Field View from Short Side
The Basketball solution helps you quickly create your own original basketball illustrations, presentation slides, website, and blog pages using the ConceptDraw DIAGRAM diagramming and vector drawing software.

Sample 4. Basketball – Court Diagram and Positions
The samples you see on this page were created in ConceptDraw DIAGRAM using the "Basketball Courts" and "Basketball Positions" libraries from the Basketball Solution. An experienced user spent 15 minutes creating every of these samples. All these samples were included to the Basketball solution. They are professional looking practical samples and you can quick and easy modify them, print, or publish on web.
All source documents are vector graphic documents. They are available for reviewing, modifying, or converting to a variety of formats (PDF file, MS PowerPoint, MS Visio, and many other graphic formats) from the ConceptDraw STORE. The Basketball Solution is available for all ConceptDraw DIAGRAM or later users.
TEN RELATED HOW TO's:
Azure is a cloud computing platform developed by Microsoft which offers the extensive infrastructure and wide set of integrated Azure services useful for effective computing, storage, analytics, databases, networking, application development and deployment.
ConceptDraw DIAGRAM extended with Azure Architecture Solution from the Computer and Networks area is a powerful diagramming and vector drawing software with extensive set of useful drawing tools for easy creating Azure Architecture Diagrams and documenting Azure services.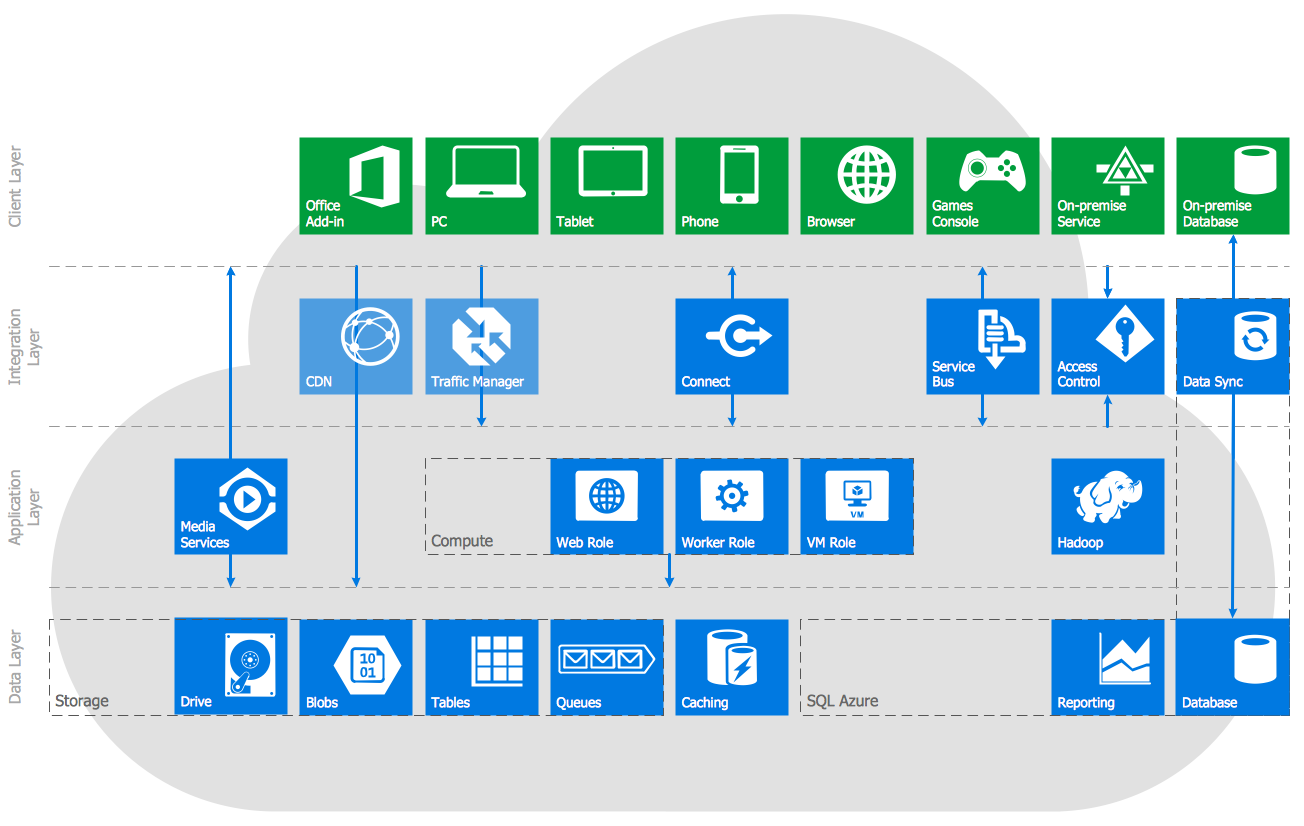
Picture: Azure Services
Related Solution:
Informative and well-designed Infographics allows visually present various map containing information.
Picture: Informative and Well-Designed Infographics
The popularity of Block Diagrams grows day by day. The existence of powerful software for their design is an excellent news! ConceptDraw DIAGRAM Block Diagram Software offers the Block Diagrams Solution from the Diagrams Area.
Picture: Block Diagram Software
Related Solution:
TOWS Matrix is an effective tool which allows to analize the external opportunities and threats by means of analyzing the internal strengths and weaknesses of a company. ConceptDraw DIAGRAM diagramming and vector drawing software extended with SWOT and TOWS Matrix Diagrams Solution from the Management Area will help design TOWS Matrix for your company without efforts.
Picture: TOWS Matrix
Related Solution:
A resistor is a passive two-terminal electrical component that implements electrical resistance as a circuit element. Resistors may be used to reduce current flow, and, at the same time, may act to lower voltage levels within circuits. In electronic circuits, resistors are used to limit current flow, to adjust signal levels, bias active elements, and terminate transmission lines among other uses. Fixed resistors have resistances that only change slightly with temperature, time or operating voltage. Variable resistors can be used to adjust circuit elements (such as a volume control or a lamp dimmer), or as sensing devices for heat, light, humidity, force, or chemical activity.
26 libraries of the Electrical Engineering Solution of ConceptDraw DIAGRAM make your electrical diagramming simple, efficient, and effective. You can simply and quickly drop the ready-to-use objects from libraries into your document to create the electrical diagram.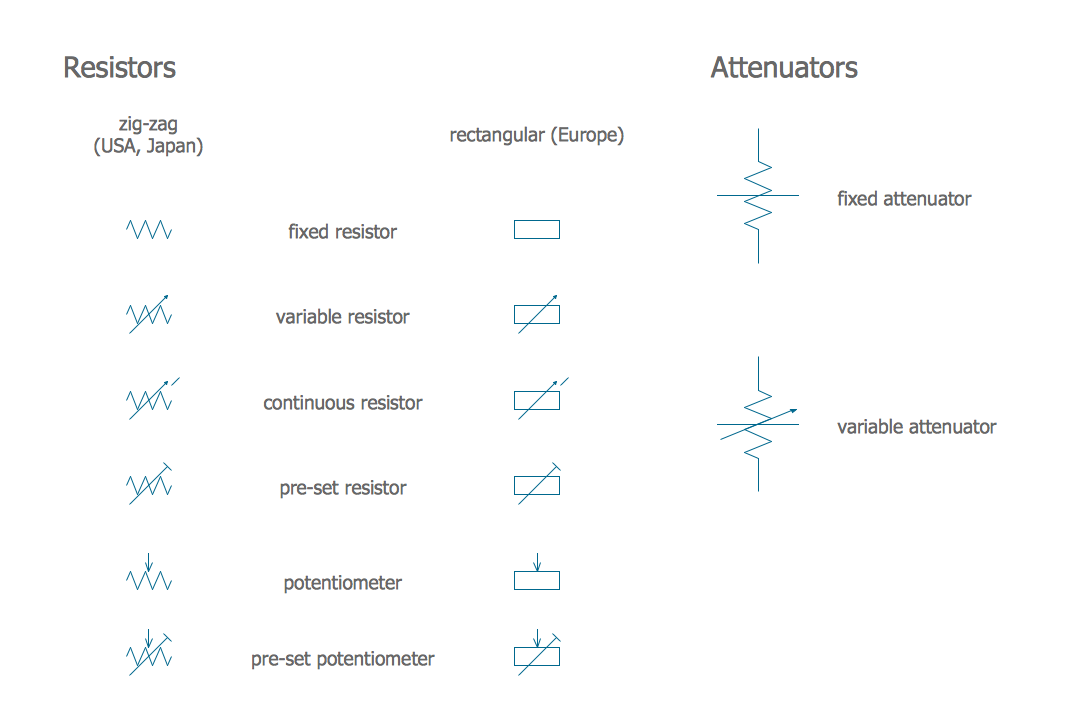
Picture: Electrical Symbols — Resistors
Related Solution:
This sample shows the Flowchart that displays the solid-state welding processes, the types of welding.
Picture: Types of Welding in Flowchart
Related Solution:
An abstract representation is usually the first thing you will need while developing a database. To understand the ways that databases are structured, you should look through entity-relationship diagram examples and see the notations features and attributes. With an entity-relationship model you can describe a database of any complexity.
This Entity-relationship diagram is a tool for software developers. It enables every element of database to be managed, communicated and tested before release. This ERD was created using symbols advocated by Chen's notation. Because of a linguistic origin of the Chen’s notation, the boxes representing entities could be interpreted as nouns, and the relationships between them are in verb form, shown on a diagram as a diamond.
Picture: Entity Relationship Diagram Examples
Related Solution:
ConceptDraw DIAGRAM extended with IDEF0 Diagrams solution from the Software Development area of ConceptDraw Solution Park is a powerful diagramming and vector drawing IDEF0 software. All IDEF0 diagrams created in ConceptDraw DIAGRAM are vector graphic documents and can be reviewed, modified and converted to MS Visio XML format. To obtain the IDEF0 Visio documents from ConceptDraw DIAGRAM documents use the wide export possibilities of ConceptDraw DIAGRAM.
Picture: IDEF0 Visio
Related Solution:
Explaining offensive strategies of American Football is practically impossible without drawing a diagram. If you need to do this more than once you have to choose an appropriate tool allows you to change diagrams easily. ConceptDraw DIAGRAM extended with the Football Solution is the best choice for this case.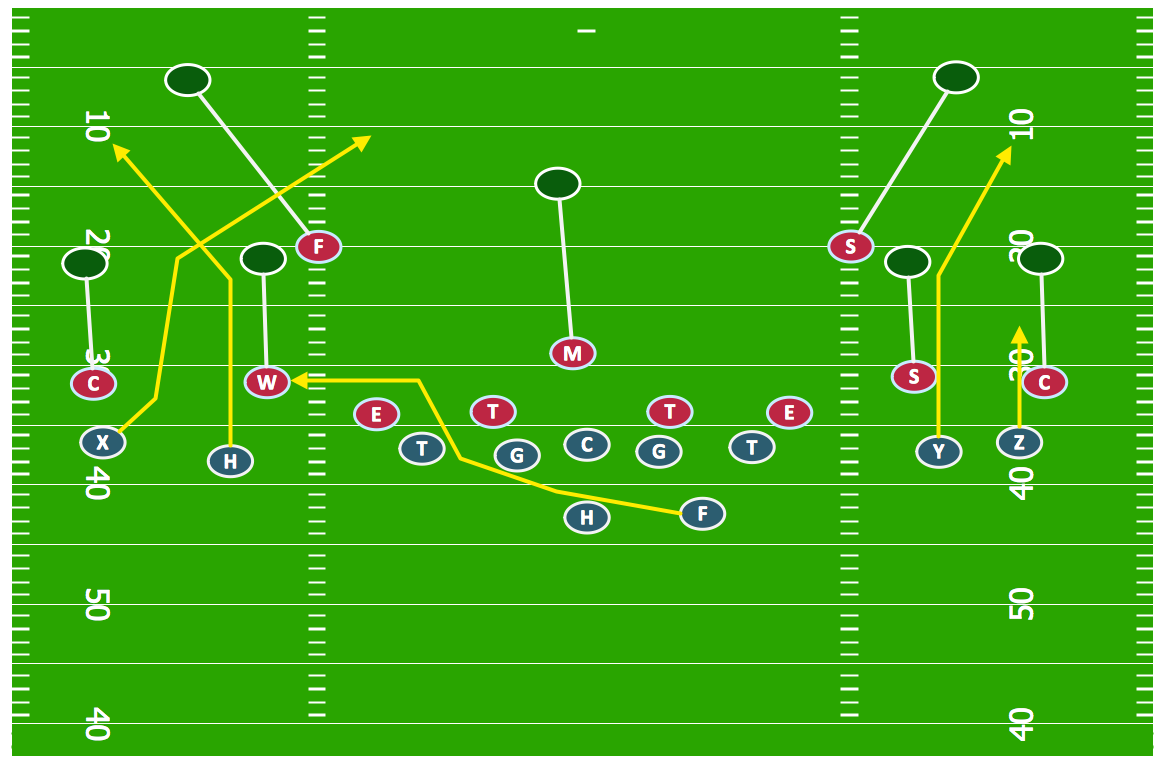
Picture: Offensive Strategy — Spread Offense Diagram
Related Solution:
A set of predesigned fields and positions allows producing baseball diagrams without any drawing experience.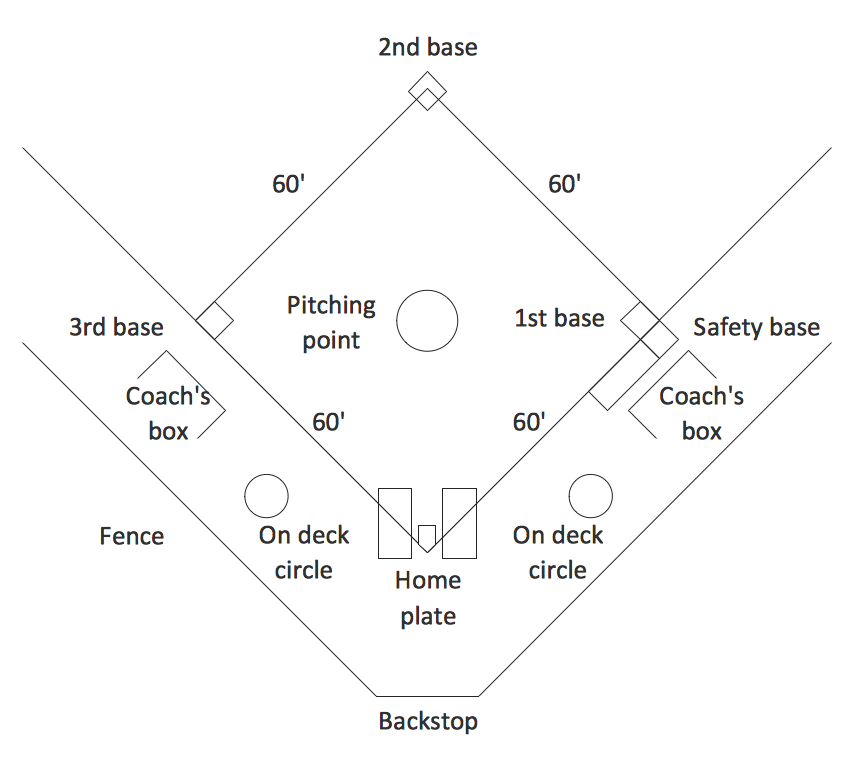
Picture: Simple Baseball Field — Sample
Related Solution:


