Marketing - Design Elements
Marketing - Vector clipart libraryThe vector stencils library Marketing is included in the Business and Finance solution from Illustration area of ConceptDraw Solution Park. Use it to quick draw illustrations, diagrams and infographics for your marketing and sales documents, presentations and websites. The clipart library Marketing includes 43 icons:
|
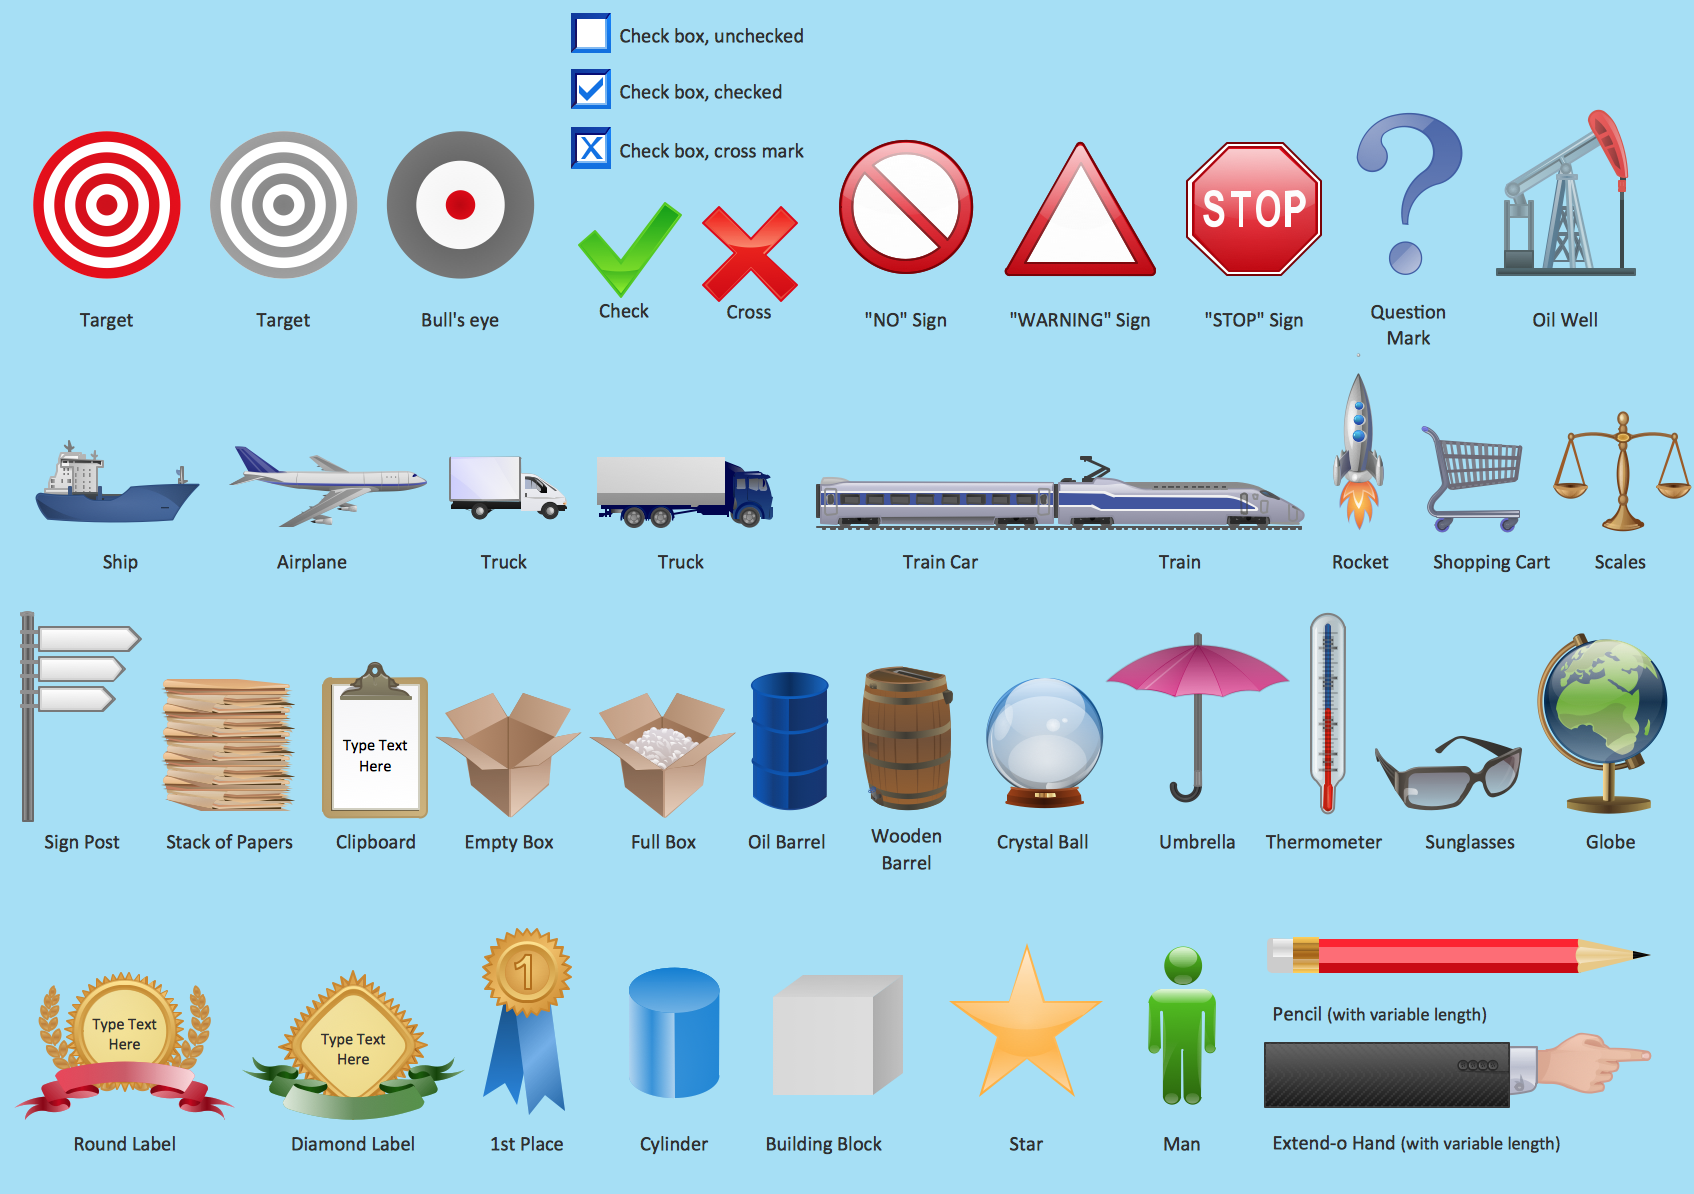
Pic.1 Marketing - Design Elements
See also Samples:
- Illustration - Aerospace and Transport
- Illustration - Artwork
- Illustration - Audio, video, media
- Illustration - Business and finance
- Illustration - Computers and communications
- Illustration - Manufacturing
- Illustration - Nature
- Illustration - People
- Illustration - Presentation clipart
- Illustration - Safety and security
- Science & Education — illustrations
TEN RELATED HOW TO's:
A Data Flow Diagram (DFD) is a graphical technique which allows effectively model and analyze the information processes and systems. The ability to fast and easy create the DFDs is made possible with Data Flow Diagrams solution from the Software Development area of ConceptDraw Solution Park. For designing the Data Flow Diagrams are used simple DFD flowchart symbols which are connected each other by arrows depicting the data flow from one step to another.
Picture: DFD Flowchart Symbols
Related Solution:
UML Diagrams Social Networking Sites Project. This sample was created in ConceptDraw DIAGRAM diagramming and vector drawing software using the UML Use Case Diagram library of the Rapid UML Solution from the Software Development area of ConceptDraw Solution Park.
This sample shows the Facebook Socio-health system and is used at the projection and creating of the social networking sites.
Picture: UML Use Case Diagram Example. Social Networking Sites Project
Related Solution:
Create a powerful infographic, become inspired by the people with ConceptDraw.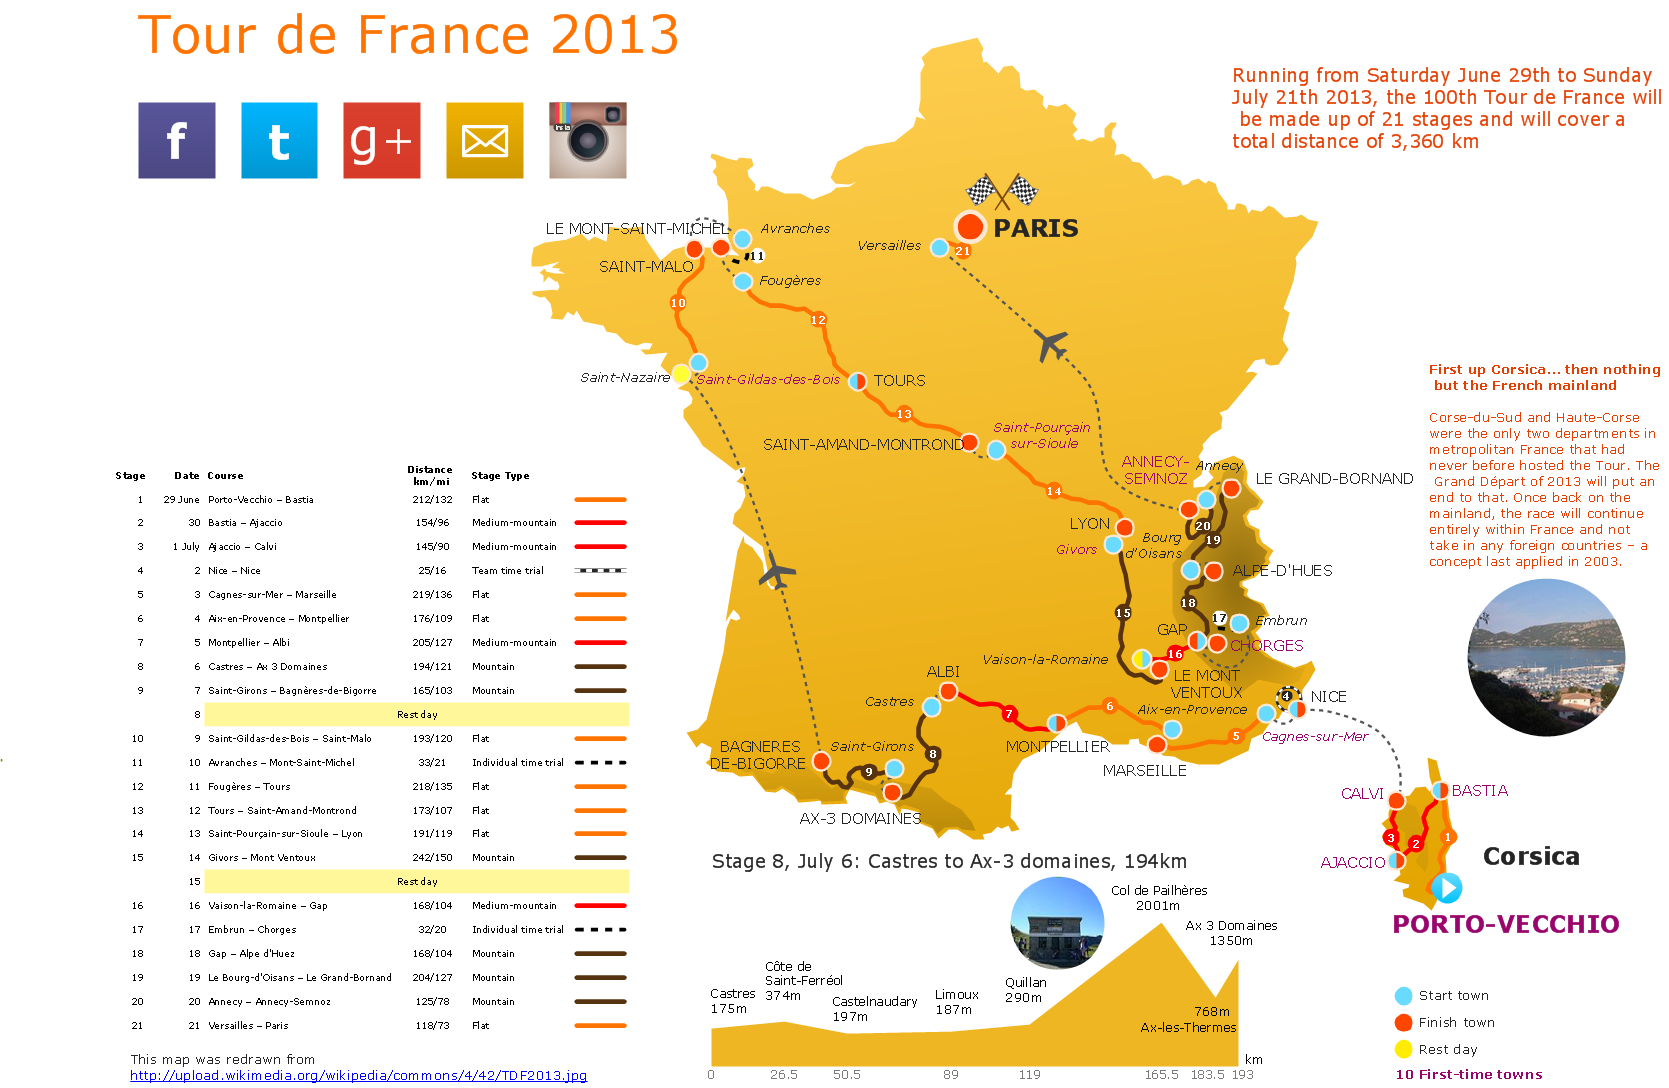
Picture:
How to Create a Powerful Infographic
When You do Not Have a Designer
Related Solution:
ConceptDraw DIAGRAM diagramming and vector drawing software extended with 25 Typical Orgcharts solution from the Management area of ConceptDraw Solution Park offers 25 ready Organization Chart templates, 10 samples and 2 libraries with predesigned vector objects.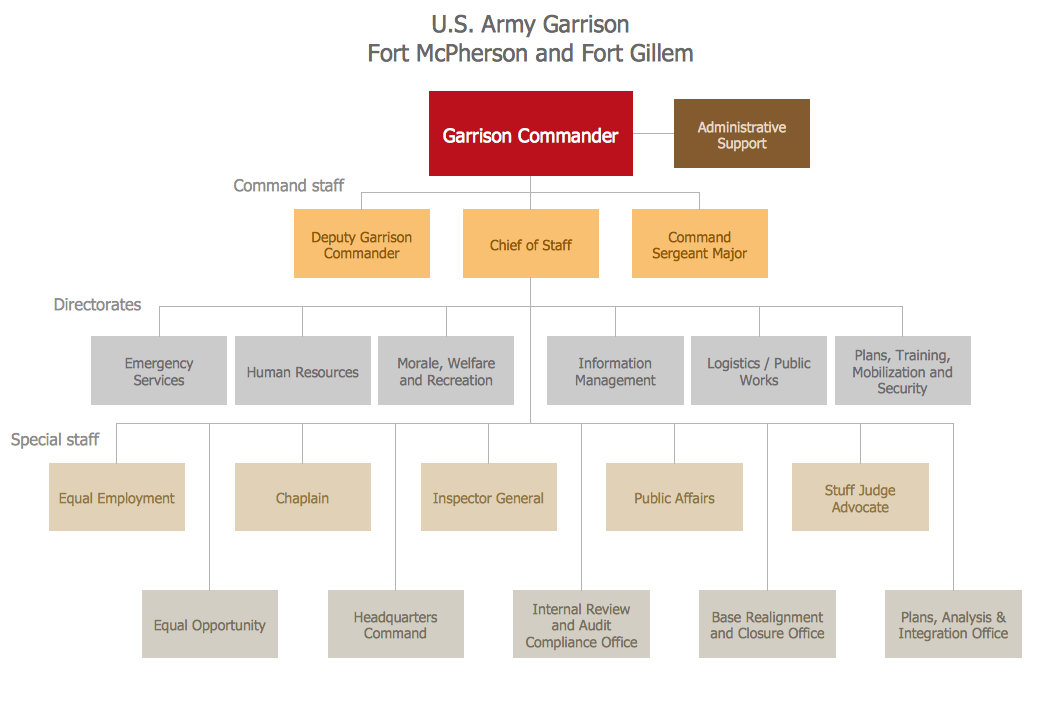
Picture: Organization Chart
Related Solution:
When you need to visually represent the structure of relational database, Entity relationship diagram (ERD) is a type of diagram for that case.
Most entity-relationship diagrams can be built with objects from Flowchart solution or ERD Solution which contains inbuilt templates. Follow these steps to create your own custom ERD diagram.
Don't be frightened if it looks complex, ConceptDraw DIAGRAM makes it easy to create an ERD, and hundreds of other diagrams, in minutes.
Picture: Developing Entity Relationship Diagrams
Related Solution:
ConceptDraw DIAGRAM is a powerful tool for business and technical diagramming.
Software Development area of ConceptDraw Solution Park provides 5 solutions:
Data Flow Diagrams, Entity-Relationship Diagram (ERD), Graphic User Interface, IDEFO Diagrams, Rapid UML.
Picture: Software Diagram Examples and Templates
Related Solution:
Developing Restaurant Layouts is very important and responsible moment in restaurant construction and designing. Now it's very simple and fast process thanks to the Cafe and Restaurant Floor Plans solution from the Building Plans area of ConceptDraw Solution Park.
Picture: Restaurant Layouts
Related Solution:
Energy Pyramid Diagram is a visual graphical representation of the biomass productivity on the each trophic level in a given ecosystem. Its designing in ConceptDraw DIAGRAM will not take much time thanks to the unique Pyramid Diagrams solution from the Marketing area of ConceptDraw Solution Park.
Energy Pyramid Diagram begins from the producers (plants) and proceeds through a few trophic levels of consumers (herbivores which eat these plants, the carnivores which eat these herbivores, then carnivores which eat those carnivores, and so on) to the top of the food chain.
Picture: Energy Pyramid Diagram
Related Solution:
These libraries of vector objects depict the Site Accessories and Parking and Roads elements. They are needed to draw architectural and landscape plans that show the architectural elements around buildings: parking spaces, hiking and biking trails, drainage systems, lights, and vehicle access control elements. These libraries are included into ConcepDraw solution for Site Planning. Site Accessories and Parking, Roads libraries contain near 40 vector images that will help depict an a surrounding territory at building plans.
These libraries of vector objects depict the Site Accessories and Parking and Roads elements. They are needed to draw architectural and landscape plans that show the architectural elements around buildings: parking spaces, hiking and biking trails, drainage systems, lights, and vehicle access control elements. These libraries are included into ConcepDraw solution for Site Planning. Site Accessories and Parking, Roads libraries contain near 40 vector images that will help depict an a surrounding territory at building plans.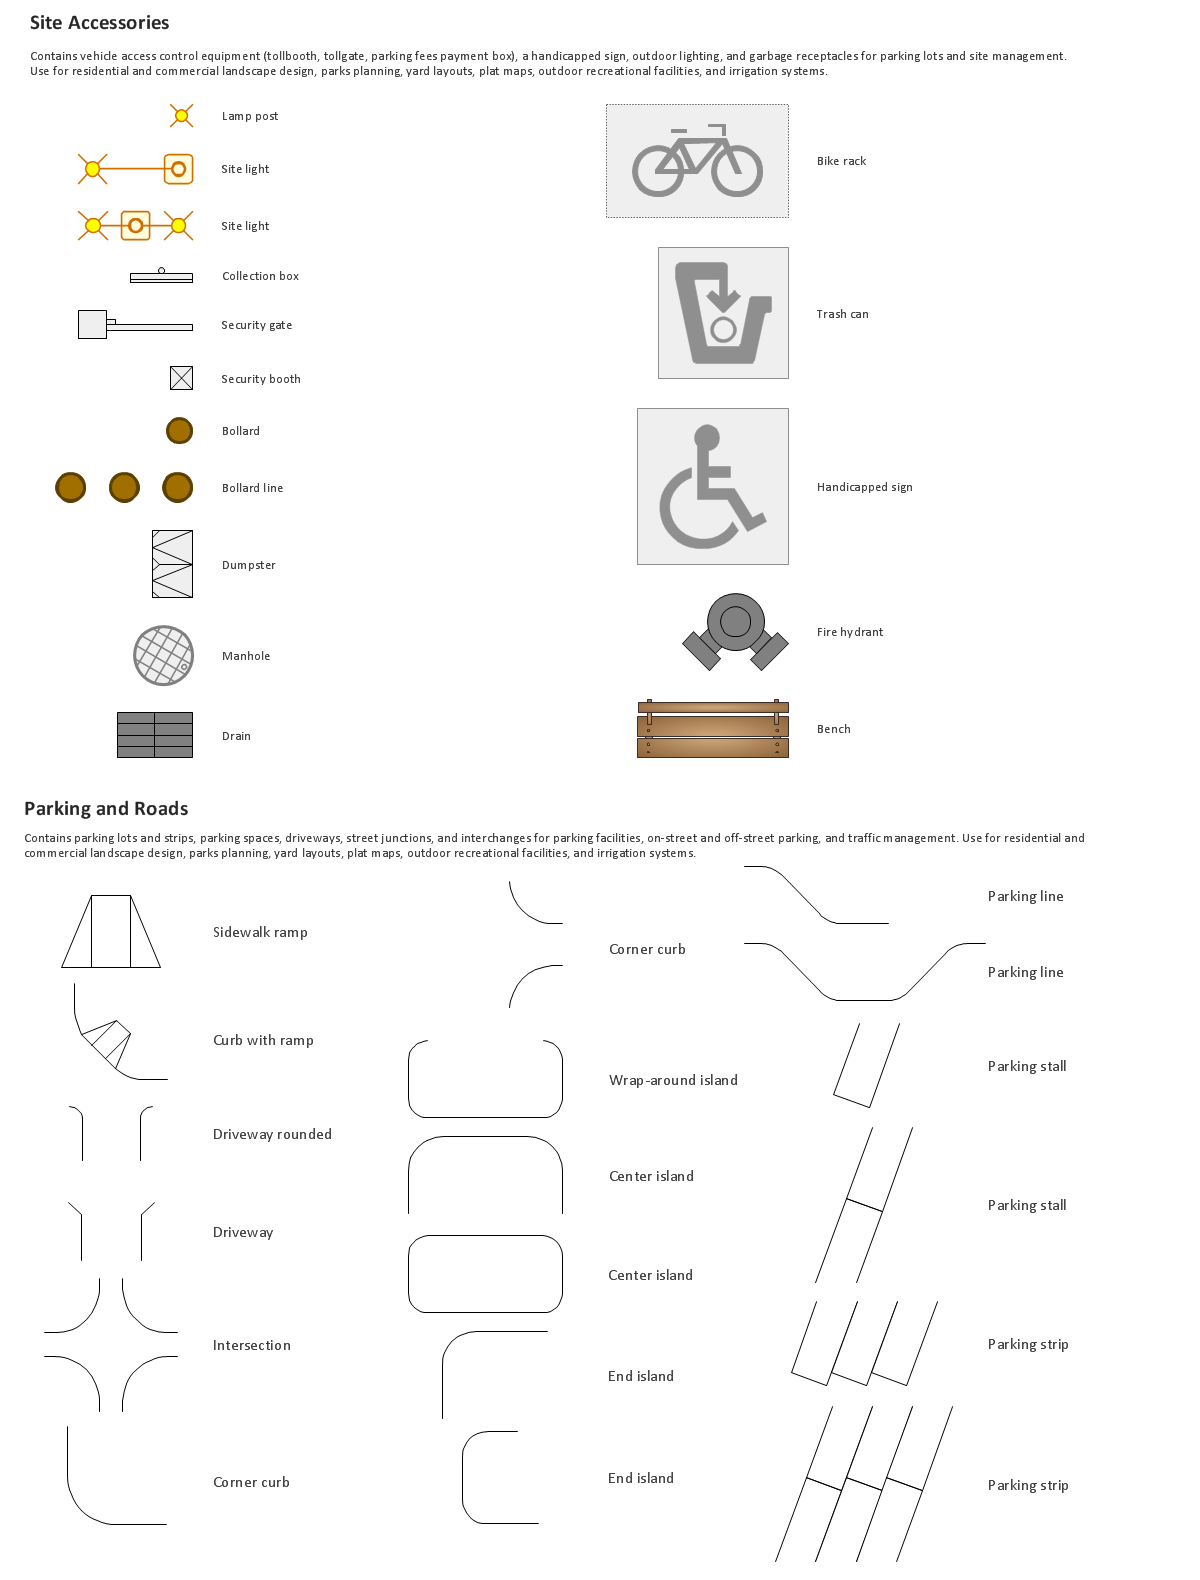
Picture: Building Drawing. Design Element Site Plan
Related Solution:
The Soccer solution for ConceptDraw DIAGRAM includes also a wide collection of templates and samples to help the soccer specialists and fans to draw any soccer-related diagrams and schemas as quickly as possible.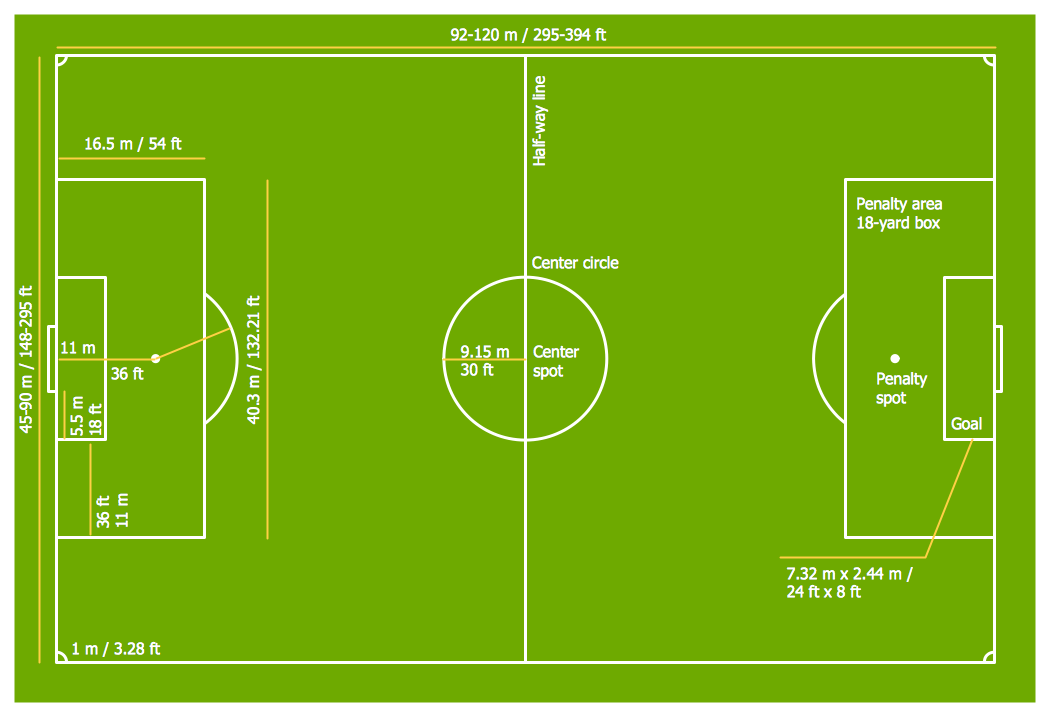
Picture: Soccer (Football) Field Templates
Related Solution:
ConceptDraw
DIAGRAM 18