How should diagramming software work? Is it possible to develop a diagram as quickly as the ideas come to you?
The innovative ConceptDraw Arrows10 Technology included in ConceptDraw DIAGRAM is a powerful drawing tool that changes the way diagrams are produced. While making the drawing process easier and faster.
ConceptDraw DIAGRAM is a powerful tool that helps you create a process map diagram quickly and easily. Fine-tuning the objects in ConceptDraw DIAGRAM allows you to create a really professional finished article. ConceptDraw Arrows10 Technology gives drawing connectors a smart behavior that provides quick and precise placement, allows for easy changes and automatic rearrangement.
As we noted previously, connectors inside of a group work in a natural manner without any special effort. We can rotate a group to see how the Arrows10 connectors work.
You can see that when you rotate a group connectors change their angle, keeping their position inside of the grouped objects. If you decide to ungroup the objects the connectors will adjust to keep lines parallel to the edges of the sheet.
The magic of ConceptDraw Arrows10’s rotating groups makes complex diagramming simple and easy. The way to connect objects has never been easier.
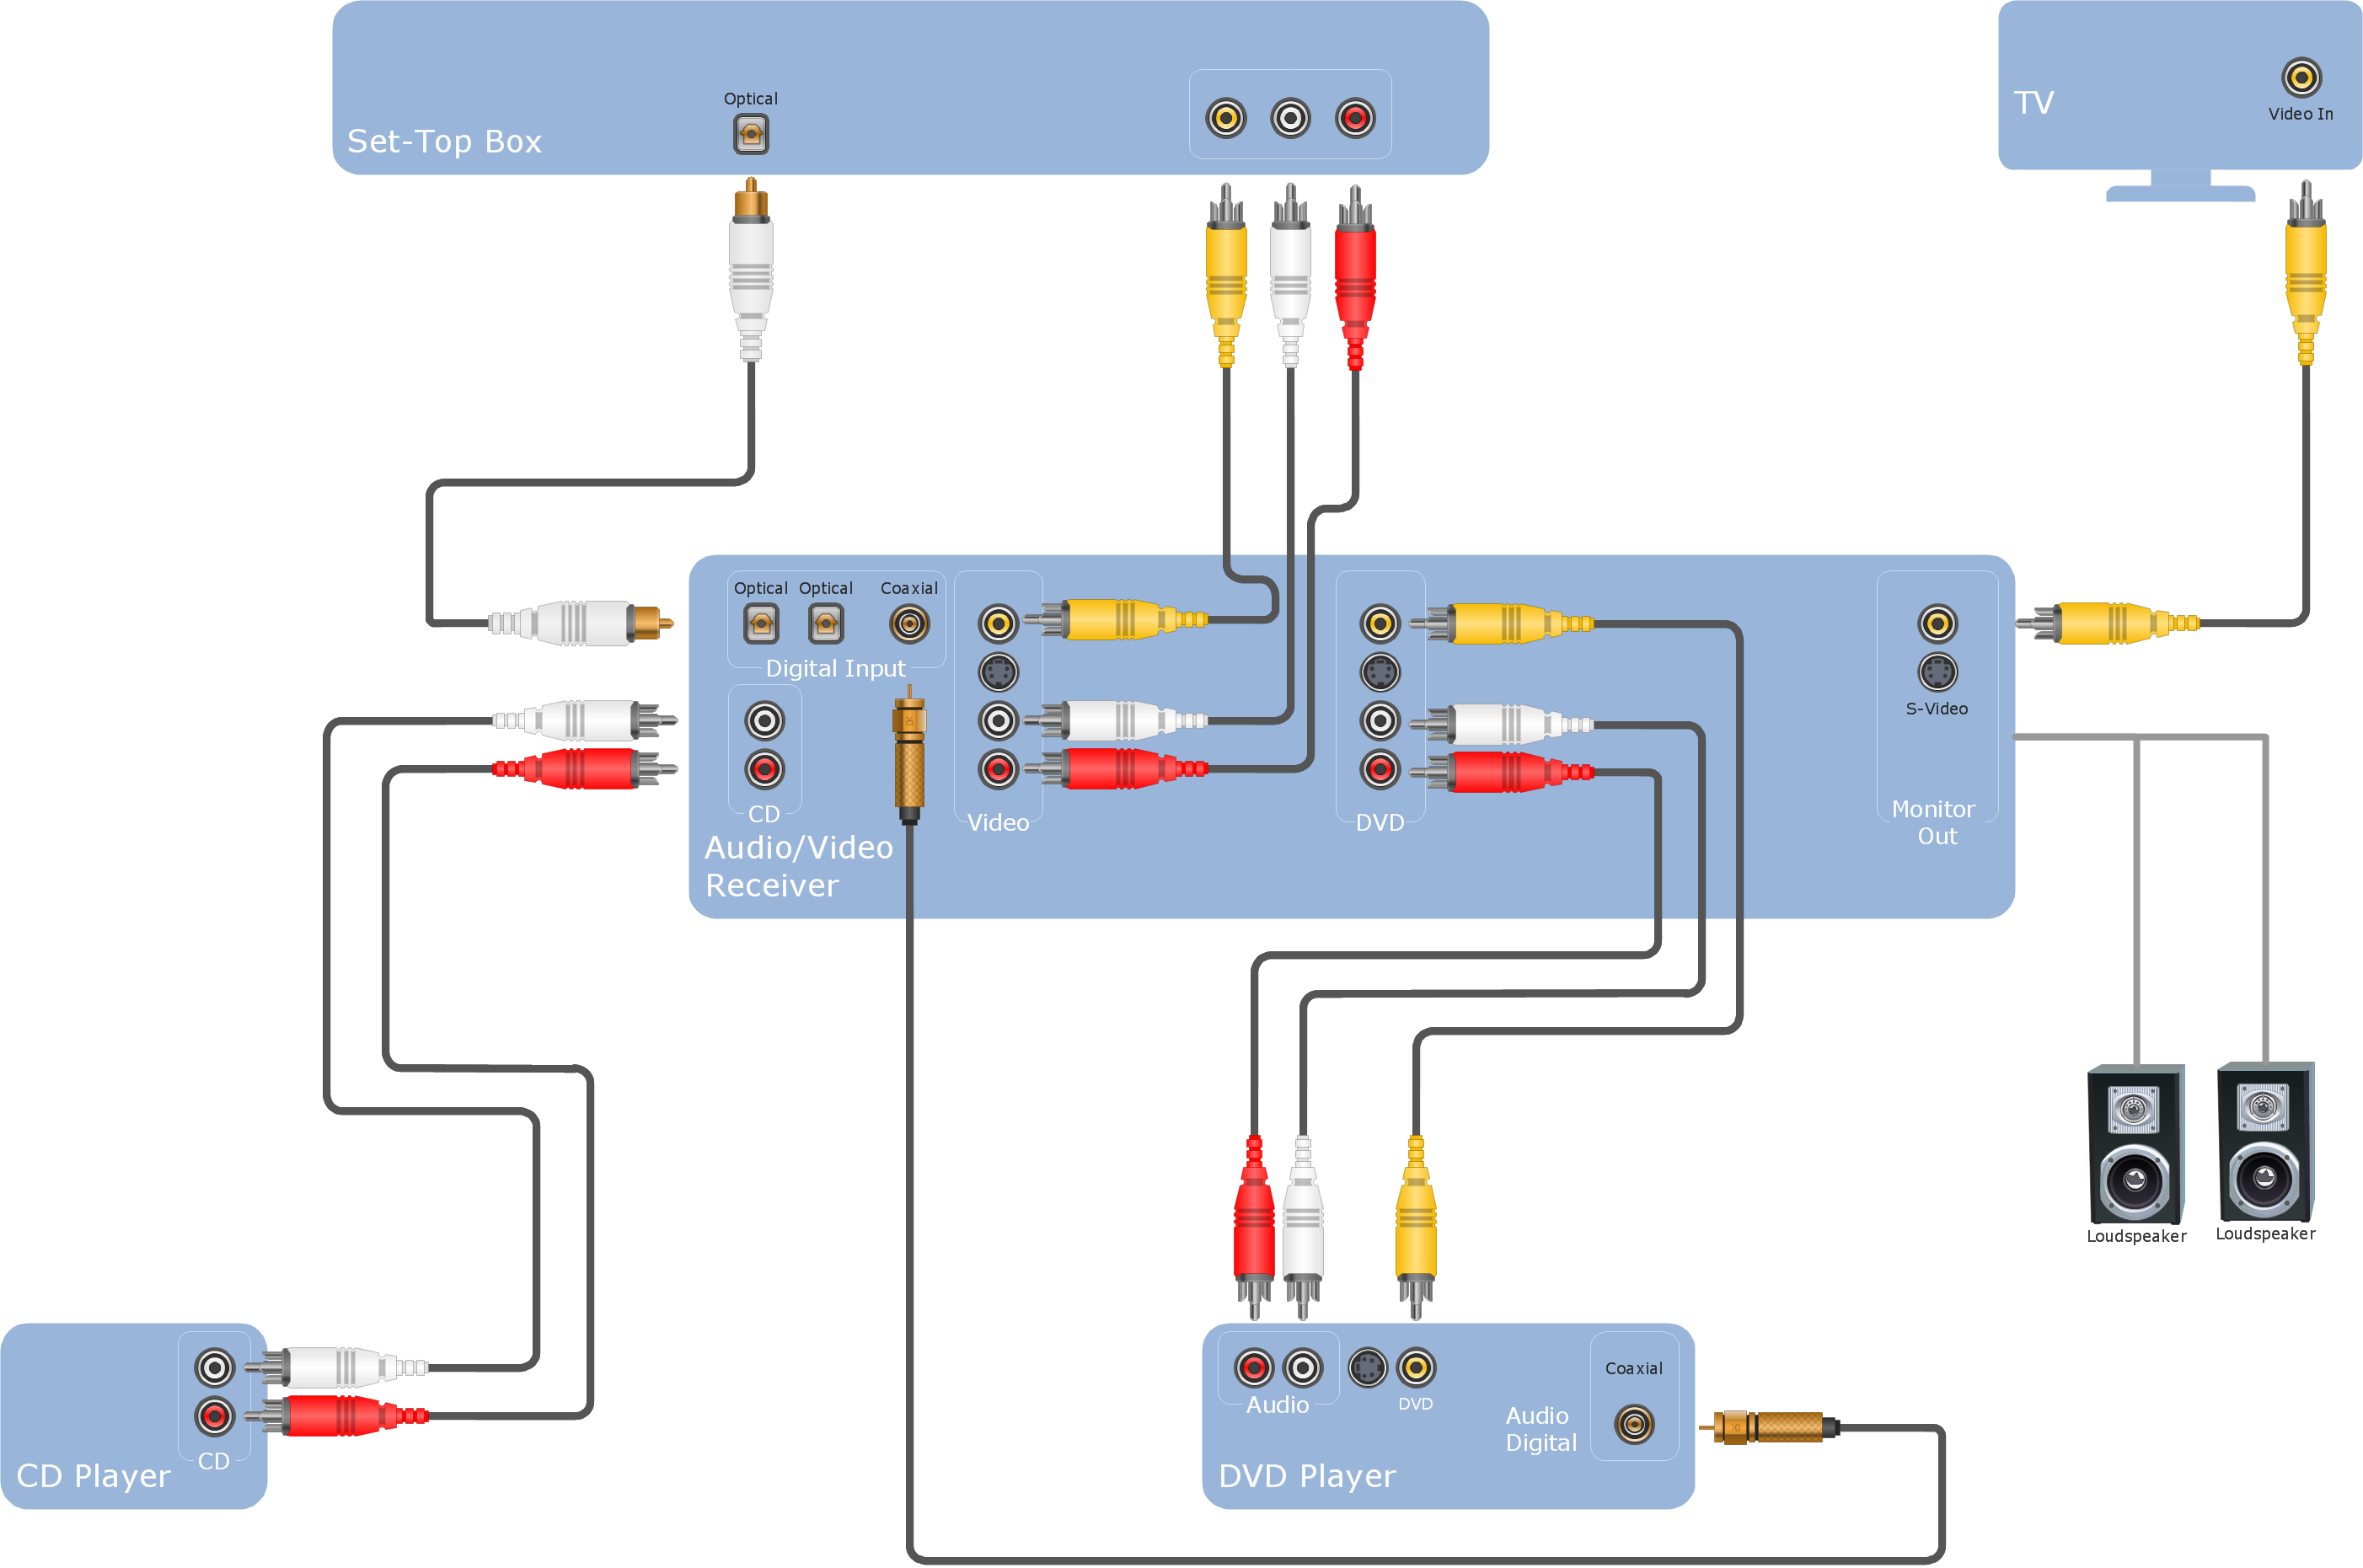
Sample 1. Hook up drawing - Stereo audio visual entertainment system.
ConceptDraw DIAGRAM diagramming software provides vector shapes and connector tools for quick and easy drawing diagrams for business, technology, science and education.
Use ConceptDraw DIAGRAM enhanced with solutions from ConceptDraw Solution Park to create diagrams to present and explain structures, process flows, logical relationships, networks, design schemes and other visually organized information and knowledge.
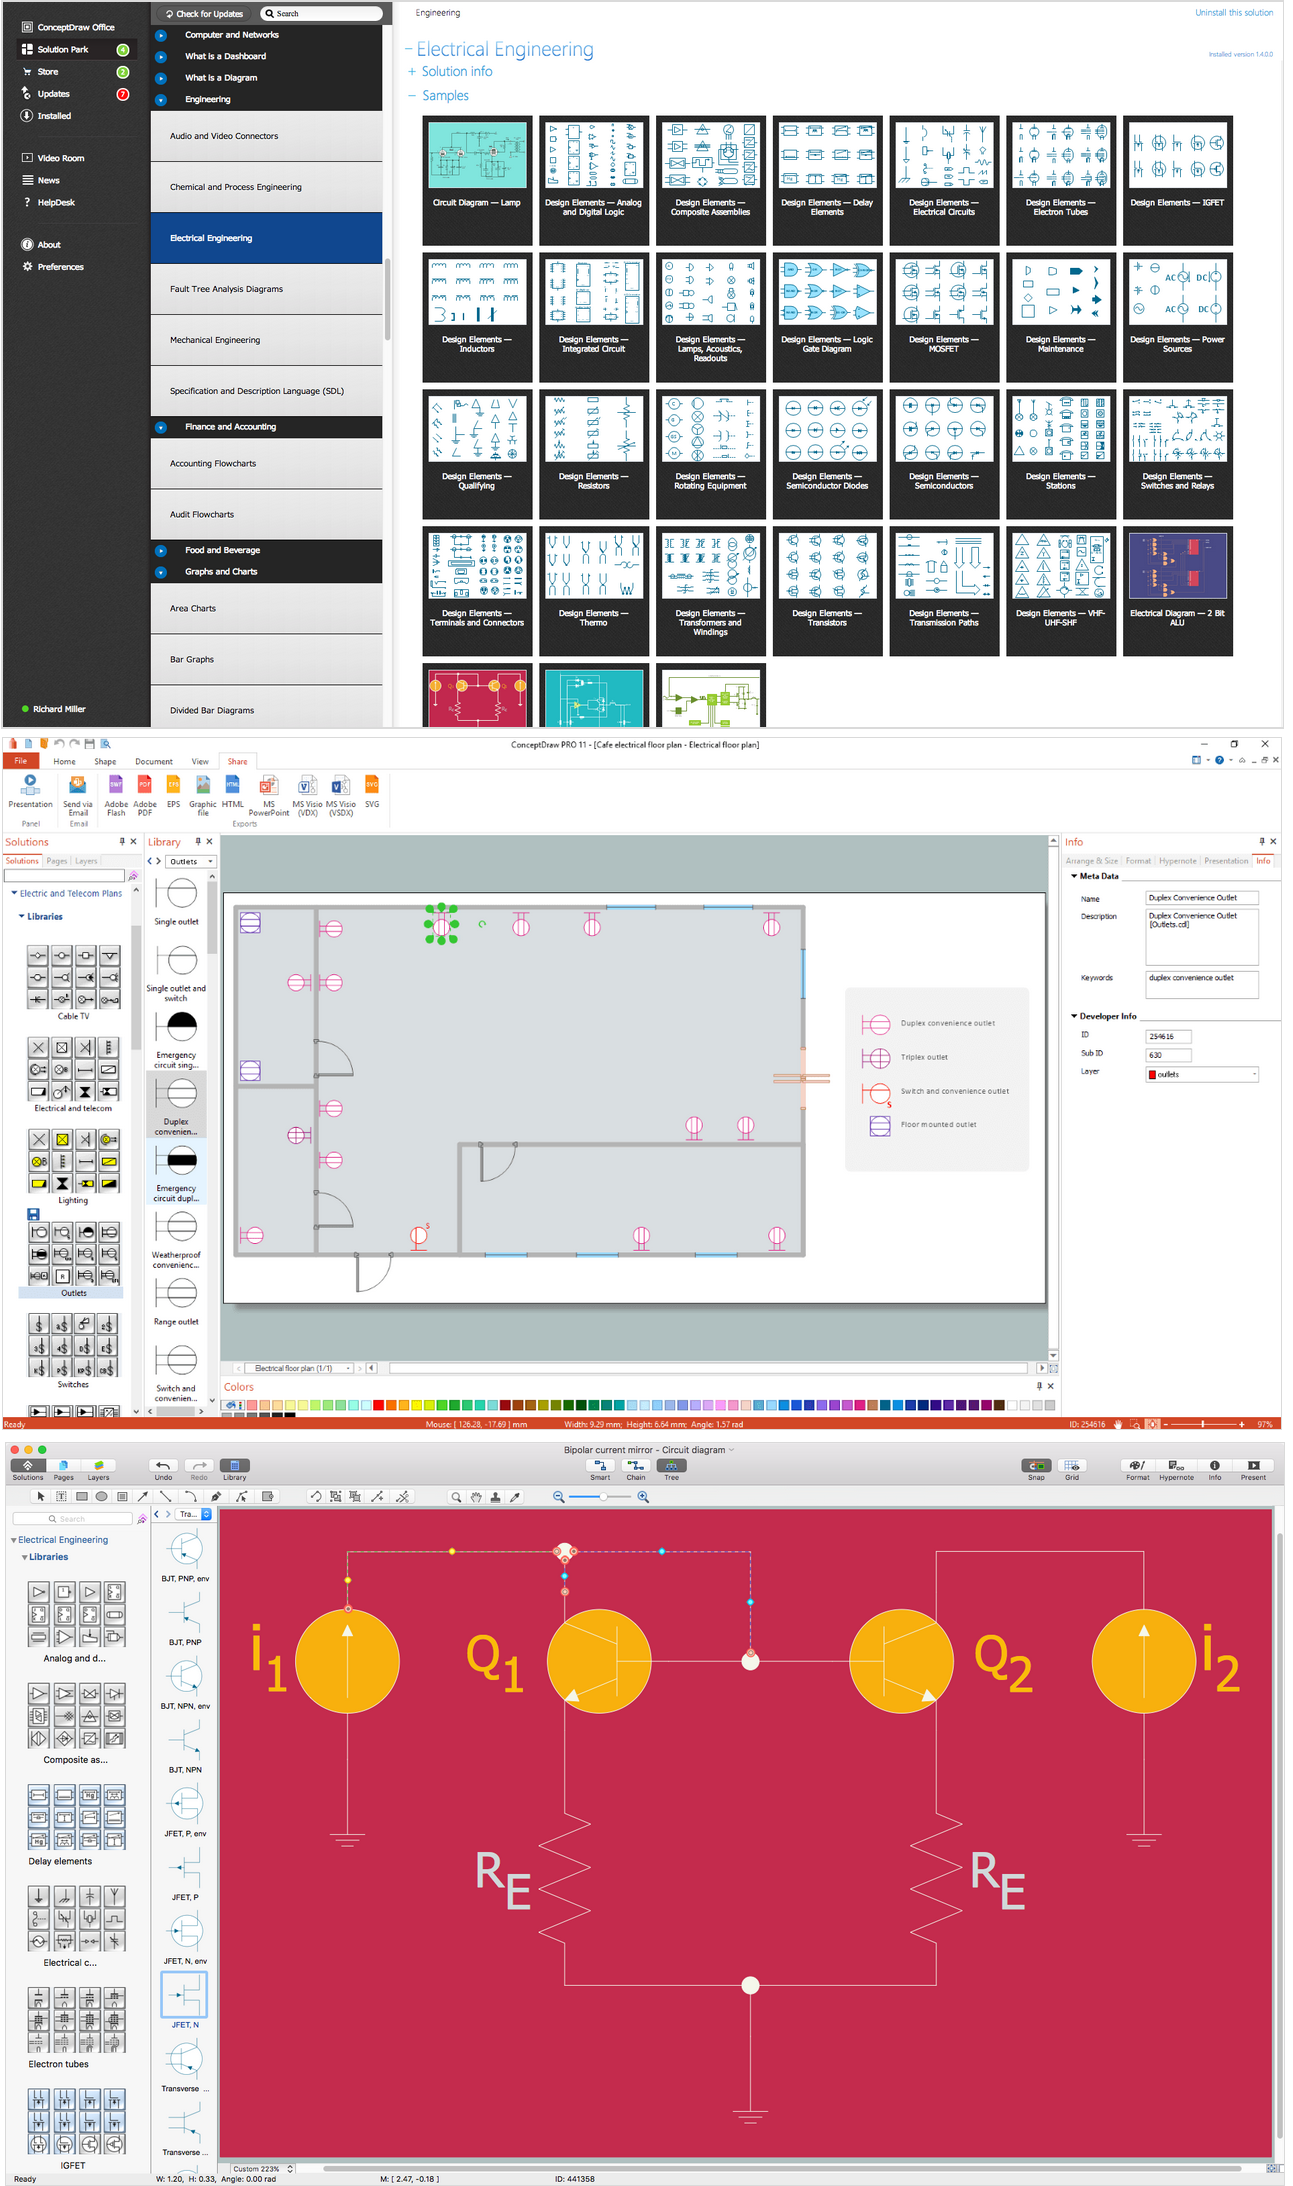
It is important to have an electrical circuits scheme, when you plan a renovation or move to a new apartment. You have to arrange interior according to that plan, and it’s trouble-free to create wiring diagrams with ConceptDraw DIAGRAM , furthermore, this software has all the features needed to create an interior plan as well. So, get inspired by tons of examples included to ConceptDraw DIAGRAM solutions, and start your diagramming experience!
A wiring diagrams, that are represented on this drawing was created to depict the components of the electrical circuit schemes. These diagrams are created to depict the information about circuit arrangements and connections. Wiring diagrams, in contrast to physical drawings, use standard symbol's notation to depict different circuit devices and connections. That is why, wiring diagrams are applied to discover and repair electrical and electronic circuits. The vector graphic objects provided by ConceptDraw Electrical Engineering solution can help any specialist in electric engineering to design electrical schemes, circuit and wiring plans, power systems charts, and Maintenance and Repair diagrams.
ER-modeling nowadays is a very popular approach for database design. If you are tired of looking for a good entity relationship diagram Software for Mac, then your search is almost over. ConceptDraw DIAGRAM is a great tool for creating diagrams of any complexity with tons of editable samples and templates.
This diagram represents the vector library of the Chen’s and Crow’s Foot notation icons for drawing ERD (entity-relationships diagram). ConceptDraw Entity Relationship Diagram solution delivers the ability to visualize databases structure on both Mac and PC. The "bricks" entity-relationships models are the entity, and the relation. An entity is represented by a rectangle comprising the entity name. It means an object, information about which should be available and stored. A relation is intended to show a relations between two entities. There are several types of relations between entities. To show there are a number of different symbols for the types of relationships.
Picture: Entity Relationship Diagram Software for Mac
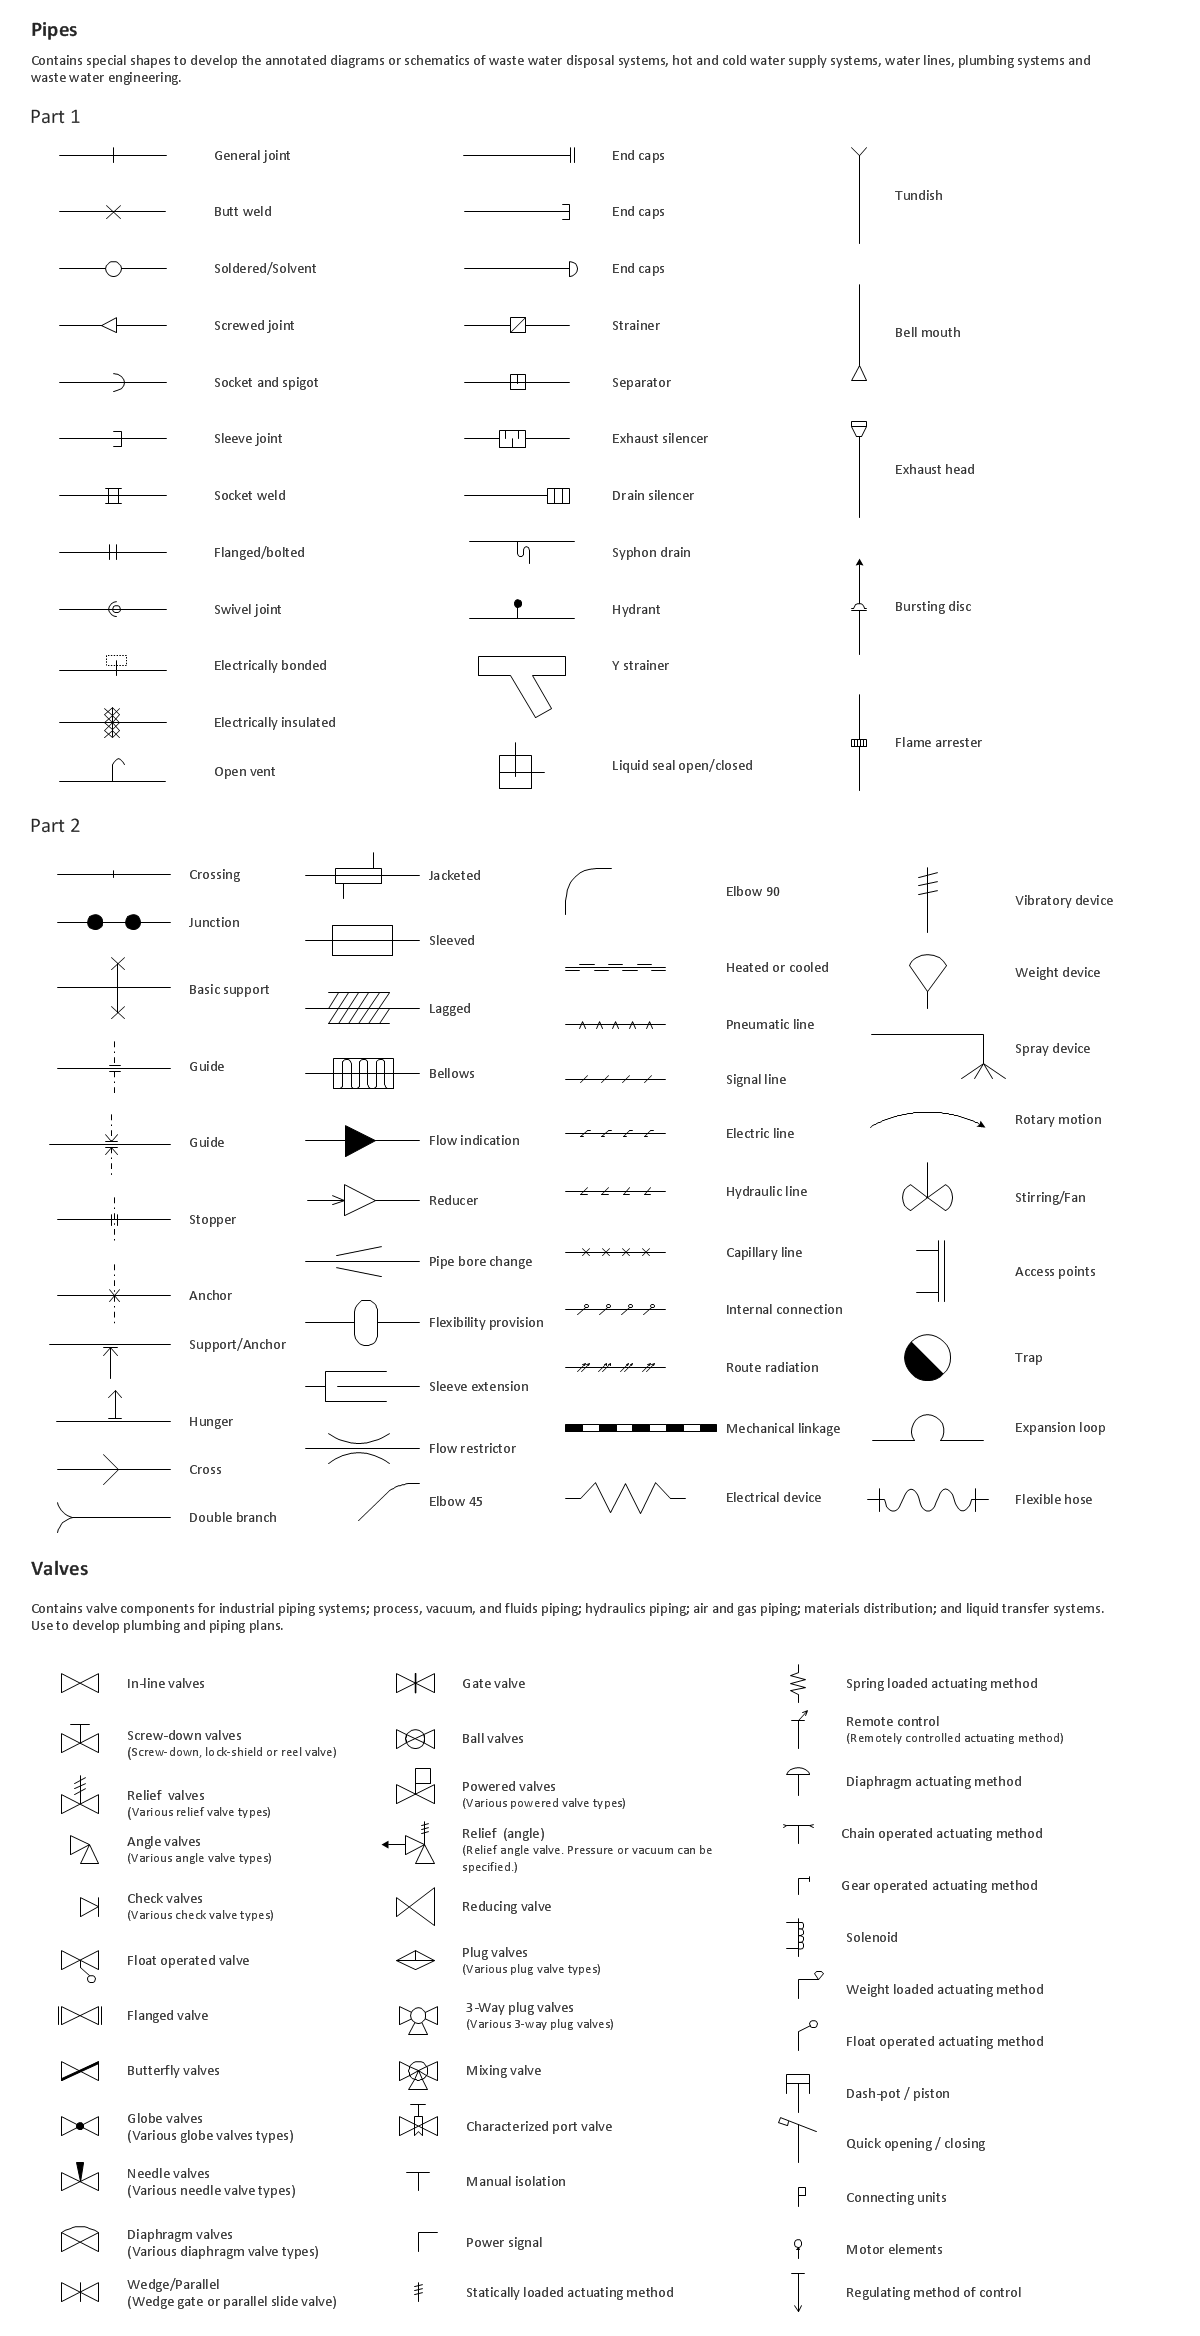
A technical drawing of a building is called an architectural drawing. According to a set of conventions, a building drawing includes a number of views, as well as unit measurements, scales, sheet sizes, cross referencing and annotation. Computer progress had a major impact of the methods of architectural drawing, making manual drawing almost obsolete. Digital drawing software, such as ConceptDraw DIAGRAM , offers a number of tools for each design element: piping plan, floor plan, etc.
Any building should have its plumbing and piping plans for every room, that has a water supply. Plans are applied to indicate arrangement of piping system in the building. This diagram presents a suite of standard piping icons for making building plans that include plumbing and piping layout. This diagram was designed using ConceptDraw solution for Piping and Plumbing planning. Using symbols is valuable for making a valid piping plan. Because any professional will properly interpreted such plan as a piece of technical documentation of a construction project.
Picture: Building Drawing. Design Element: Piping Plan
Perfect Network Diagramming Software with examples of LAN Diagrams. ConceptDraw Network Diagram is ideal for network engineers and network designers who need to draw Logical Network diagrams.
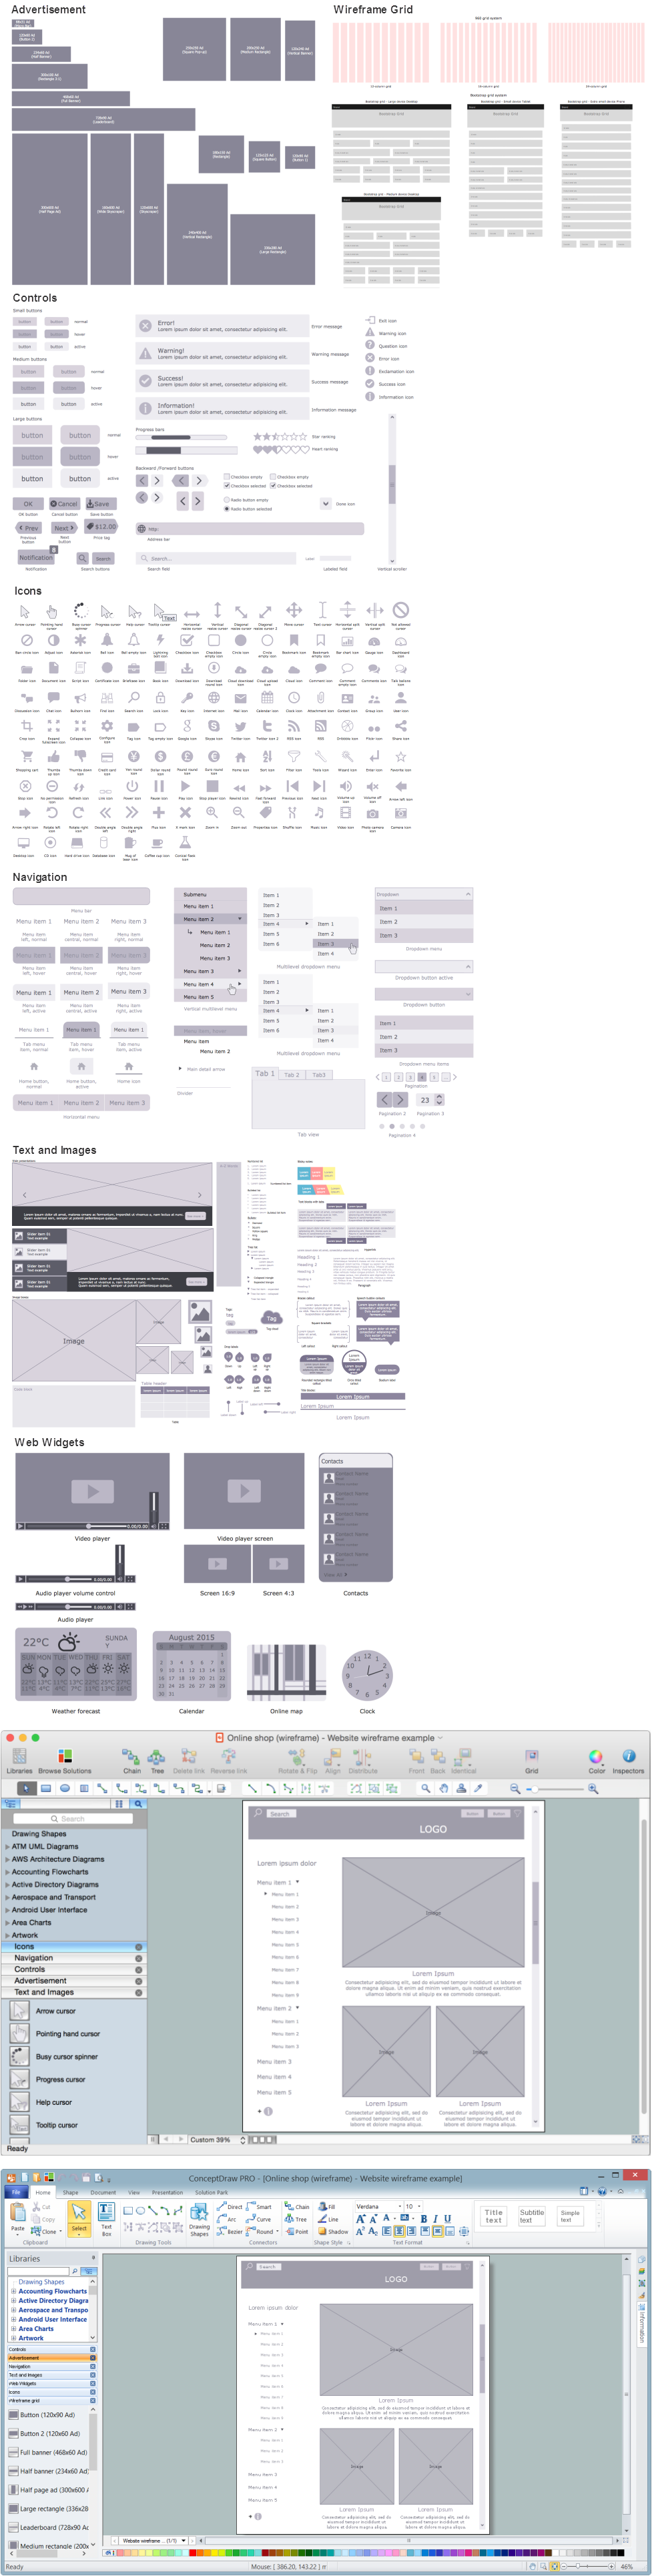
Website wireframes are convenient and widely used by developers, visual designers, business analysts, and many other people related with projection, development and promotion websites. Usually website wireframes look lacking of brilliance, but they effectively reflect website functionality, content and visually represent its skeletal framework.
ConceptDraw DIAGRAM software offers a unique Website Wireframe solution from the Software Development area with all needed tools for fast and easy drawing professional looking website wireframe with attractive interface design.
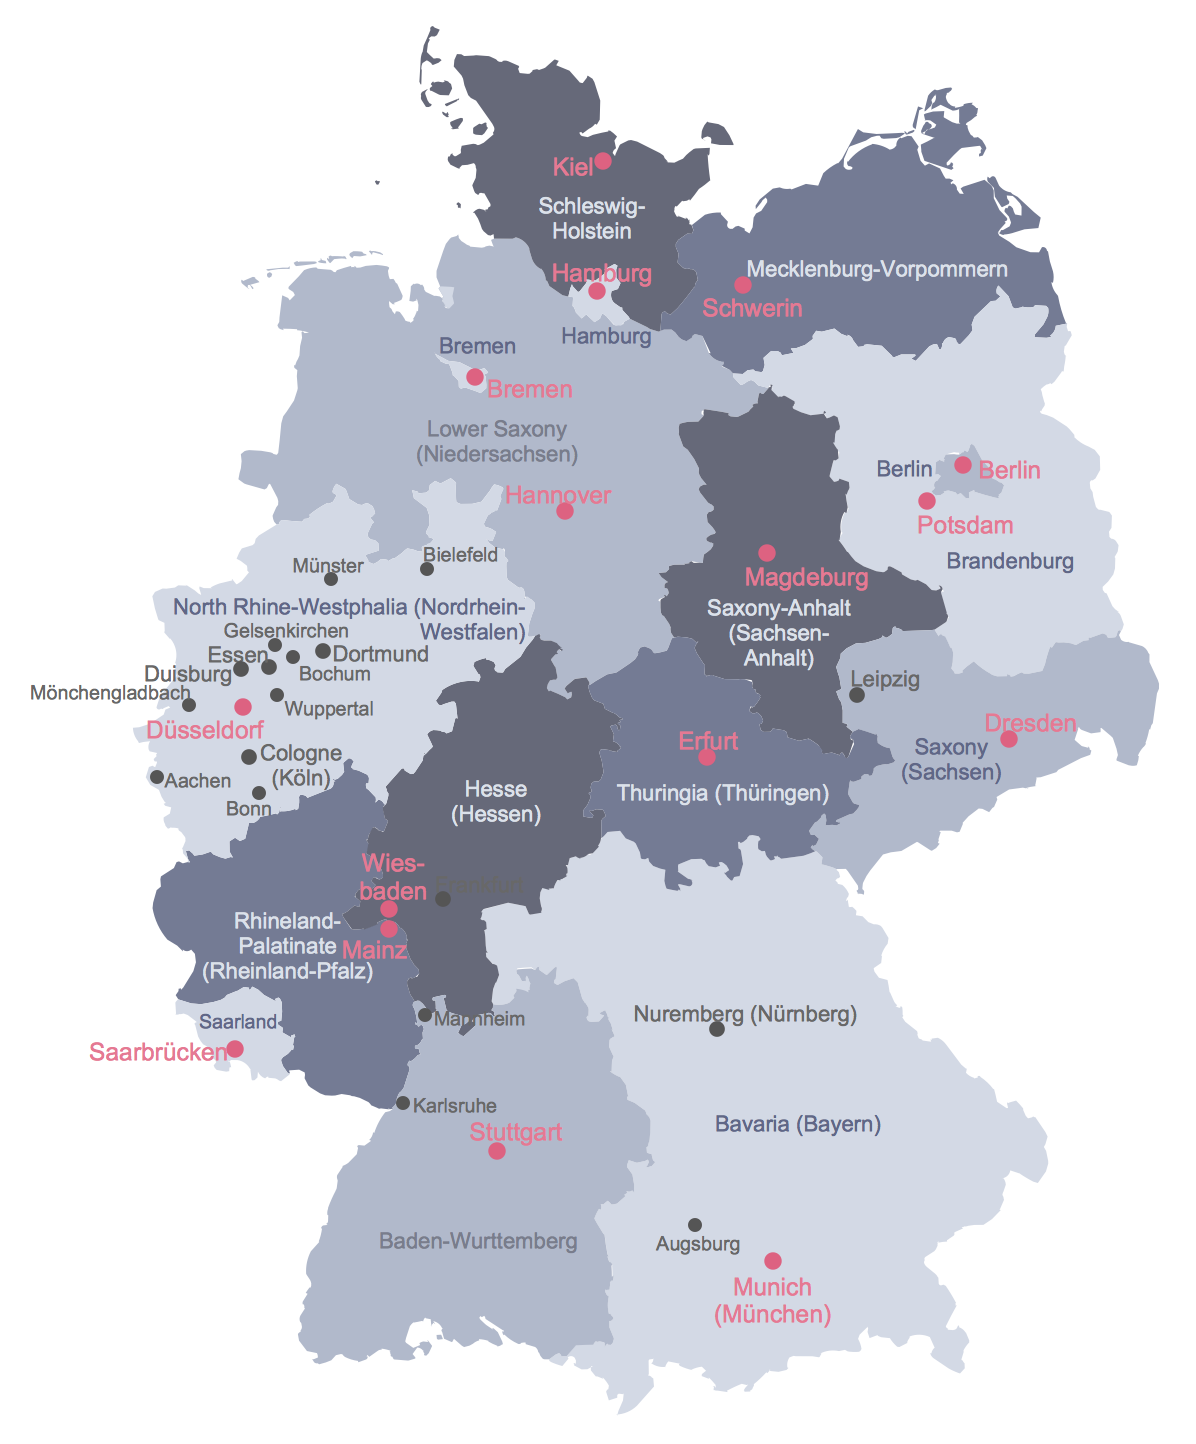
Germany, officially the Federal Republic of Germany, is a federal parliamentary republic in West-Central Europe. You need design the map of Germany or detailed map of Germany with cities fast and easy? We reccomend you to use the indispensable ConceptDraw DIAGRAM diagramming and vector drawing software extended with unique Germany Map Solution from the Maps Area of ConceptDraw Solution Park.
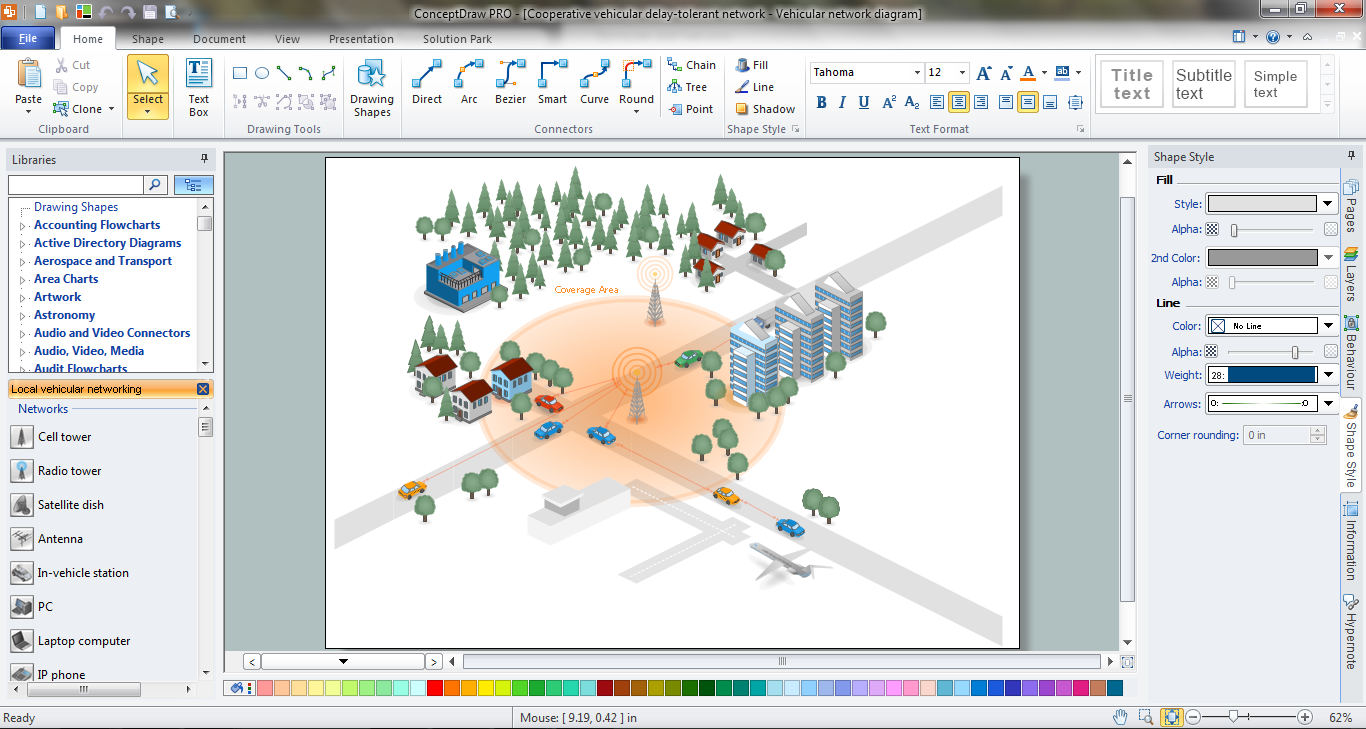
ConceptDraw DIAGRAM is a powerful Network Engineering software thanks to the Vehicular Networking Solution and many other networking solutions from the Computer and Networks Area of ConceptDraw Solution Park.
Electrical Engineering Solution used together with ConceptDraw DIAGRAM drawing facilities makes short a work of drawing various electrical and electronic circuit schemes. A library of vector objects composed from symbols of Analog and Digital Logic elements of electric circuit includes 40 symbolic images of logic gates, bistable switches of bi-stable electric current, circuit controllers, amplifiers, regulators, generators, etc. All of them can be applied in electronic circuit schemes for showing both analog and digital elements of the circuit.
Electrical Engineering Solution used together with ConceptDraw DIAGRAM drawing facilities makes short a work of drawing various electrical and electronic circuit schemes. A library of vector objects composed from symbols of Analog and Digital Logic elements of electric circuit includes 40 symbolic images of logic gates, bistable switches of bi-stable electric current, circuit controllers, amplifiers, regulators, generators, etc. All of them can be applied in electronic circuit schemes for showing both analog and digital elements of the circuit.
Picture:
Electrical Diagram Symbols F.A.Q.
How to Use Electrical ConceptDraw Diagram Software
ConceptDraw DIAGRAM is a chemistry drawing software that is ideal for designing of various: chemistry drawings, scientific and educational chemistry illustrations, schemes and diagrams of chemical and biological lab set-ups, images with chemical formulas