Good Flow Chart app for Mac
ConceptDraw DIAGRAM app.
The ConceptDraw DIAGRAM is a good flow chart app for Mac. Numerous vector stencils, samples and templates created by designers allows you to draw any type of flowchart. Flowcharts give to users the ability to represent structural data visually.

Sample 1. Flowchart sample: Product life cycle process.
This project management flowchart example visualizes product life cycle process.
See also Samples:
-
Flowcharts
- Orgcharts
- Business Charts — Area, Line and Scatter
- Marketing — Charts & Diagrams
- Quality and Manufacturing Charts
- Business Process Diagrams — Flow Charts
- Marketing — Flowcharts & Process Diagrams
- Business Diagrams — Concept Maps
- Business processes — Flow charts
- Marketing — Flowcharts and Process Diagrams
- Finance and Accounting
- Marketing — Social Media
- Business Diagrams
- Orgcharts
NINE RELATED HOW TO's:
Gantt Chart Templates - PM Easy Solution from the Project Management Area extends ConceptDraw PROJECT with the ability to quickly start a project. It lists task dependencies and relationships making the terative planning easy.
ConceptDraw PROJECT lets you the useful possibility to create visual project dashboards and diagrams, generate various kinds of reports with one click. It provides also extensive capabilities of importing and exporting in various formats: Microsoft Project, ConceptDraw MINDMAP , Mindjet MindManager, PDF file.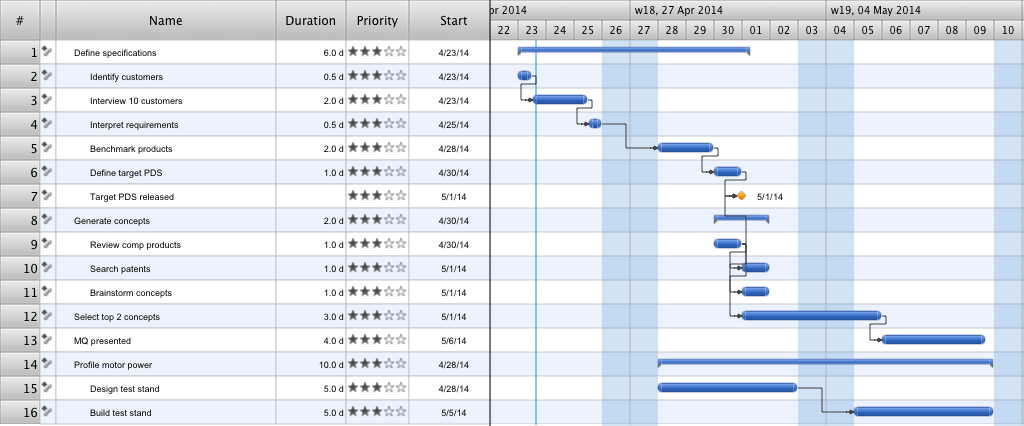
Picture: Gantt Chart Templates
Make diagrams, charts, workflows, flowcharts, org charts, project charts easily with ConceptDraw software.
Picture: Best Program to Make Diagrams
Related Solution:
The ConceptDraw DIAGRAM is a best flow chart tool for the job. The samples and templates included in the basic set allows users to draw any type of a flowchart. The vector stencils created by designers give ability to draw great-looking flowchart. Flowcharts give to users the ability to represent structural data visually.
Picture: Use the Best FlowChart Tool for the Job
Related Solution:
Start design your own flowchart with ConceptDraw DIAGRAM and accomplish great results at the moment.
Picture: Draw Flowcharts with ConceptDraw
Related Solution:
ConceptDraw DIAGRAM diagramming and vector drawing software extended with Sales Flowcharts solution from the Marketing area of ConceptDraw Solution Park offers the set of extensive tools for quick and easy drawing professional looking Sales Process Flowcharts.
Picture: Sales Process Flowcharts
Related Solution:
During the planning, discussing and execution of a project you may need to prepare a presentation using project views such as the Gantt Chart, Multiproject Dashboard or Resource Usage View. It’s easy do with ConceptDraw PROJECT!
Picture: How to Create Presentation of Your Project Gantt Chart
The Total Quality Management Diagram solution helps you and your organization visualize business and industrial processes. Create Total Quality Management diagrams for business process with ConceptDraw software.
Picture: TQM Diagram Example
Related Solution:
ConceptDraw PROJECT is simple project management software for planning projects, it include tools for planning project objectives. This type of project planning software intended for professional who use project terms daily. CoonceptDraw PROJECT can be used as customer project management software to keep on track on-site operations. It often used for planning marketing activity as marketing project management software, also it used as simple project management software for software development projects.
Picture: ConceptDraw PROJECT Project Management Software Tool
Users new to ConceptDraw PROJECT will find the Basic lessons an essential platform for familiarizing themselves with the program′s functions. Learn how to assign resources to tasks in ConceptDraw PROJECT with this comprehensive video lesson.
Picture: Project — Assigning Resources
Related Solutions:
ConceptDraw
DIAGRAM 18