Made with
ConceptDraw
DIAGRAM 18

Basketball Court Diagram and Basketball Positions

“The basketball court is the playing surface, consisting of a rectangular floor with tiles at either end. In professional or organized basketball, especially when played indoors, it is usually made out of a wood, often maple, and highly polished."[Wikipedia]

ConceptDraw DIAGRAM software extended with the Basketball solution from the Sport area of ConceptDraw Solution Park provides libraries, templates and samples allowing basketball specialists and fans to draw the professional looking diagrams and schemas of any complexity in a few minutes. It’s very convenient way to explain the different basketball tactics, positions and rules using the visual illustrations.

The "Basketball Courts" library from the Basketball solution contains the large quantity of various vector courts clipart.

Basketball Court Diagram and Basketball Positions *

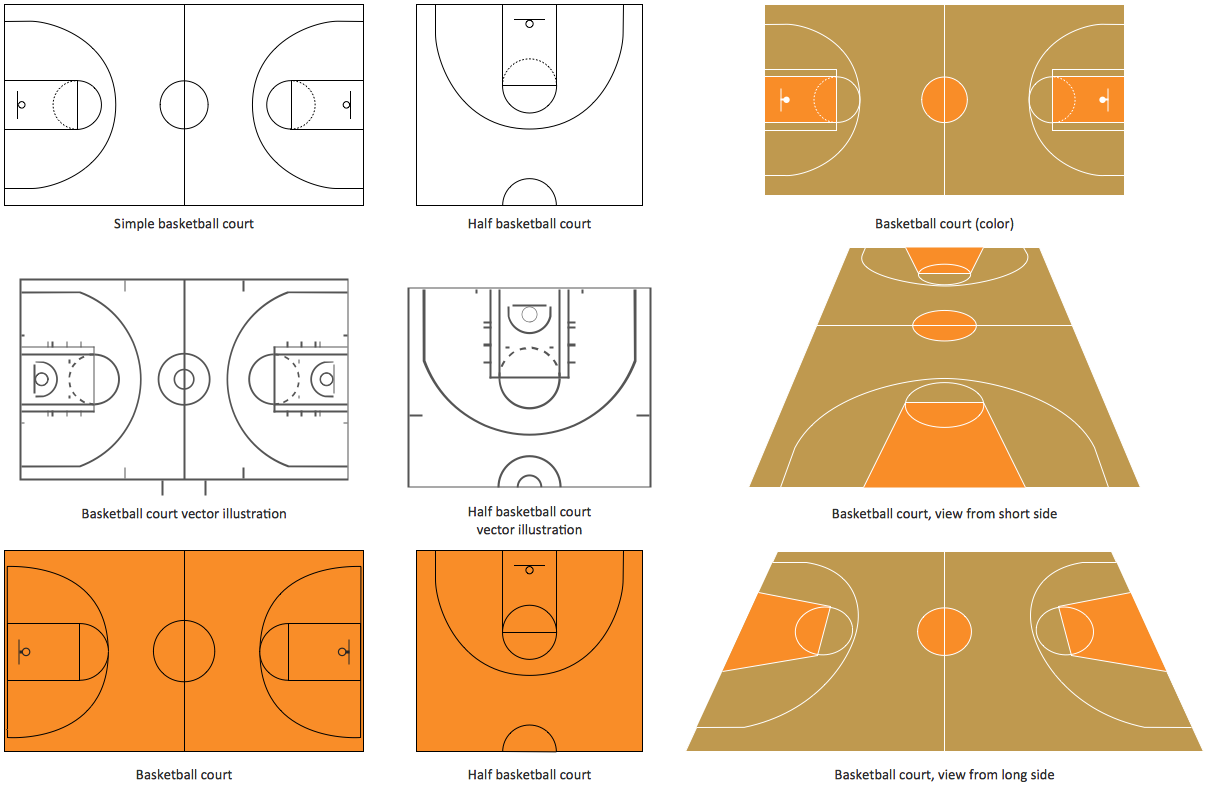
Sample 1. Design Elements – Basketball Courts

The "Basketball Positions" library contains a complete set of predesigned positions that you may need to create the basketball-related drawings.

Design Elements – Basketball Positions

Sample 2. Design Elements – Basketball Positions

“The three basketball positions normally employed by organized basketball teams are the guards, forwards, and the center. More specifically, they can be classified into the five positions: point guard (PG), shooting guard (SG), small forward (SF), power forward (PF), and center (C).
The point guard, also known as the one, is typically the team's best ball handler and passer. They are often quick and are able to hit shots either outside the three-point line or in the paint, largely depending on the player's skill level. Point guards are looked upon as the 'floor general' or the 'coach on the floor'. They should study the game and game film to be able to recognize the weaknesses of the defense, and the strengths of their own offense. They are responsible for directing plays. In the NBA, point guards usually range from 5' 11" (1.8 m) to 6' 4" (1.93 m).
The shooting guard, also known as the two, is usually one of the team's most versatile players, being bulky like the Forwards, yet fast like the Point Guard. Besides being able to shoot the ball, shooting guards tend to have good ball handling skills and the ability to drive the ball to the net, often creating their own shots off the dribble. In the NBA, shooting guards usually range from 6' 3" (1.91 m) to 6' 7" (2.01 m).
The small forward (SF) is known as the three. The small forward position is considered to be perhaps the most versatile of the main five basketball positions. Versatility is key for small forwards due to the nature of its role, which is sometimes similar to that of a power forward, but more often resembles the role of a shooting guard. Small forwards have a variety of assets, such as quickness and strength inside. In the NBA, small forwards usually range from 6' 6" (1.98 m) to 6' 10" (2.08 m).
Also known as the four position the power forward plays a role similar to that of the center, down in the "post" or "low blocks". On offense, they are often the team's most versatile traveler, being able to score close to the basket while also being able to shoot mid-range jump shots from 12 to 18 feet from the basket. On defense, they are required to have the strength to guard bigger players close to the basket, while having the athleticism to guard quick players away from the basket. In the NBA, power forwards usually range from 6' 8" (2.03 m) to 7' (2.13 m).
The center, also referred to as the "big man", "five" or the "pivot", usually plays near the baseline, close to the basket (referred to as the "low post"). The center is usually a key player in the game of basketball. It is usually the tallest player on the floor. The center usually scores "down low, in the paint" (near the basket, in the key), but some can be good perimeter shooters. When they are good perimeter shooters they are called "stretch bigs". They are typically skilled at gathering rebounds, contesting shots and setting screens on plays. The center position has been traditionally considered one of the most important positions, if not the most important. In the NBA, centers are usually 6' 10" (2.08 m) or taller. " [Wikipedia]

A combination of the "Basketball Courts" and "Basketball Positions" libraries from the Basketball solution gives you an ability to create the basketball illustrations quick and easy. For creating the diagram representing some basketball position, follow next steps:

  • Simply drag and drop the basketball court from the "Basketball Courts" library;
  • Drag the ready-to-use positions objects from the "Basketball Positions" library and place them on the court;
  • Add arrows or text labels if needed.
Man-to-Man Basketball Defense Drill

Sample 3. Man-to-Man Basketball Defense Drill

This diagram was created in ConceptDraw DIAGRAM using the "Basketball Courts" and "Basketball Positions" libraries from the Basketball solution and shows the basketball man-to-man defense drill. An experienced user spent 10 minutes creating this professional looking sample.

All source documents are vector graphic documents. They are available for reviewing, modifying, or converting to a variety of formats (PDF file, MS PowerPoint, MS Visio, and many other graphic formats) from the ConceptDraw STORE. The Basketball Solution is available for all ConceptDraw DIAGRAM or later users.


TEN RELATED HOW TO's:
When describing any computer network, we imagine a set of devices and nodes, arranged in some way. Talking about network structures, we should distinguish physical and logical network topologies, as physical topology is about devices location and logical topology illustrates data flow. In the same time, they do not have to match, and some devices, such as repeaters, may have a physical star layout, but a bus logical topology. There are two main types of computer network topologies: Physical topology that show the physical organization of a network - equipment and types of connections. Star network topology involves a set of devices that is connected to a single hub (router). Ring network topology means that, devices connected according this topology have two connections, connecting with nearby devices to make a loop. Bus network topology is the topology presented at the current diagram. It is similar to a ring topology. The difference is that data moves up and down a linear connection, copying itself where network equipment works as bus-stations along the way. This network topology can be used for small network, or when adding an extra device into a network.Network Topologies
Picture: Network Topologies
Related Solution:
If your company is in chaos in clutter and no one understands their rights and responsibilities, maybe it's time to change that. One of the ways to put the company in order is to draw an organization chart that would reflect the structure and show the relationships among departments and positions. This is a very useful and easy to understand scheme. This is example of the one of the most typical kind of organizational chart. It depicts an organizational structure of the hierarchical type. Its construction is similarv to pyramid. The single main position on the top - in this case, the mayor's position followed by sub-levels of authority in his command. Each position in the pyramid reports only to his supervisor, and takes only a report of direct subordinates. Such scheme limits the number of communications. This organizational structure is effectively used in public organizations. Also it is suitable for any organization with the need for multiple levels of middle managers. The ability to create organizational charts of different types is supplied with ConceptDraw Ogrcharts solutions.How to Draw an Organization Chart *
Picture: How to Draw an Organizational Chart
Related Solution:
This sample shows the Perceptual map. It was created in ConceptDraw DIAGRAM diagramming and vector drawing software using the Matrices Solution from the Marketing area of ConceptDraw Solution Park. Perception Mapping helps organizations measure and transform all aspects of their business, people and culture. Perception Mapping allows to represent the complex relationships graphically, helps identify potential problems of the organization and make the best decisions.Business Tools Perceptual Mapping *
Picture: Business Tools Perceptual Mapping
Related Solution:
ConceptDraw Network Drawing Software - Network design software for network drawings with abundant examples and templates. Create computer network designs, diagrams and schematics using ConceptDraw.Network Drawing Software *
Picture: Network Drawing Software
When deciding to start your own business, you have to take into account a bunch of different aspects. One of the ways to get inspired is to look through various restaurant floor plans samples or interior photos of already known establishments. This will help you, but keep in mind that a really unforgettable establishment must be unique. This restaurant floor plan diagram was designed using ConceptDraw Cafe and Restaurant Floor Plan solution. It can be used as a sample while considering a custom restaurant design. With the help of this example you can estimate the amount of furniture best for a dining room or kitchen of the restaurant. In addition, this plan would be useful as a check list when you will consider a list of the furniture and equipment needed for all areas of the future restaurant.Restaurant Floor Plans Samples
Picture: Restaurant Floor Plans Samples
Related Solution:
Of course it is possible to keep network records in text documents, but it is very difficult to use them later. A more sound way to keep such documentation is to create a network diagram that might represent either logical network structure or physical. These diagrams are easy to understand and you will thank yourself later. There is a physical network diagram. It is a tool to represent, maintain and analysis of network equipment and interconnections. Network diagram depicts the actual network information in the attractive clear graphic form. One can learn here the LAN cable length, telecommunication type and carrying capacity. The diagram depicts servers, IP address and domain name as well. Also it shows location of hubs, switches, modems, routers, and other network equipment. The sets of special symbols and images delivered with ConceptDraw Network Diagrams solution are used to show network components. Symbols have a standard view. Therefore, various specialists can read the network diagram without any discrepancies.Network diagrams with ConceptDraw DIAGRAM  *
Picture: Network diagrams with ConceptDraw DIAGRAM
Related Solution:
BPMN →
You need to draw professional looking BPMN diagrams quick and easy? Pay please your attention on ConceptDraw DIAGRAM diagramming and vector drawing software. Extended with Business Process Diagram Solution from the Business Processes Area it will be ideal for your.BPMN *
Picture: BPMN
Related Solution:
The first thing that usually comes to mind when talking about database models is ER-diagrams, and the ways to create them. The second most recognizable notation is the Crow’s Foot, which visually differs from Chen’s notation. Actually, it doesn’t matter which notation you’ll use for your entity relationship diagram (ERD), but the content is what matters. When designing an Entity-Relationship Diagram one need to use a certain notated symbols that were developed and standardized especially for databases description. First of them - the Chen’s notation had a linguistic origin. It includes rectangle boxes to show entities that may be described as nouns, and the relationships between them described as verbs depicted in a form of diamond. Finally the Chen’s notation was simplified up to the Crow’s Foot notation. It represents a relationship as labeled line. It is precisely this notation is shown in the given figure. ConceptDraw DIAGRAM together with its Entity-Relationship Diagram (ERD) solution is designed to support professionals who deals with creating ER diagrams using the element of both - Chen’s and Crow's Foot notations.Design Element: Crows Foot   <br>for Entity Relationship Diagram - ERD *
Picture: Design Element: Crows Foot for Entity Relationship Diagram - ERD
Related Solution:
Acquaintance with flowcharting starts from getting into basic terms. First of all, flowchart definition is quite clear – a flowchart is a graphical representation of a process or an algorithm made of special symbols. Secondly, flowcharting is an irreplaceable tool for IT specialists, project managers, and anyone who wants a clear understanding of any imaginable process.Flowchart Definition
Picture: Flowchart Definition: A Complete Guide
Related Solution:
If you are baseball coach or fan, you need convenient and useful software to design the baseball-related diagrams. In this case ConceptDraw DIAGRAM diagramming and vector drawing software is a real godsend for you!Infield Positioning for Baseball Situations
Picture: Infield Positioning for Baseball Situations
Related Solution:
ConceptDraw
DIAGRAM 18