PDPC
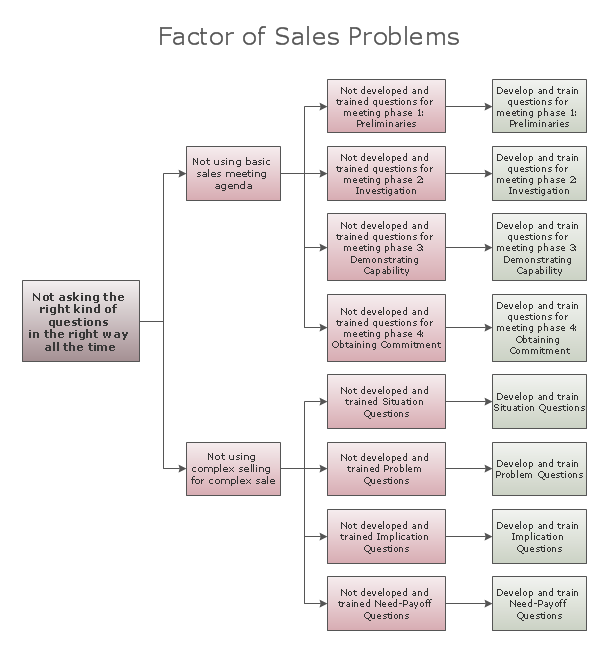
PDPC, or Process Decision Program Chart, is one of the popular techniques that was designed in order to help prepare the contingency plans. The main reason for using the PDPC is to create some appropriate contingency plans used for limiting the risks and to identify the consequential impact of failure on the activity plans. Planning tree diagrams as well as the process diagrams are known to be extended by a couple of levels. At the same time, the PDPC can be applied to all the bottom level tasks on those diagrams.
From the very bottom level of any of the activity boxes, the PDPC is known to be adding the levels in order to identify what can go wrong, to find out the consequences of that failure and the possible countermeasures.

Example 1. PDPC — Minimization of Material Wastage
Seven Management and Planning Tools Solution offers 5 stencil libraries that contain 45 vector objects. One of the stencil libraries is called as the “Design Elements — Involvement Matrix” having 20 vector shapes, another is a “Design Elements — Prioritization Matrix” having the 10 vector shapes.
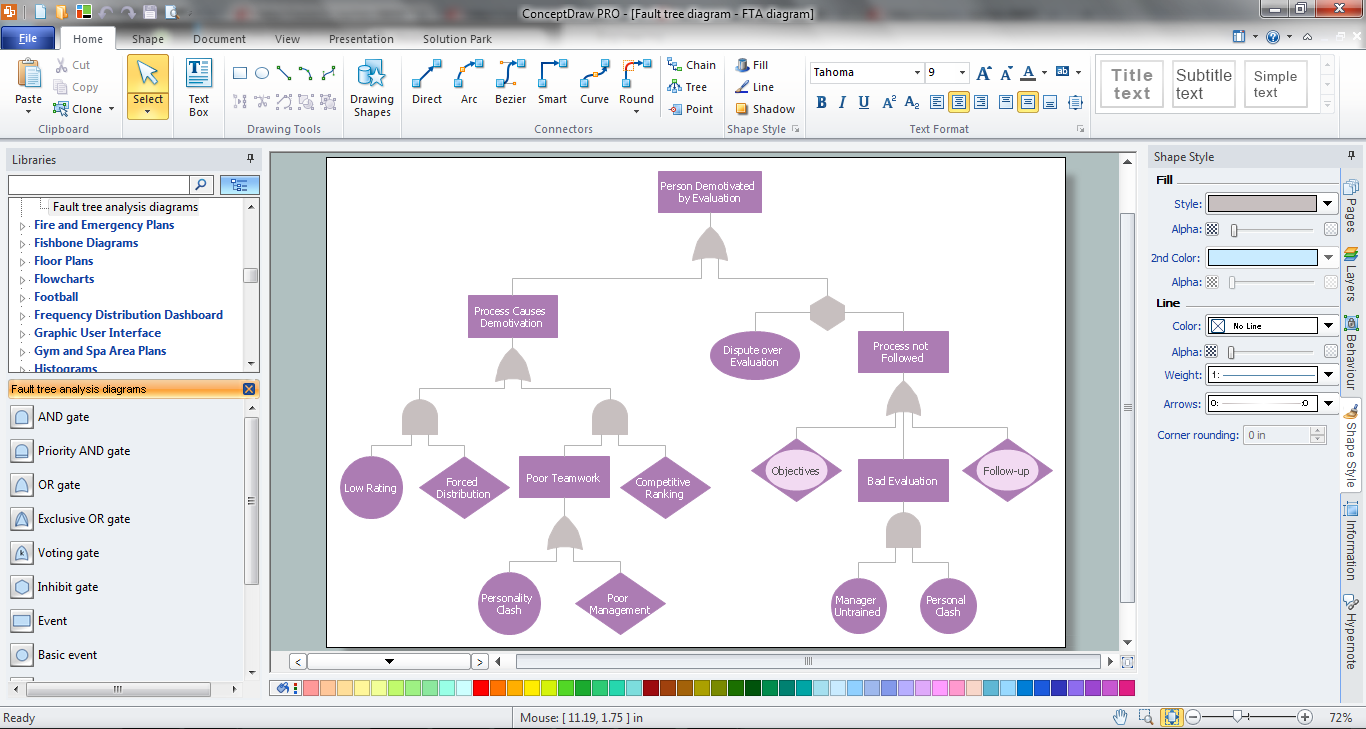
In order to make any needed diagrams from the Seven Management and Planning Tools, such as an Affinity Diagram, a Prioritization Matrix, a Root Cause Analysis Tree Diagram, an Involvement Matrix, a PERT Chart, a Risk Diagram (PDPC) or/and the Relations Diagram, you can simply download ConceptDraw DIAGRAM diagramming and drawing application from this site as well as a ConceptDraw STORE one to get a great looking result within only a few minutes by editing the already pre-made templates that are all available in the previously mentioned solution.

Example 2. Seven Management and Planning Tools Solution in ConceptDraw STORE
In order to identify what can go wrong during any business activity, the risks have to be evaluated. Any risk is known to be the potential of losing or gaining something of a value that can be a physical health, an emotional well-being, a financial wealth and/or a social status. Any value can be either lost or gained while taking a risk. It may result from an inaction or a given action, foreseen or unforeseen meaning planned or unplanned risk that can also be defined as the intentional interaction with some uncertainty. The mentioned uncertainty can be some uncontrollable, unpredictable potential outcome. And any risk is a consequence of an action taken in spite of any uncertainty.
Risk perception is known to be the subjective judgment that people make about the probability as well as a severity of a risk. It may vary person to person. Any human activity, including the business one, always carries some risk, but some of them are much riskier than others. To be able to cope with the risk as a challenge for any organization, business activity such as a project, etc., it is important to know some basics about risk management as it is the process of an assessment done after the identification of the risks.
Risk management also includes a prioritization of the previously identified and assessed risks followed by an economical and coordinated application of resources. It should be done in order to monitor, to control and to possibly minimize any impact or probability of some unfortunate events as well as to maximize the realization of all the given opportunities. Risk management’s main objective is to assure that any uncertainty does not deflect the endeavor from the main business objectives and goals.
 Library Design Elements")
Example 3. Risk Diagram (PDPC) Library Design Elements
Risks are known to be coming from many different sources, such as an uncertainty in the financial markets, some threats from the project failures that can appear at any phase in development, design, sustainment life-cycles, production, legal liabilities, credit risk, natural causes, natural disasters, accidents, deliberate attack from an adversary, or events of unpredictable or uncertain root-cause. There are two types of events: for instance, the negative events can be classified as risks when positive ones can be classified as opportunities.
There are a few risk management standards that have been developed. They include the ISO standards, the National Institute of Standards and Technology, the Project Management Institute and the actuarial societies. Different methods, goals and definitions may vary according to whether the risk management method is in the context of security, engineering, industrial processes, project management, public health and safety issues, financial portfolios or actuarial assessments.
Making a risk diagram, or PDPC, may help illustrate some potential threats some organization is at a risk to face and so to help solve such problems. In case such drawings should be made within a short period of time, the ConceptDraw DIAGRAM diagramming and drawing application can be very useful as well as the ConceptDraw STORE one where the Seven Management and Planning Tools Solution may be found offering the pre-made design elements as well as the layouts for making the professionally looking and smart looking diagrams.

Example 4. PDPC — Personal Activity
There are many different strategies that are all used for managing the threats meaning the uncertainties with some negative consequences. The mentioned strategies may include reducing the probability of the threats, the negative effects, avoiding the threats, transferring a part or all the threat to some another party, and/or even retaining all or some of the potential or some actual consequences of some particular threats and the opposites for opportunities.