This template of TQM Diagram is contained in the "Total Quality Management (TQM) Diagrams" solution located in the ConceptDraw Solution Park. It helps you to draw TQM diagrams using ConceptDraw DIAGRAM diagramming software quickly and easily.
This TQM flowchart template explains the meanings of the TQM design elements.
TEN RELATED HOW TO's:
Everything about Bookkeeping: Accounting flowchart process. Which symbols to use, how to make a chart.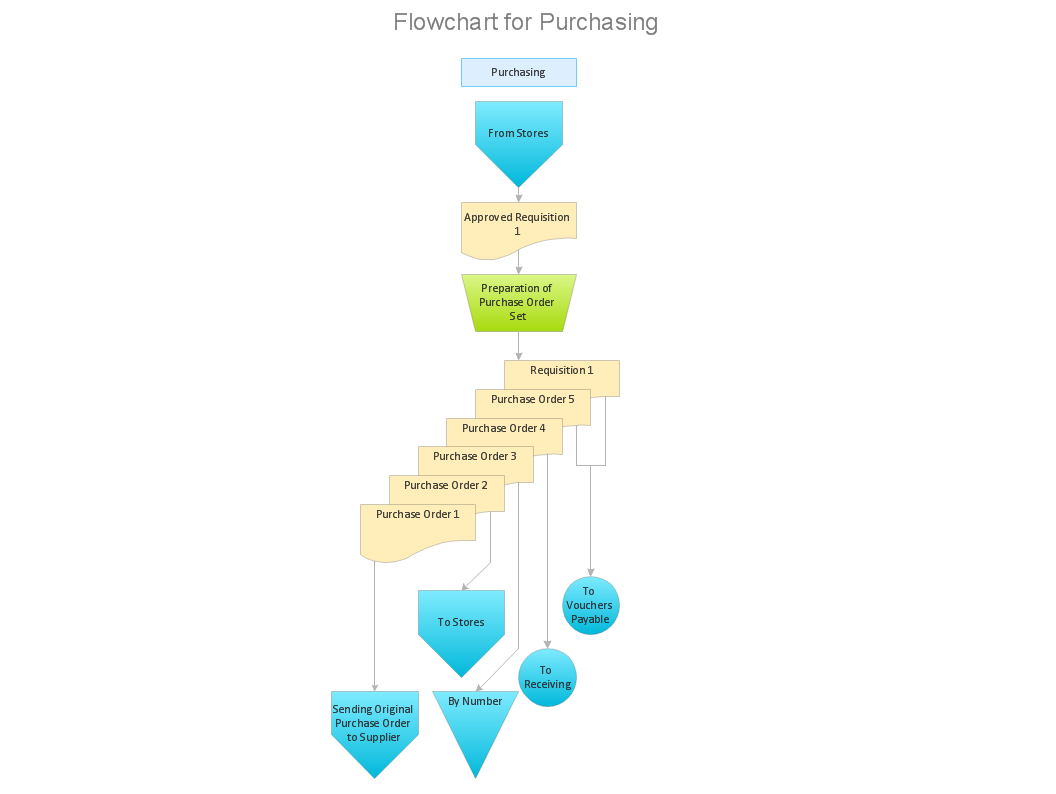
Picture: Introduction to bookkeeping: Accounting flowchart process
Related Solution:
Risk Positioning Diagram - This sample was created in ConceptDraw DIAGRAM diagramming and vector drawing software using the Seven Management and Planning Tools Solution from the Business Productivity area of ConceptDraw Solution Park.
This sample shows the Risk positioning diagram. There are visually displayed problems and solutions near them. You can view and analyze the causations and solutions.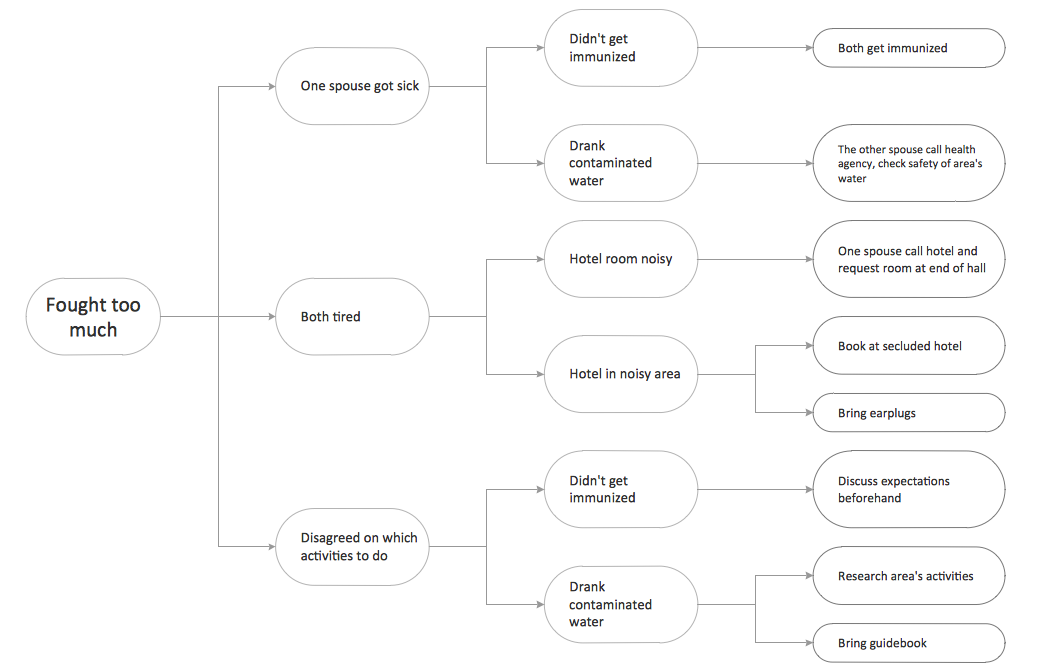
Picture: Risk Positioning Diagram
Related Solution:
Organizing and Selecting Social Media Response Messages.
Interactive Flowcharts can change the way one creates and organizes their social media response process.
Picture: What is Interactive Flowcharts
Related Solution:
ConceptDraw DIAGRAM diagramming and vector drawing software offers the Fault Tree Analysis Diagrams Solution from the Industrial Engineering Area of ConceptDraw Solution Park for quick and easy creating the Fault Tree Diagram of any degree of detailing.
Picture: Fault Tree Diagram
Related Solution:
ConceptDraw DIAGRAM diagramming and vector drawing software offers a powerful Seven Basic Tools of Quality solution from the Quality area of ConceptDraw Solution Park which contains a set of useful tools for easy drawing Flow Chart of any complexity.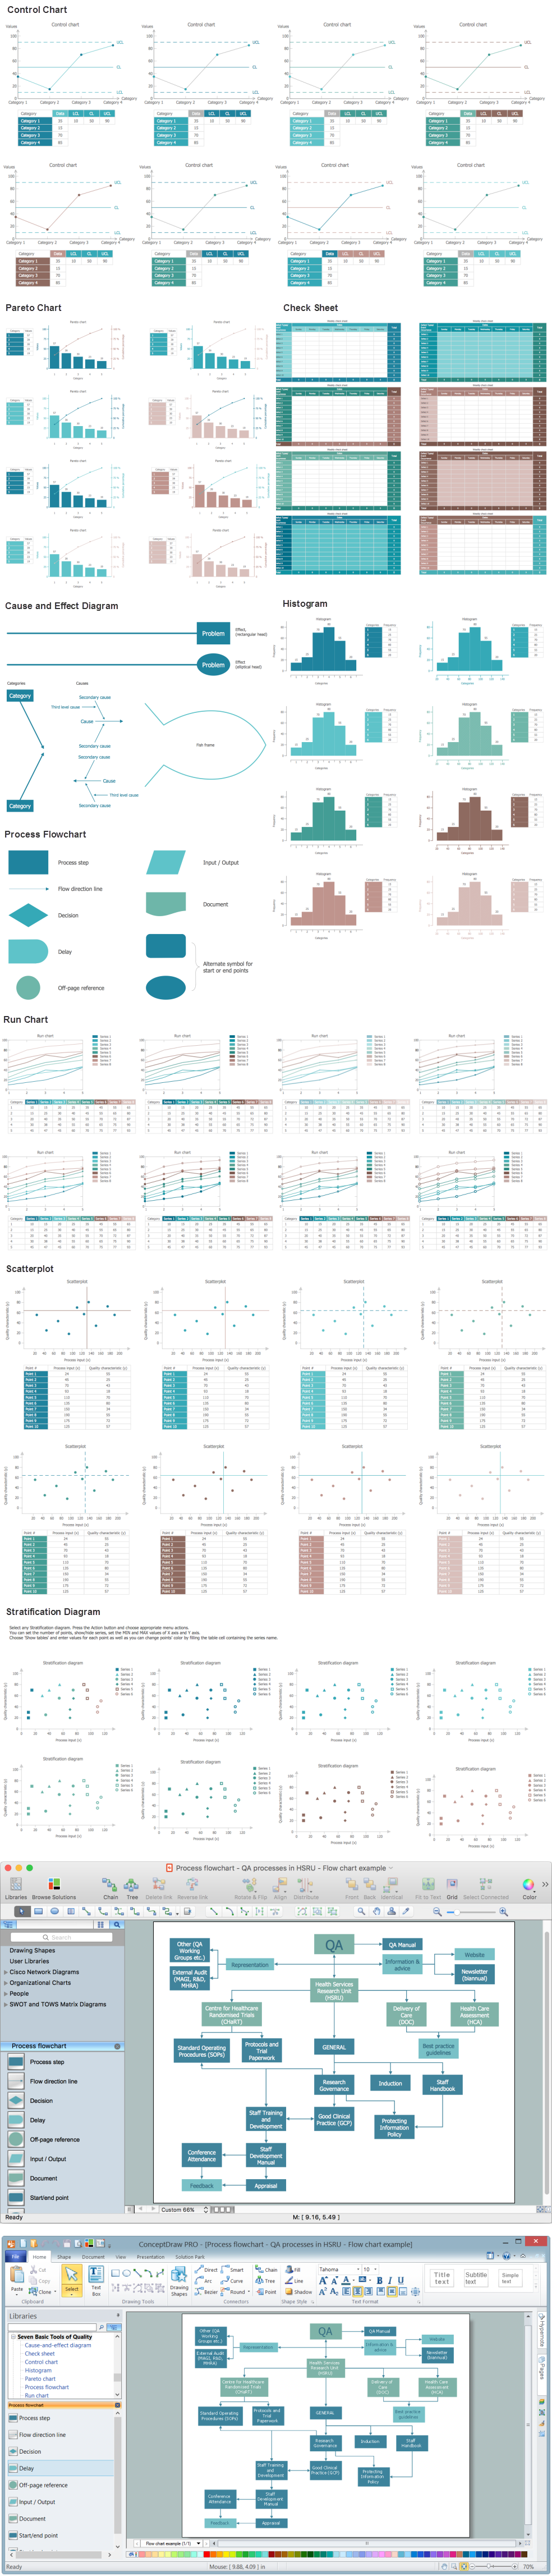
Picture: Seven Basic Tools of Quality - Flow Chart
Related Solution:
Process Flow Charts are very popular and widely used in chemical and process engineering for representation a general flow of plant processes and equipment. If you need often draw them, the ConceptDraw DIAGRAM diagramming and vector drawing software extended with tools of Flowcharts Solution will be useful for you.
The mostly used set of process flow chart symbols includes the following: Rectangle (box) process flow chart symbol, Rounded rectangle, Circle, Diamond.
Picture: Process Flow Chart Symbol
Related Solution:
ConceptDraw DIAGRAM is a powerful intelligent vector graphics engine that can be used to create basic diagrams including flowcharts, charts, workflows, flowcharts, organizational charts, business diagram, learn business diagrams, flow diagrams.
Picture: The Best Mac Software for Diagramming or Drawing
Related Solution:
The Involvement Matrix can identify the distribution of responsibilities and identify roles in a group or team. Use the Involvement Matrix to specify roles and responsibilities of actions in problem solving.
ConceptDraw Office suite is a software for corrective actions planning.
Picture: CORRECTIVE ACTIONS PLANNING. Involvement Matrix
Unified Modeling Language (UML) is a visual modeling language in the field of software engineering. It is an open standard that provides the graphic notations for creating the visual models of object-oriented software systems. UML took in the notations of the Object-modeling technique, Object-oriented software engineering and the Booch method.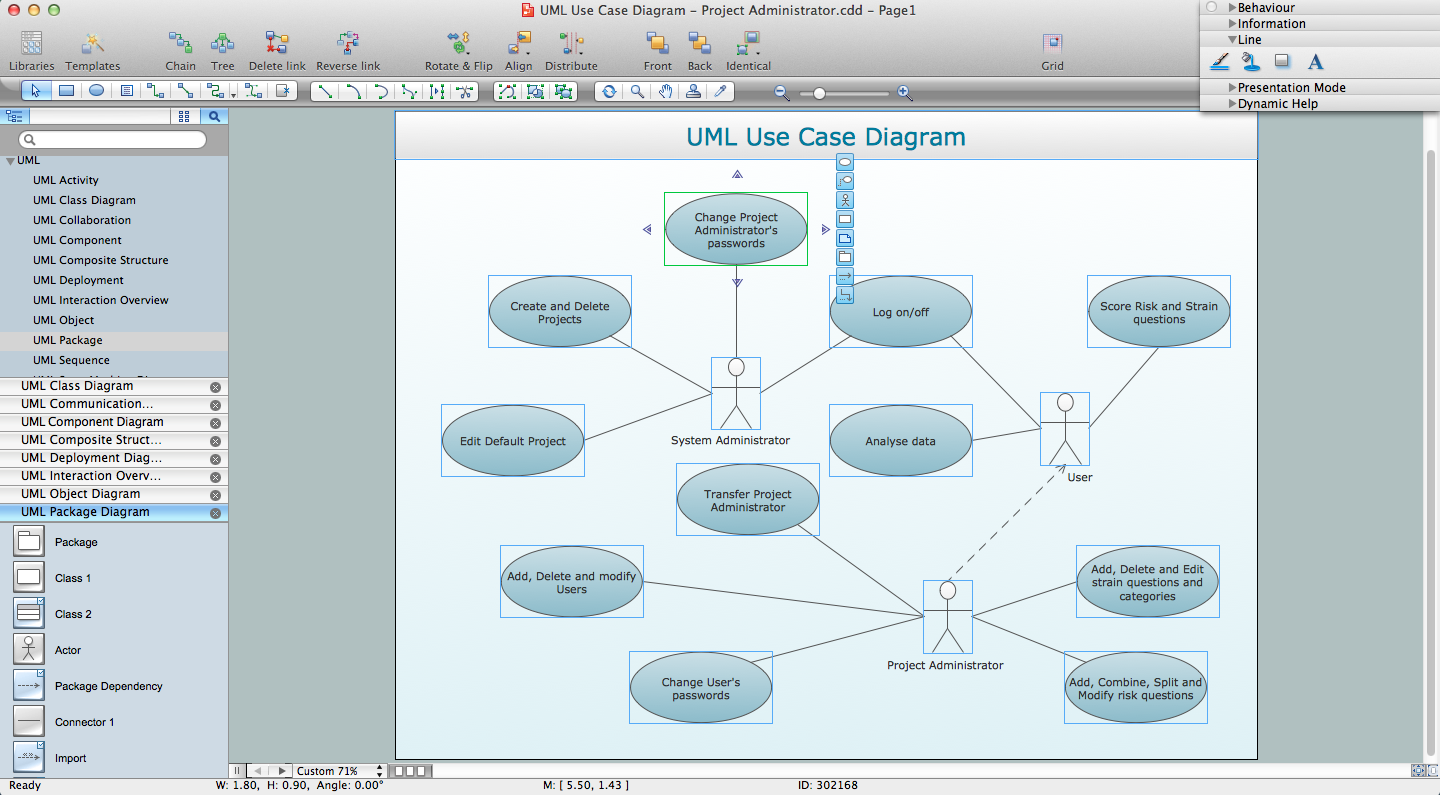
Picture: UML for Software Engineers
Related Solution:
ConceptDraw MINDMAP is a fundamental tool in quality management to describe visual instructions on any process.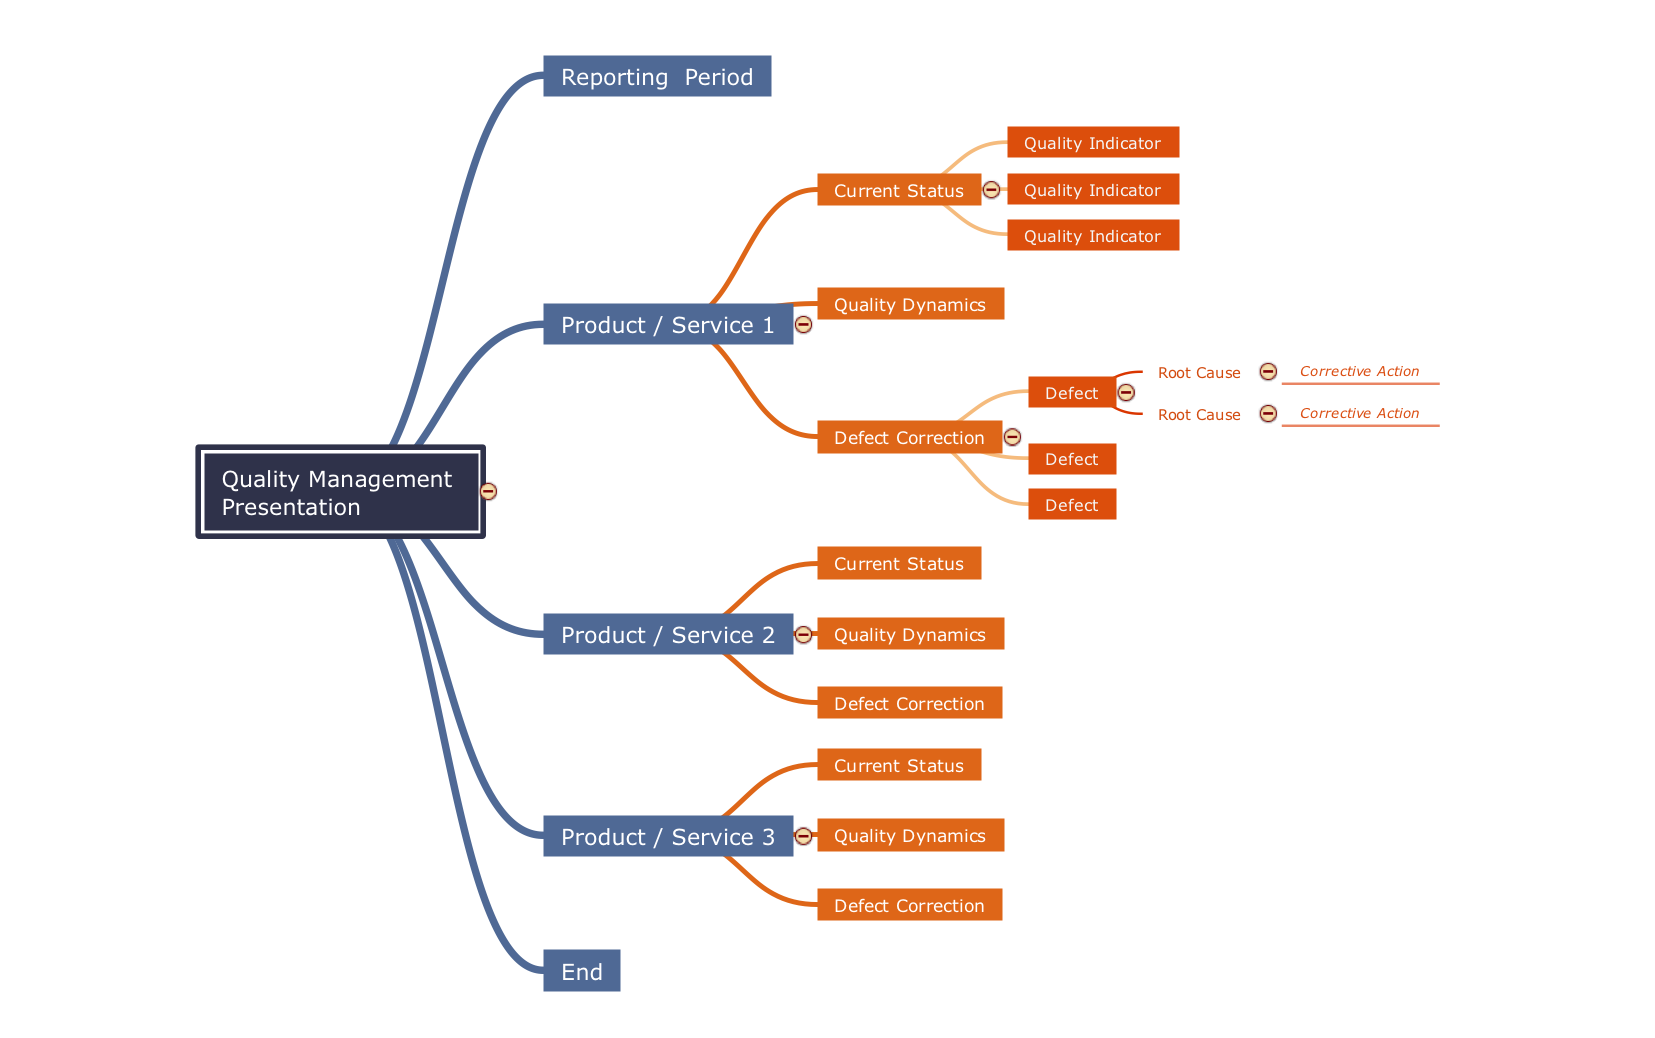
Picture: Fundamental Tool in Quality Management
Related Solution:
