Ice Hockey Rink Diagram
All ice hockey players use the ice hockey rink to play their favorite game on it and its dimensions have to meet the general requirements of the ice hockey game rules, otherwise, this game cannot be called professional and it cannot be played on a professional level. The game of ice hockey itself is a competing sport, which is very popular nowadays, especially among many Canadian people.
The ice hockey rink is rectangular with rounded corners and surrounded by a wall of 1 meter high. This wall is there to protect all of the ice hockey fans from getting injured by the ice hockey puck while watching the ice hockey game. In ice hockey, this wall is called the “boards”.
Visual Guide to Ice Hockey Rinks: Dimensions and Zones
There are a couple of distinctions in the ice hockey rules about the ice hockey rink dimensions and other nuances. The first ice hockey rink dimensions rules are known as “Olympic” and according to them, the rink should be 30 meters in width and 61 meters in length with a corner radius of 8,5 meters. These ice hockey rink dimensions are used for playing international games.
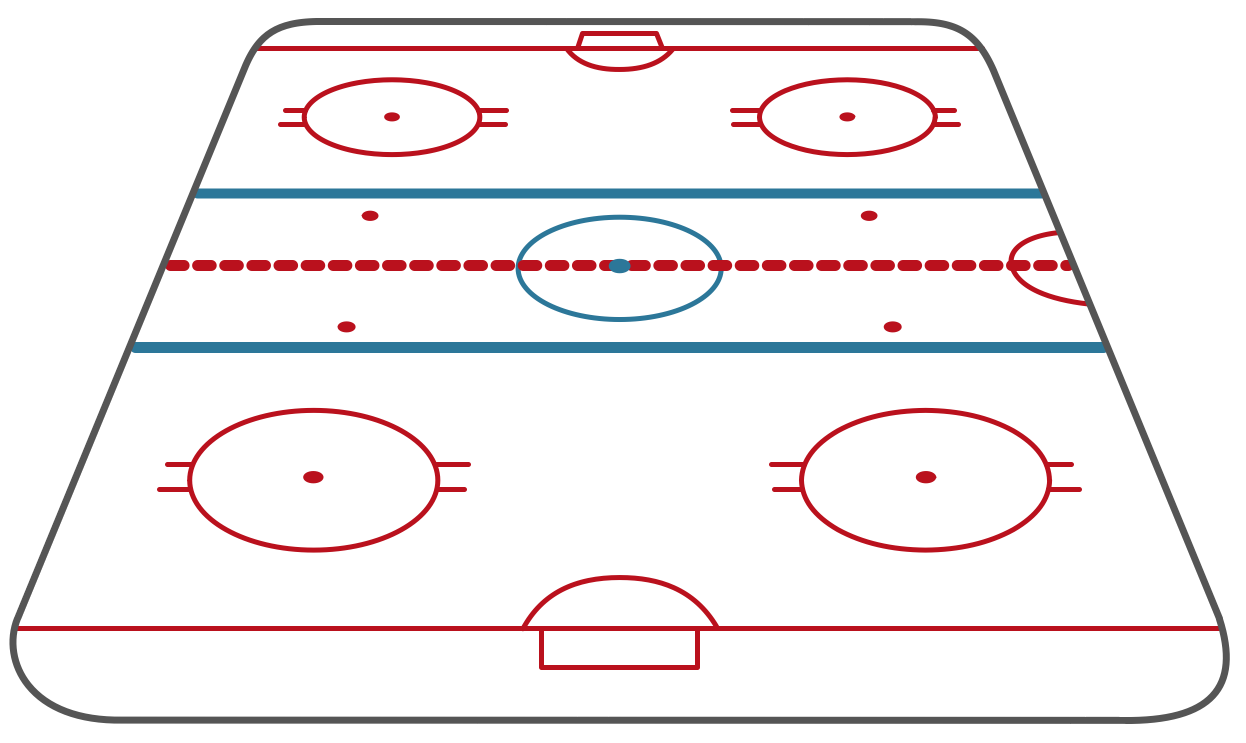
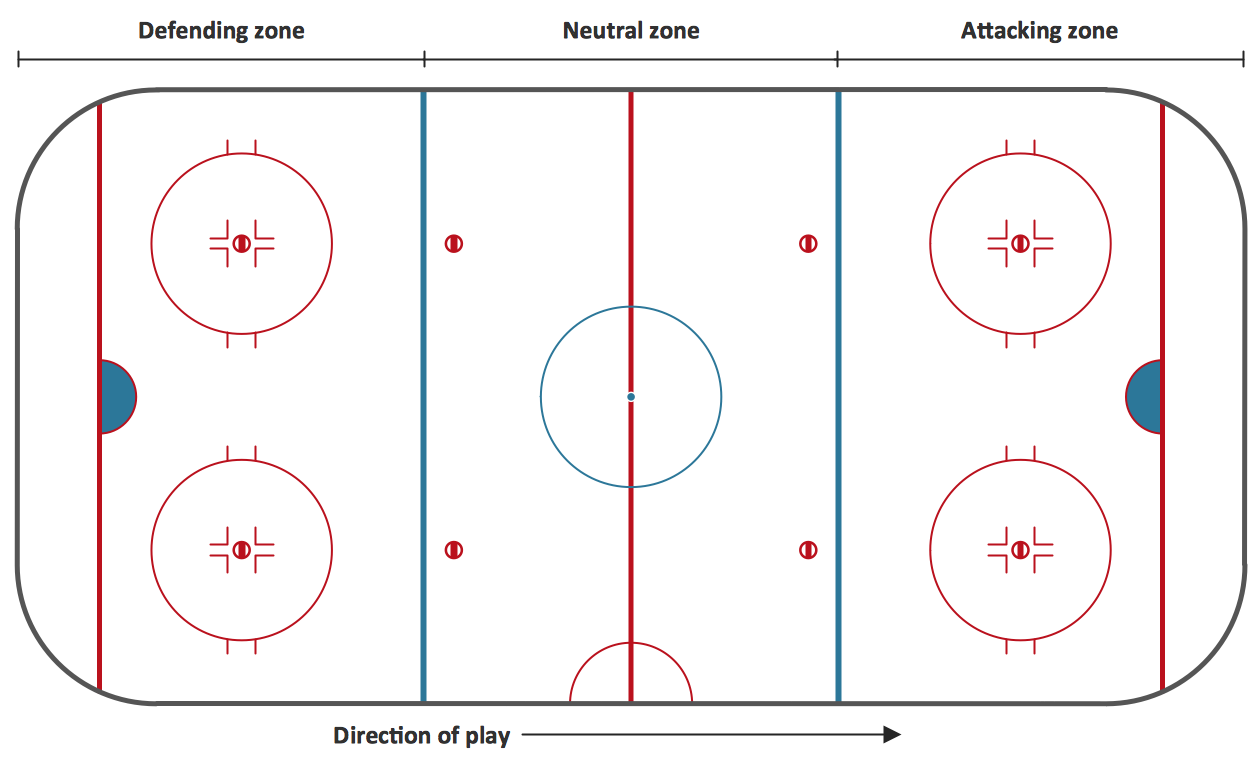
There are all together the 5 lines marked as “icing line”, “blue line”, “center red line”, “blue line”, and “icing line” on the surface of the ice hockey rink, followed by these rules. 3 middle lines marking the 3 zones of the rink are called:
| Skating Rink Zones | Name |
|---|---|
| Defending zone | Lies from the icing line to the blue line |
| Neutral zone | Lies from the blue line to the blue line |
| Attacking zone | Lies from the blue line to the “icing” line |
The blue lines are 22,86 meters from the end boards and the two “icing” lines are only four meters from the end boards.
Most of the North American rinks follow the specifications below: 61 meters by 26 meters with a corner radius of the same size as “Olympic” – 8,5 meters. The distance from the “end” boards to the nearest “goal line” should be 3,4 meters. The “center line” is used for dividing the ice hockey rink in half and it is also used for judging the team players. So, if a team sends the puck across the “center” line (the red one), blue line, and after across the goal line, then they call it “icing”.
There are also 2 “blue” lines and they are meant to divide the ice hockey rink into three parts or, so-called “zones”. These two lines are used for judging in case a player is offside. But if an attacking player crosses the line going into the other team's zone prior to the puck crossing, then this situation is called an “offside”.
Near each of the ends of the rink, there is a thin red so-called “goal line”. This “goal line” is used for judging the goals and also the icing calls. There are also 9 “faceoff spots” on an ice hockey rink: two spots in each team's defensive zone, two at each of the ends of the neutral zone, and only one in the center of the rink. There are “faceoff circles” around the whole center of the rink and there are “hash marks”, painted on the ice near the end zone faceoff spots.
The circles and “hash marks” are there to show where players can position themselves during a faceoff. Both the center faceoff circle and the center faceoff spot are marked in blue. The circle is all together nine meters in its diameter with one outline of 5 centimeters. The faceoff spot is usually marked in a solid blue circle of 30 centimeters in diameter. All of the other circles and faceoff spots are colored in red color. Each of the spots consists of a circle, which is sixty centimeters in diameter with an outline of 5 centimeters.

Example 1. Ice Hockey Rink Dimensions
How To Play Ice Hockey: Basic Rules
There are so many rules about how to play ice hockey game and about the ice hockey rink itself, including the strict rules about the ice hockey rink dimensions mentioned above. The basic rules are:
- Each team has six players (one goaltender and five skaters including three forwards and two defensemen) on the ice called "line change", which can be changed during the play.
- Teams switch their sides at the end of each period.
- A standard ice time lasts 60 minutes and is split into three periods with 15-minutes breaks. The overtime in a 3 on 3 scenario is also possible in case of a draw to determine the winner.
- By the faceoff at the center ice, the game begins.
- The objective is to shoot a goal and the team with the most goals wins.
- When the entire puck crosses the goal line between the goalposts and below the crossbar, a goal is considered as scored.
- Penalties are given for any rule infractions, such as hooking, high-sticking, tripping, etc.
- If a team sends the puck across the “center” line (the red one), blue line, and after across the goal line, then they call it “icing”.
- The situation called an “offside” appears if an attacking player crosses the line of the other team's zone before the puck crossing.
- Body checking or using a body to inhibit an opponent, except hits from behind or to the head, is allowed in men's hockey.
- Players are required to wear specific protective gear: helmets, mouth guards, elbow and shoulder pads, gloves, shin guards, and skates.

Example 2. Ice Hockey Diagram Design in ConceptDraw DIAGRAM
The Ultimate Ice Hockey Rink Diagram
If you want to draw a plan for an ice hockey rink or an ice hockey rink diagram printable, then you have to take all of the mentioned rules into consideration as it is very important to know all of the exact dimensions. Knowing them for sure, you have this unique chance to create your own professional-looking ice hockey rink plan. The primary objective of the game is to shoot the puck into the opponent's net and score more goals than the opposing team. The visual diagrams and their analysis help to achieve this goal efficiently.
Diagrammatic Approach to Learning the Game
A diagrammatic approach is a powerful tool for coaches and players in teaching and learning the basics of ice hockey and mastering in it. The hockey rink diagram visually represents the rink layout, its dimensions, zones, and key markings, helps to illustrate plays and tactics and clarify the roles and responsibilities of each player on the ice. These visuals show important nuances, how different elements interact, help to analyze wrongs and errors and develop ways and strategies to correct them.
The ice hockey field diagram is especially powerful in teaching young players foundational skills. Referees, officials, and analysts use them to analyze games and comment on them. Fans apply diagrams to enhance their understanding of the game's strategies.
Using hockey ice diagram to learn the ice hockey game can significantly improve a player's understanding and retention. The illustrations are the basis of strategic planning and help to explain player positions in different phases of the game, rules of the ice hockey, offensive and defensive strategies, basic concepts, timing, and various game situations, power plays, faceoff formations, successful passes, shots, and penalty kills. They help to break down complex situations and strategies into easily digestible parts and are a part of tactical planning and a convenient way to follow game flow by showing player movements and puck trajectories.
The visual ice hockey rink dimensions diagram and other sport diagrams based on it are valuable both for beginners and experienced players. They help to improve skills, tactical awareness, and coordination, show strategies in action, team dynamics, and positioning. They illustrate common mistakes, positioning, and angles, and teach to anticipate opponent movements and plan their responses.

Example 3. Ice Hockey Rink — Short and Long Side Views
Overview of ConceptDraw DIAGRAM Sport Drawing Software
The right software helps to make your drawings exceptional. One of the best existing applications for making such sports game field plans, including ice hockey rink drawings and hockey rink diagram printable, is nowadays the ConceptDraw DIAGRAM charting and vector drawing software. Being extended with the Ice Hockey solution, this application allows you to make your own good-looking drawings, so they look professional and smart.
Downloading the Ice Hockey solution from this site or from the application ConceptDraw STORE (which you can always download from this site) will enable you to use any of the previously created examples for making your own smart and professionally looking ice hockey rink diagram.
You will find 2 libraries available for all of the ConceptDraw DIAGRAM users:
- Ice Hockey Rinks
- Ice Hockey Positions
These libraries allow you to create any ice-hockey-related drawing with the use of the ice hockey rink shape in only a couple of minutes using ConceptDraw DIAGRAM application.
The main advantage of using ConceptDraw Ice Hockey solution is that you don't need to draw objects manually, you have all you need in libraries, templates, and samples. This allows you to produce professional ice hockey arena diagram as quickly as possible, and then post them to blog or social media, print, or present on a large screen.
Example 4. Ice Hockey Rink Template
Ice Hockey Examples and Templates
The diagrams you see on this page were created in ConceptDraw DIAGRAM hockey diagrams maker, especially for Ice Hockey solution. They are useful for a wide variety of stakeholders, including coaches, players, and fans. All source documents are vector graphic documents and are available for reviewing, modifying, or converting to a variety of formats (PDF file, MS PowerPoint, MS Visio, and many other graphic formats) from the ConceptDraw STORE.

Example 5. Ice Hockey Solution in ConceptDraw STORE
ConceptDraw DIAGRAM Software Benefits
Having all of the necessary tools to create something special, you will find ConceptDraw DIAGRAM to be a very helpful tool. With its help, you can always concentrate on the problem you face and which has to be solved, but not on the details, such as the correct dimensions or some others. The large collection of examples from the solutions is available for all ConceptDraw DIAGRAM users and using them, you can simply concentrate on the process of creating the sport field plan or ice rink diagram itself, not on making the design elements for being able to draw it.
There are so many pre-made design objects, which all can be found in the appropriate stencil libraries in the solutions you choose, and other useful tools, including pre-made samples and templates. These solutions, developed by the ConceptDraw DIAGRAM team of IT professionals and web designers, can be found on this site or in ConceptDraw STORE application. ConceptDraw STORE is another product of CS Odessa, developed for the purpose of supporting ConceptDraw DIAGRAM users in their drawings by providing the tools for making the process of drawing entertaining and fun.