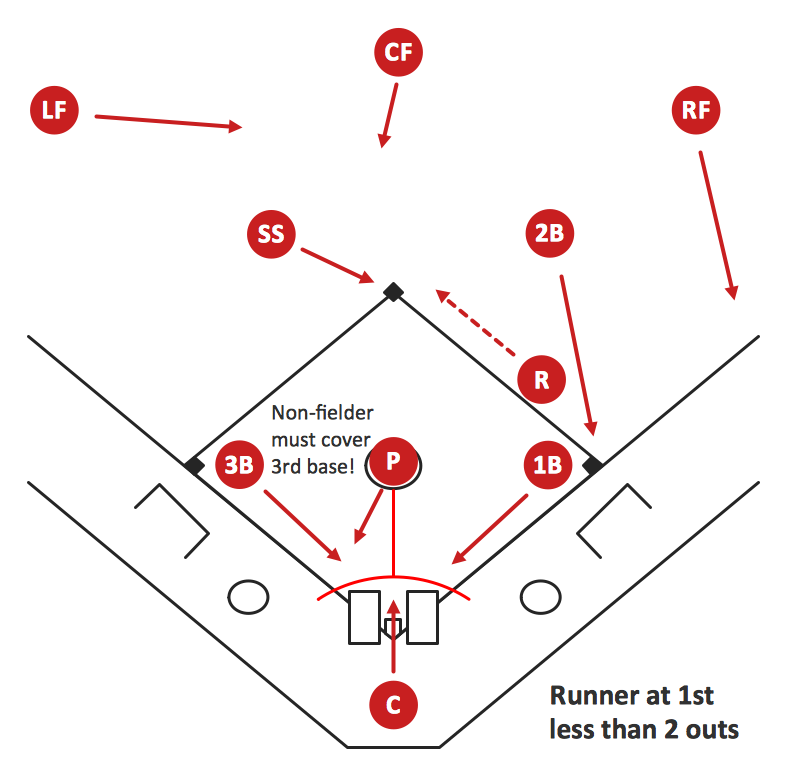
Sample 1. Baseball Diagram – Basic Bunt Coverage – Runner at 1st.
This diagram was created in ConceptDraw DIAGRAM using the "Baseball Positions" library from the Baseball Solution. An experienced user spent 10 minutes creating this sample.
It demonstrates a portion of the solution's capabilities and the professional results you can achieve.
All source documents are vector graphic documents. They are available for reviewing, modifying, or converting to a variety of formats (PDF file, MS PowerPoint, MS Visio, and many other graphic formats) from the ConceptDraw STORE. The Baseball Solution is available for all ConceptDraw DIAGRAM or later users.
TEN RELATED HOW TO's:
To be an expert in American Football this is not enough to know rules, you should also know at least basic offenses and defenses. Getting closer with this kind of knowledge you may find visual football diagrams an extremely helpful. The Football solution for ConceptDraw DIAGRAM gives you a perfect tool for drawing football diagrams.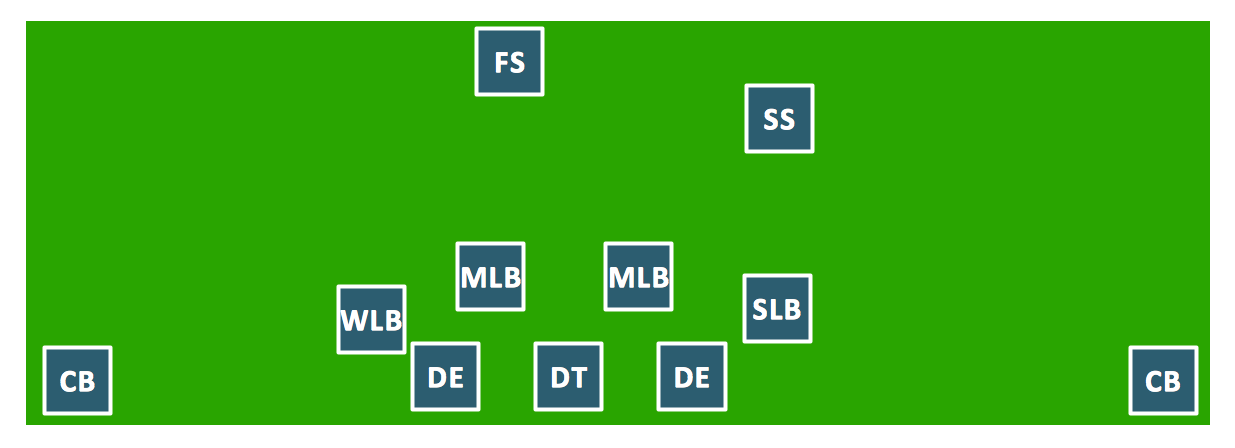
Picture: 3-4 Defense Diagram
Related Solution:
ConceptDraw DIAGRAM extended with the Baseball solution provides access to libraries, templates and samples allows creating baseball diagrams and schemas.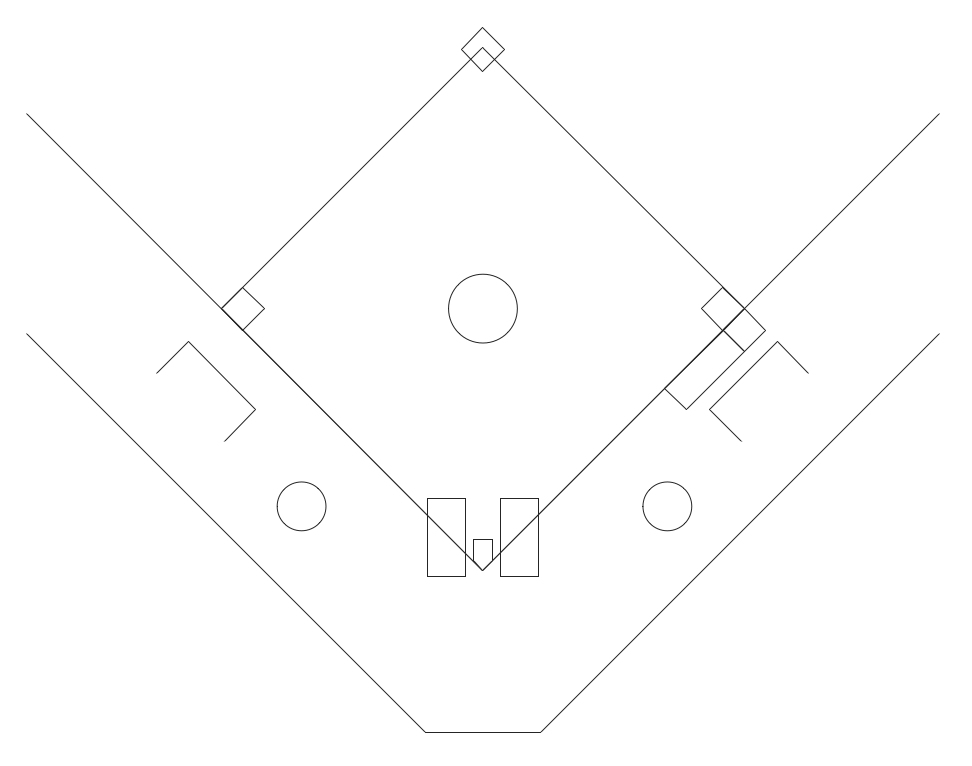
Picture: Baseball Field Schema
Related Solution:
Using the diagrams is the easiest way for coaches and other sport specialists to explain the rules, strategies and tactics of the basketball play. The Basketball solution from the Sport area of ConceptDraw Solution Park was designed as a tool that will help you produce the basketball plays diagrams in a few minutes.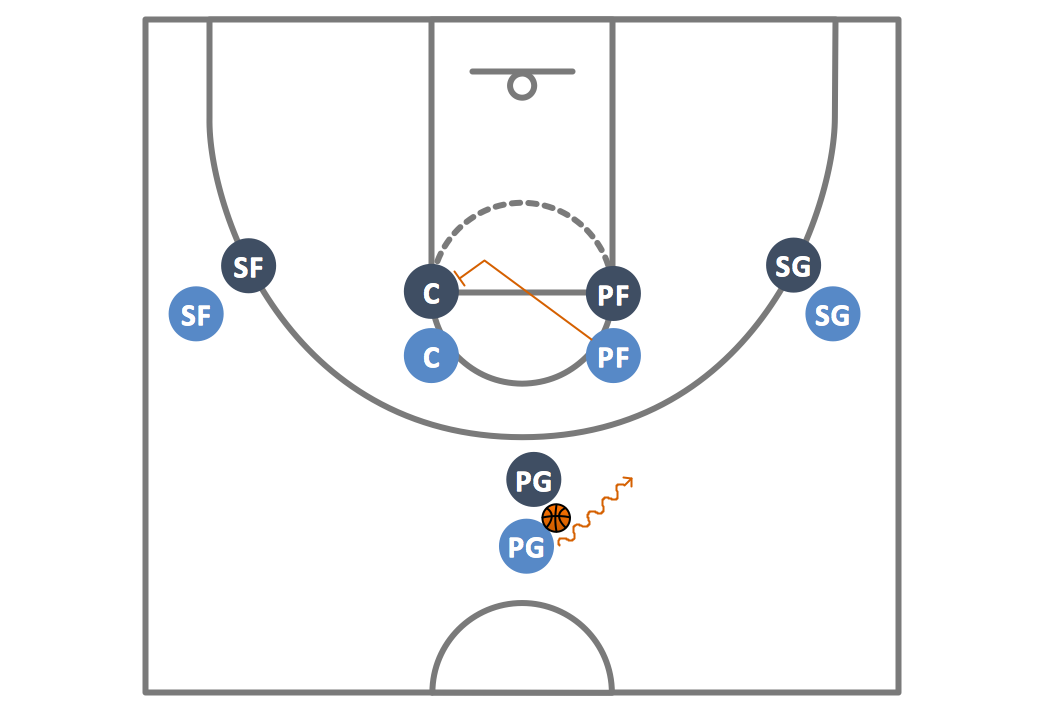
Picture: Basketball Plays Diagrams
Related Solution:
Drawing baseball diagrams using ConceptDraw DIAGRAM software extended with the Baseball solution saves your time, and adds more value to your work.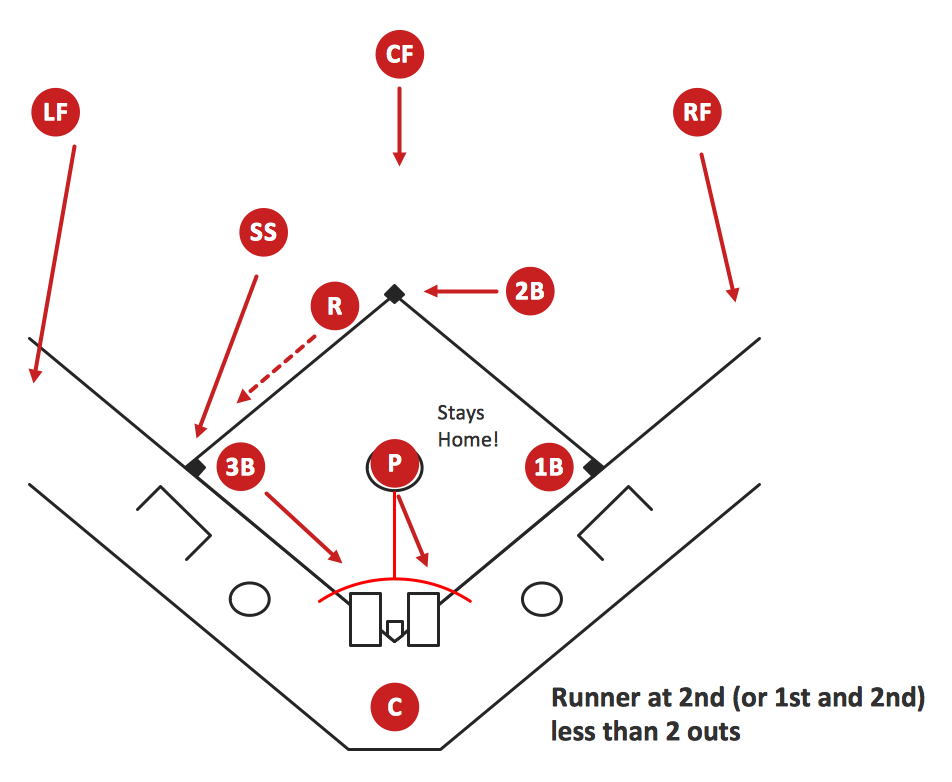
Picture:
Baseball Diagram
Basic Bunt Coverage – Runner at 2nd
Related Solution:
The Baseball solution for ConceptDraw DIAGRAM contains a set of samples depicts helpful baseball diagrams examples. Using embedded presentation tools you are able to share your baseball knowledge with wide audience.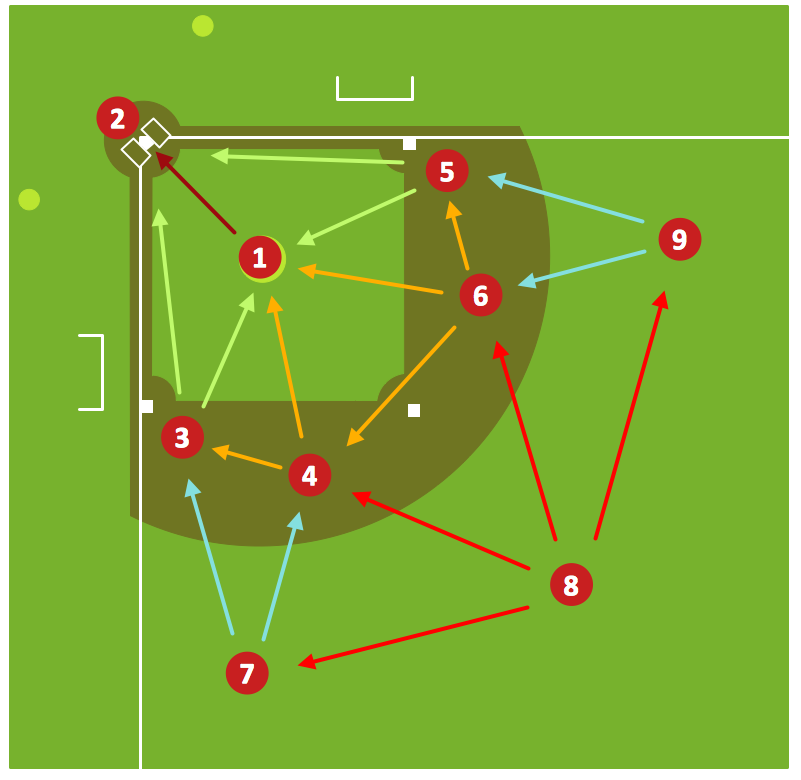
Picture: Baseball Diagram – Defensive Fly Ball
Related Solution:
ConceptDraw DIAGRAM extended with the Baseball solution provides access to libraries, templates and samples allows creating baseball diagrams and schemas. All plays and positions diagrams are available as ready-to-modify samples.
Picture: Baseball Field Sample
Related Solution:
Thanks to Baseball solution all you need is just drag and drop ready-to-use positions objects to a template contains baseball field, and place positions on the field.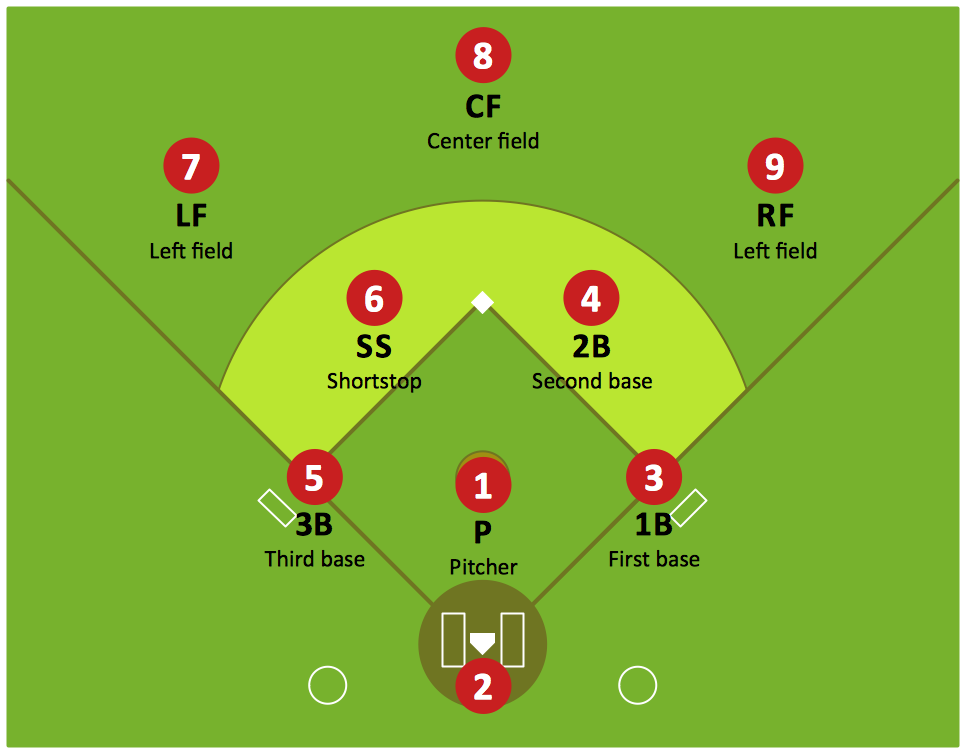
Picture: Baseball Diagram — Defence Positions
Related Solution:
As restaurant industry is growing rapidly nowadays, researches show that almost half of the adults have worked in a restaurant or a cafe. Moreover, many of them dream to start their own someday. Unfortunately, it takes a lot of time to write a business plan and to find a great location, although some know how to create a restaurant floor plan in minutes or how to plan budget effortlessly. Hiring employees can also cause a lot of headache, but this is crucial for further success, because every guest comes to restaurant for a good service and delicious food. It is also worth noting that restaurant concept is also important, because it defines target audience and influences the menu.
This diagram represents the floor plan of an ongoing sports-theme establishment - restaurant, cafe, or other food service. A number of widescreen monitors installed along the perimeter provide visitors the opportunity to follow the course of a match from anywhere in the dining room of restaurant or cafe. The most of sports fans believe that food and alcohol is a big part of any sports show. That is why the dining room takes the most space - almost 60% of the total establishment space. Nearly all sports fans consume beverages while watching sports - beer, soda or water at least. Thus, the restaurant floor plan designers added a large lavatory there. Moreover, project developers considered unnecessary the gender division of such delicate place - perhaps they guess that only men are watching football, or believe that alcohol will eliminate the most of gender differences.
Picture: How To Create Restaurant Floor Plan in Minutes
Related Solution:
The Soccer (Football) Fields library from the Soccer solution from the Sport area of ConceptDraw Solution Park provides a complete set of predesigned fields: horizontal and vertical located, colored or not, end zone view soccer field.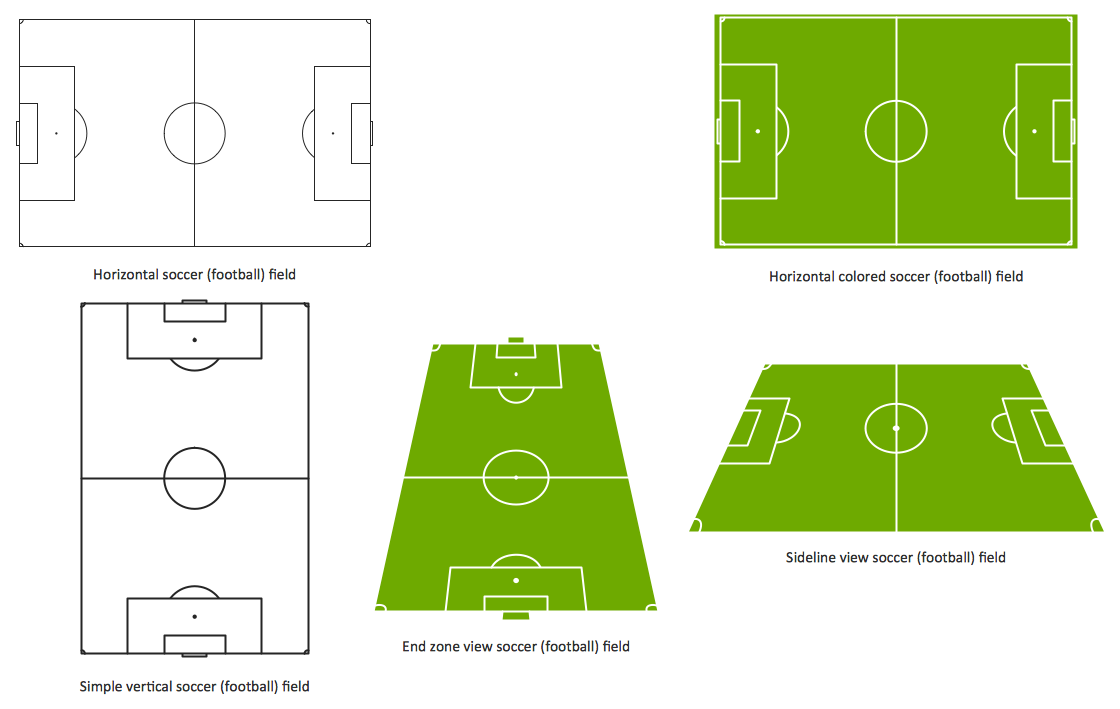
Picture: Design a Soccer (Football) Field
Related Solution:
Basketball is a popular sport played by two teams of five players with a ball. The game takes place on a rectangular court. The team goal is to score a ball into the basket of the opponent team. The team with the most points wins the game.
ConceptDraw DIAGRAM diagramming and vector drawing software extended with Basketball solution from the Sport area of ConceptDraw Solution Park is a very useful tool for designing the basketball-related diagrams of any complexity.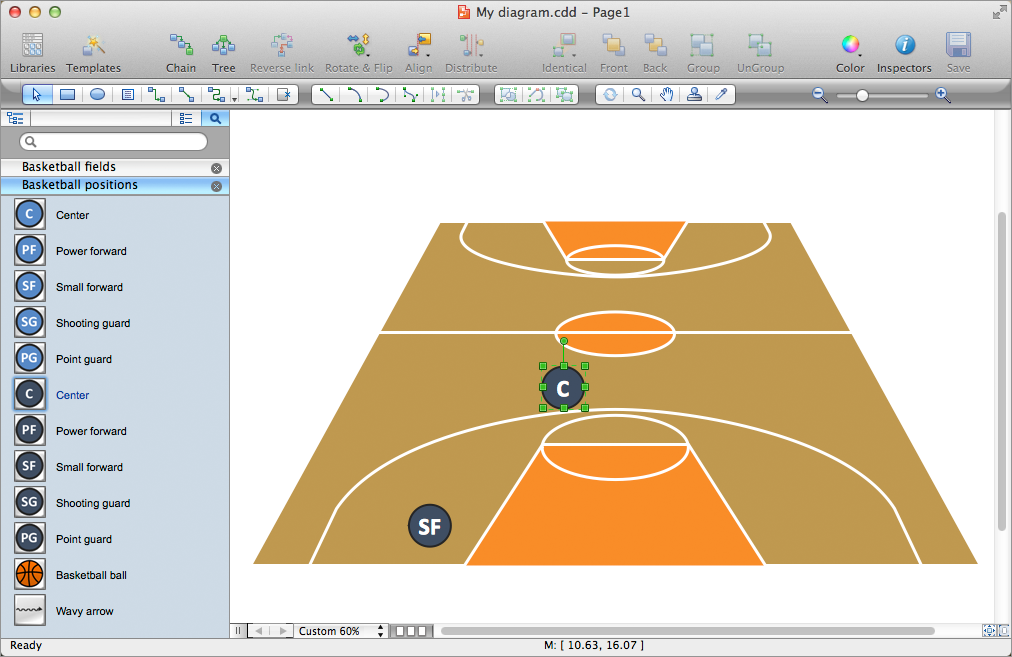
Picture: Basketball Plays Software
Related Solution: