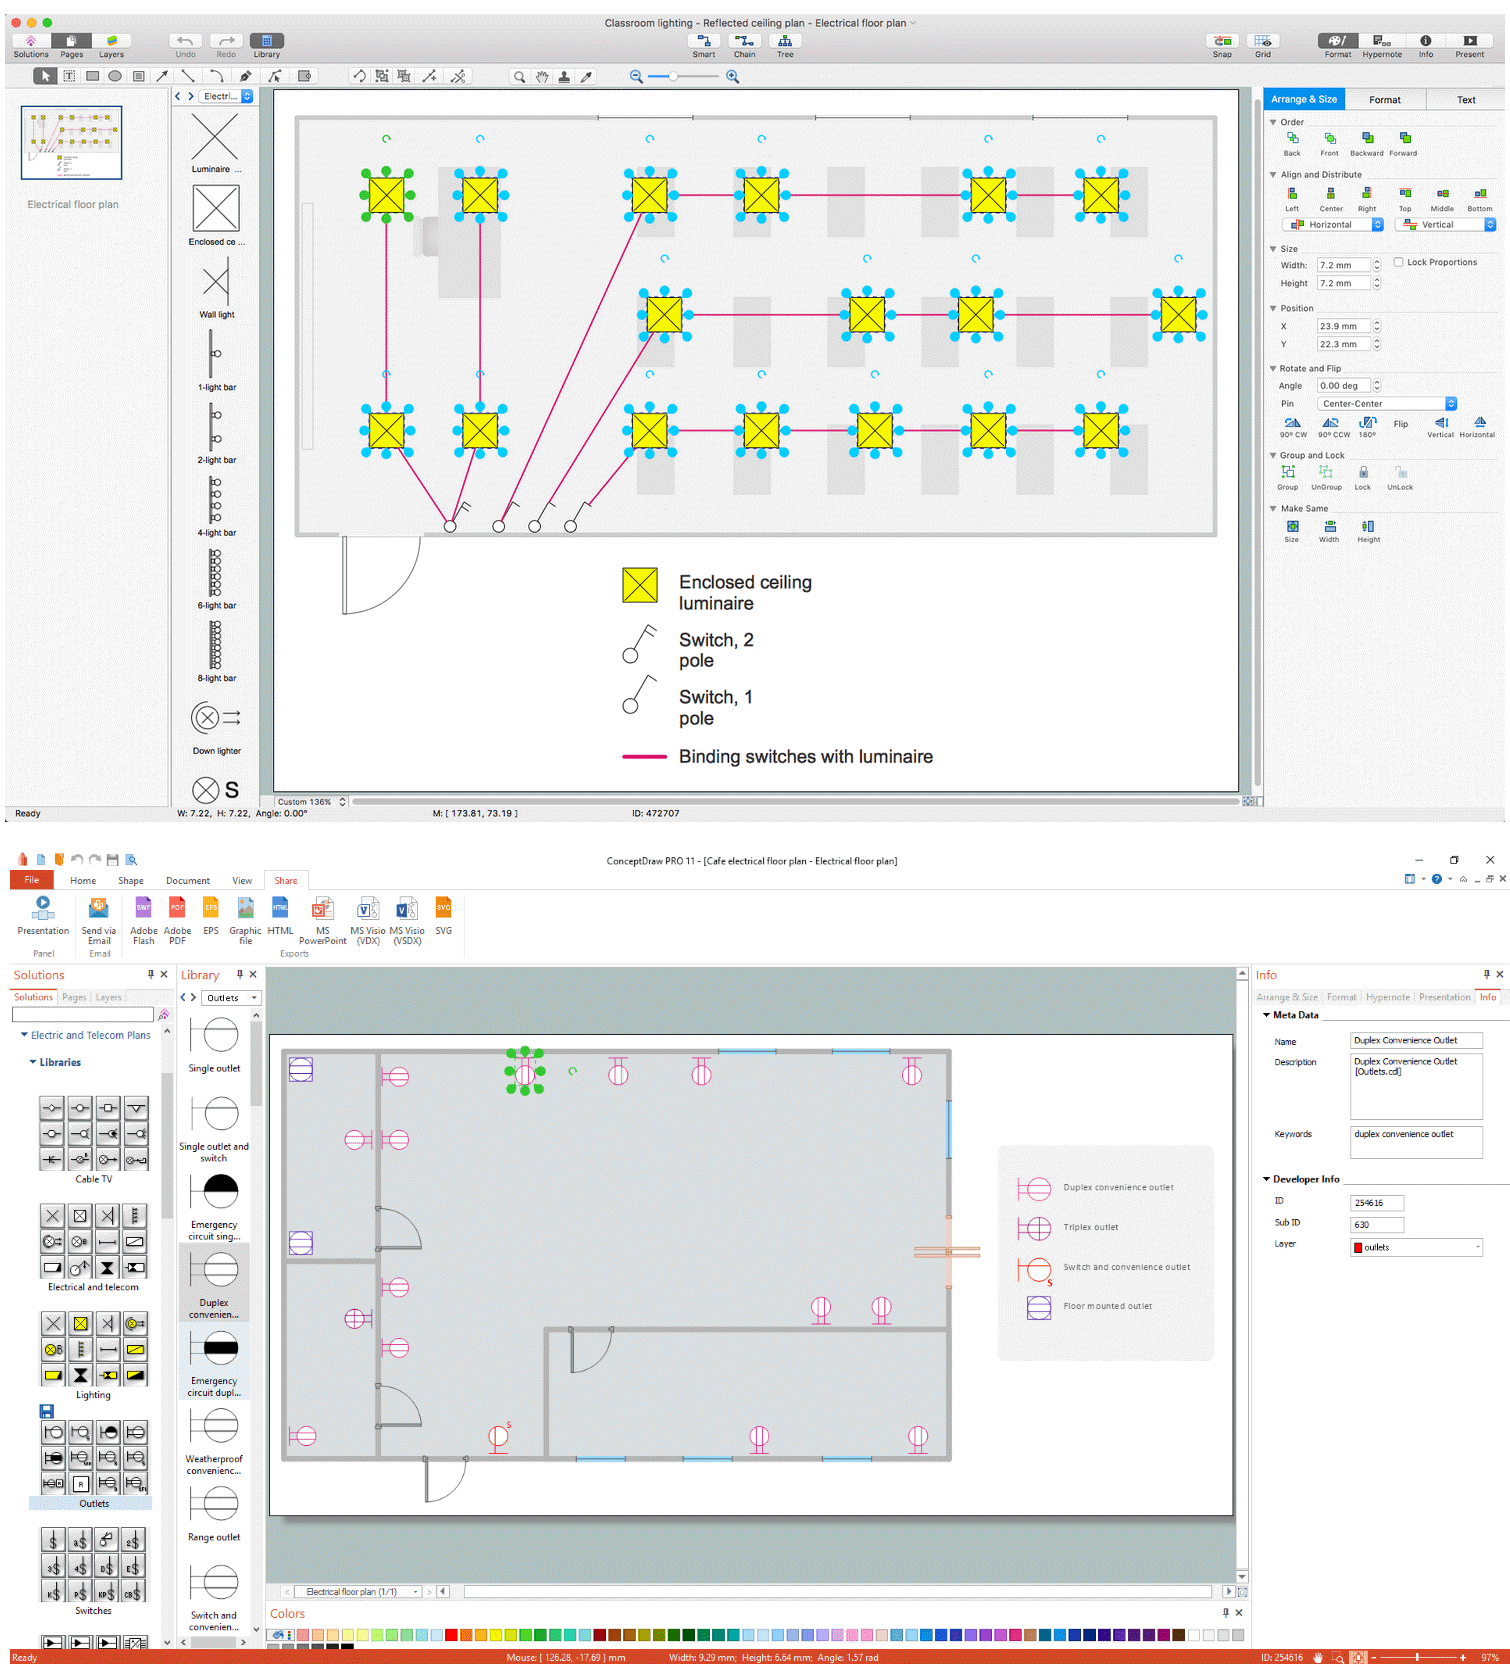
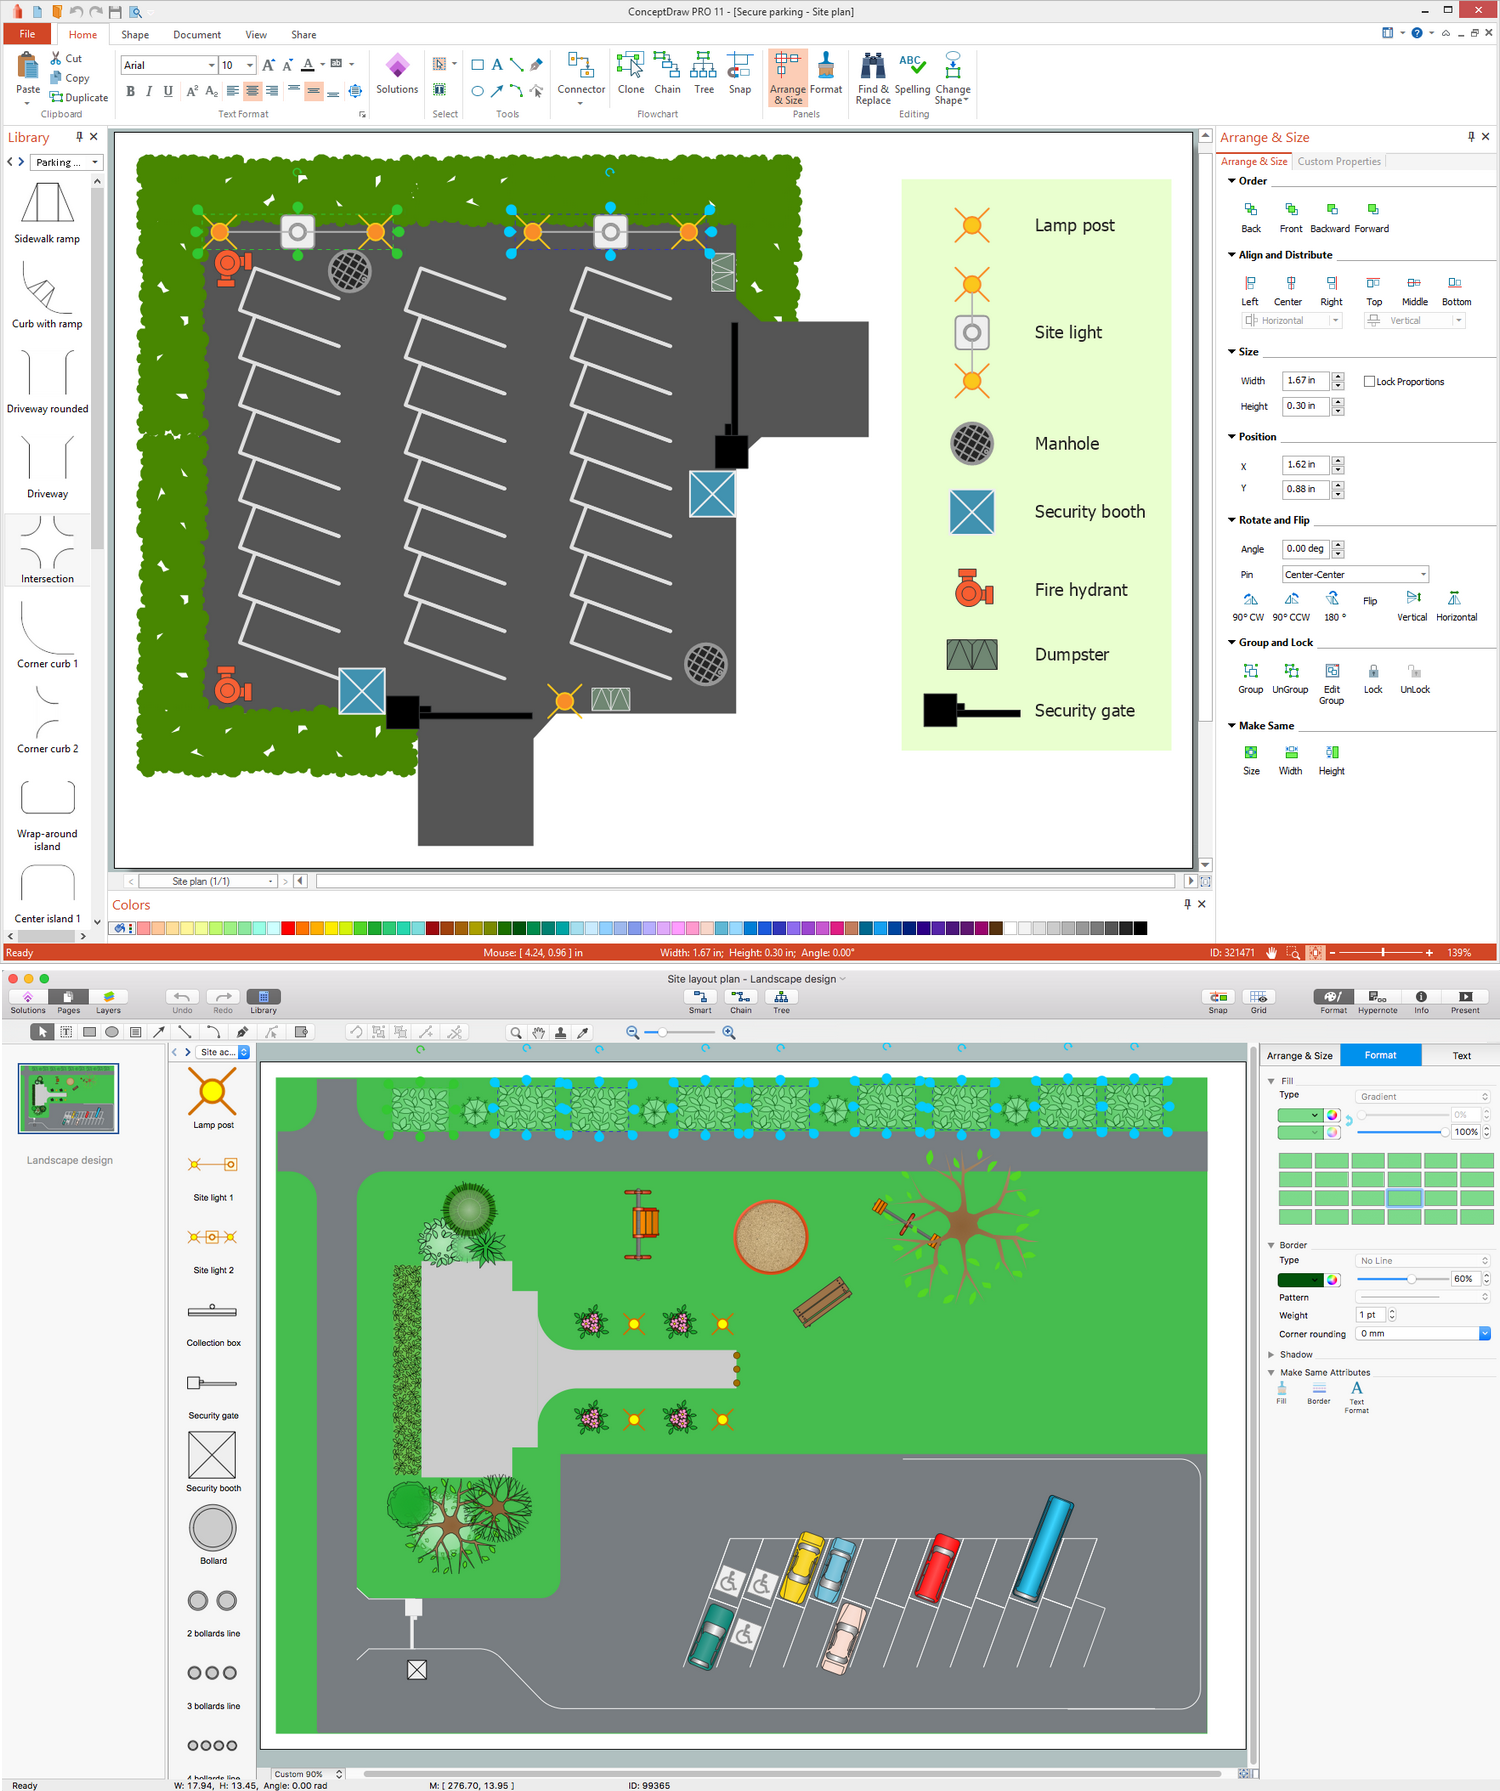
Best Diagramming Software for macOS
If you are looking for the best diagramming drawing software for your Mac, then a good option for you can be a ConceptDraw DIAGRAM one, extended with numerous solutions for simplifying your work with drawing diagrams, as well as charts, flowcharts, maps, schemes and other schematics, as ConceptDraw DIAGRAM gives all of its users the ability to draw the various diagrams within only a couple of hours or, sometimes, minutes, depending on how good you know it already. The “Basic Shapes solution” is a Mac OS software tool for drawing the business communication ideas and concepts, simple visual presentations full of numerical data and other.
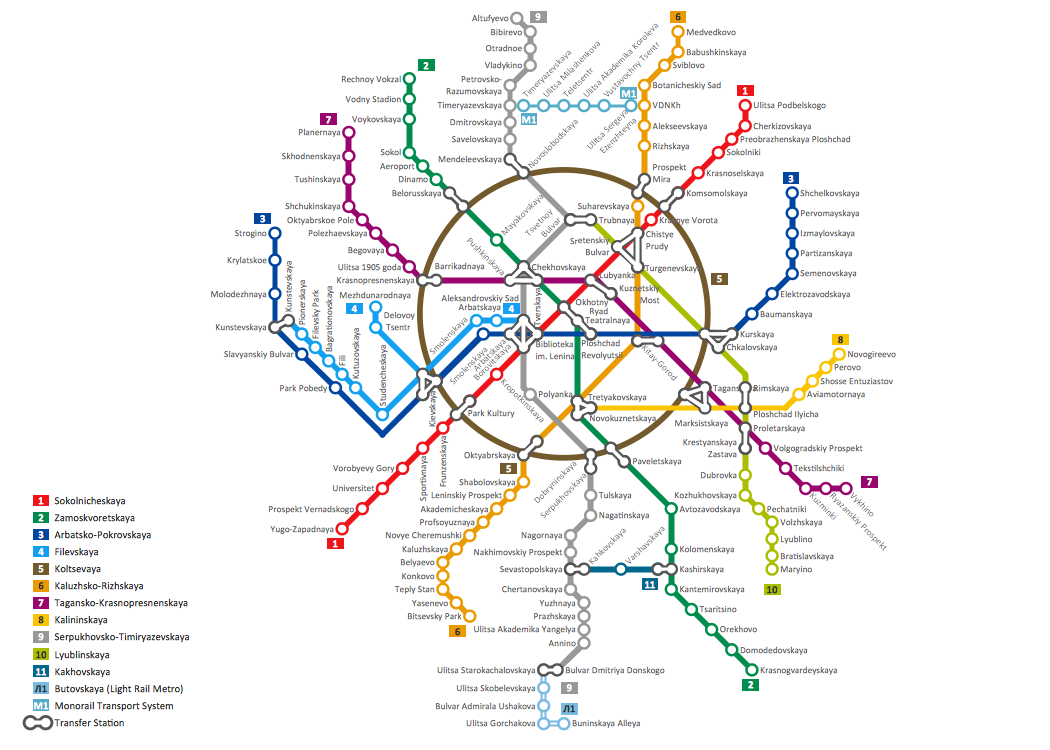
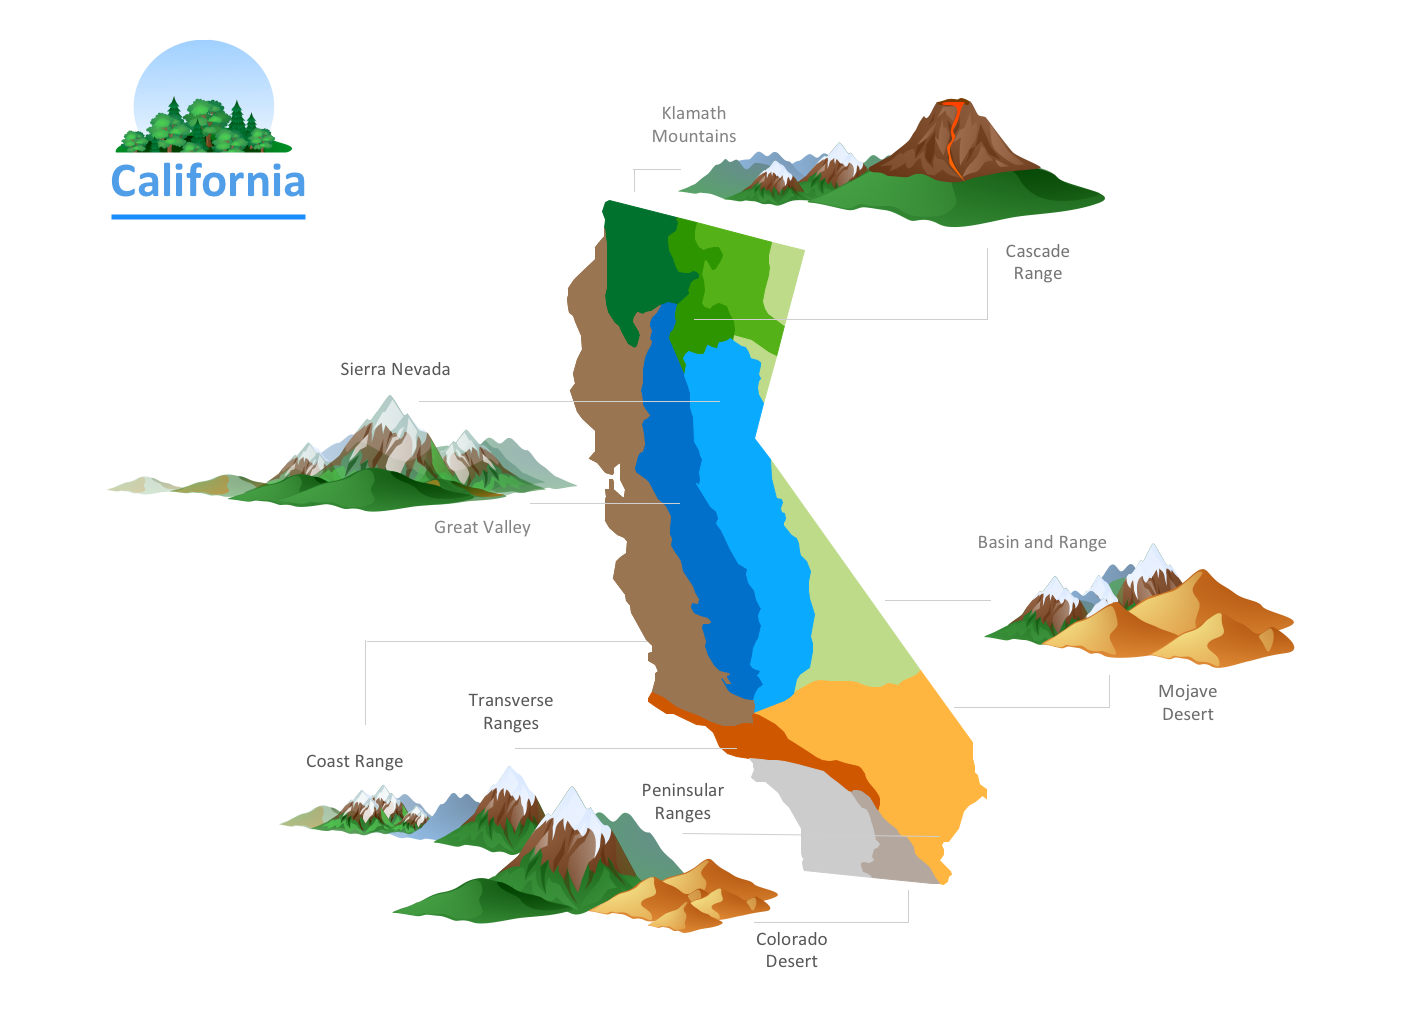
There can be other variations of such kinds of diagrams and in order to draw them you need a useful software, which is, obviously, ConceptDraw DIAGRAM one, which can help you to make any needed chart, flowchart and/or diagram, as well as schemes and plans when you need them simply dragging the needed pre-made example from the appropriate solution and editing it the way you want your final result to look like.
Mac Drawing App
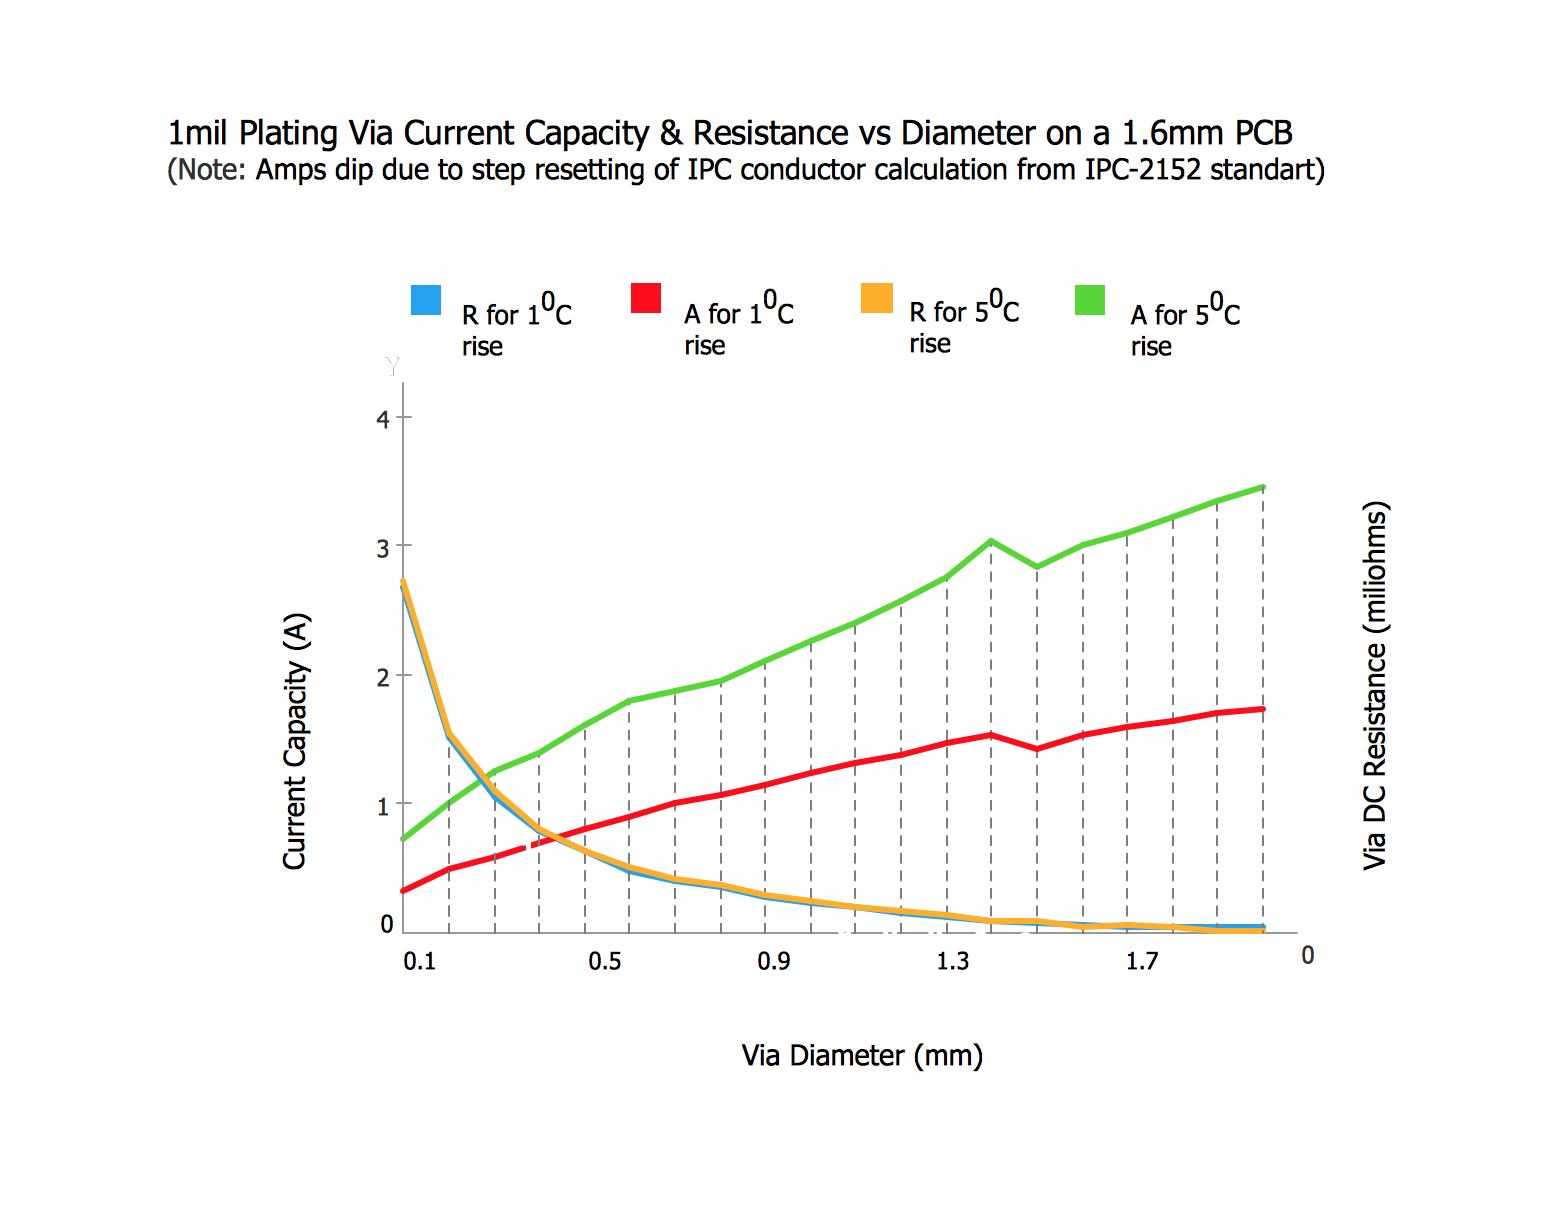
One of the diagrams which you can make in ConceptDraw DIAGRAM within a short period of time is a “bubble” one, also known as simply “bubble chart”. It is basically a type of chart, with help of which it is easy to display 3 different dimensions of the same data. Each of the entities with its triplet (e.g., v1, v2, v3) of the needed to be illustrated data is plotted in a way of a disk, expressing 2 of the vi values through the disk's xy location. The third of the v3 values is expressed through its size in any of the bubble charts, that are used for facilitating the understanding of social, medical, economical and other scientific relationships.
The mentioned bubble charts can be considered as a variation of the so called “scatter plot”, where data points are simply replaced with “bubbles”, which you can always use instead of a “scatter chart” itself in case your data has three data series, containing (each) a set of values, having the sizes of the bubbles determined by the values in the third data series.
The human visual system is known to be experiencing a disk's size in terms of its area, having the area of a disk not proportional to its radius. Instead, it is proportional to the square of the radius. Thus, in case someone chooses to scale the disks' radius to the third data values directly, then the size differences among the mentioned disks can be misleading and “non-linear”. In order to get a properly weighted scale, each of the disks’ radius must be scaled to the so called “square root” of the corresponding data value v3. The mentioned scaling issue can lead to different extreme misinterpretations. These misinterpretations can take place especially where the range of the needed data to be represented has a very large spread.
It’s well known that many people are quite unfamiliar with the issue as well as its impact on perception, being still aware of it, hesitating in interpreting a “bubble chart” for only a reason of being unable to assume that the scaling correction was already made. Thus, it is important to take into consideration that bubble charts can not only be scaled in one way, but also they can be clearly labelled to any document, conveying the data.
The so called “metaphoric” representation of all the needed data values to be represented in a way of the disk areas cannot be extended for displaying values which are negative (zero). As a fall-back, some of the users of bubble charts simply resort to graphic “symbology” in order to express the non-positive data values. This approach can be effective in such situations when data values' magnitudes (or “absolute values”) are being very important, and so they are being represented by so the called “congruent” (in case one of the disks has the same shape and size as the “mirror image” of the other or them having the same size and shape) disks.
In order to represent “zero-valued” data, some of the users dispense with disks altogether, using a square centred at the appropriate location. Any additional information about the entities apart from their “three primary values” can often be illustrated in a way of rendering their disks in colours and different patterns, chosen in a systematic way. And any supplemental information can be always added in a way of annotating disks with the textual information, identifying labels for cross-referencing to explanatory keys and the like.

Sample 1. Best Diagramming Software for macOS
Having ConceptDraw DIAGRAM application you can always quickly create any needed diagram, including the “bubble” one and so then to export it to many graphic formats, including Microsoft PowerPoint, PDF file, MS Visio and other. In case it’s time to make the planned data flow diagram or flow chart, then you can simply download ConceptDraw DIAGRAM software, find the needed solution from this site or from ConceptDraw STORE application and edit the existing samples adding the needed design symbols, so your final flowchart will look truly professional.
ConceptDraw DIAGRAM software extended with the numerous solutions can be especially useful, if you have no idea where to start from and what to do about the drawings, which are all expected to be created by you within a short period of time. Once you need help, then CS Odessa team of IT specialists is here to recommend you to use one of the most progressive applications nowadays — ConceptDraw DIAGRAM
If you are looking for the alternative to Visio for Mac, then we can ensure you that ConceptDraw DIAGRAM is one of the best applications for such purposes, enables all of its users to create the needed flowcharts, diagrams, charts, maps, schemes and other smart looking schematics to use for their business presentations, documents or other documentation.