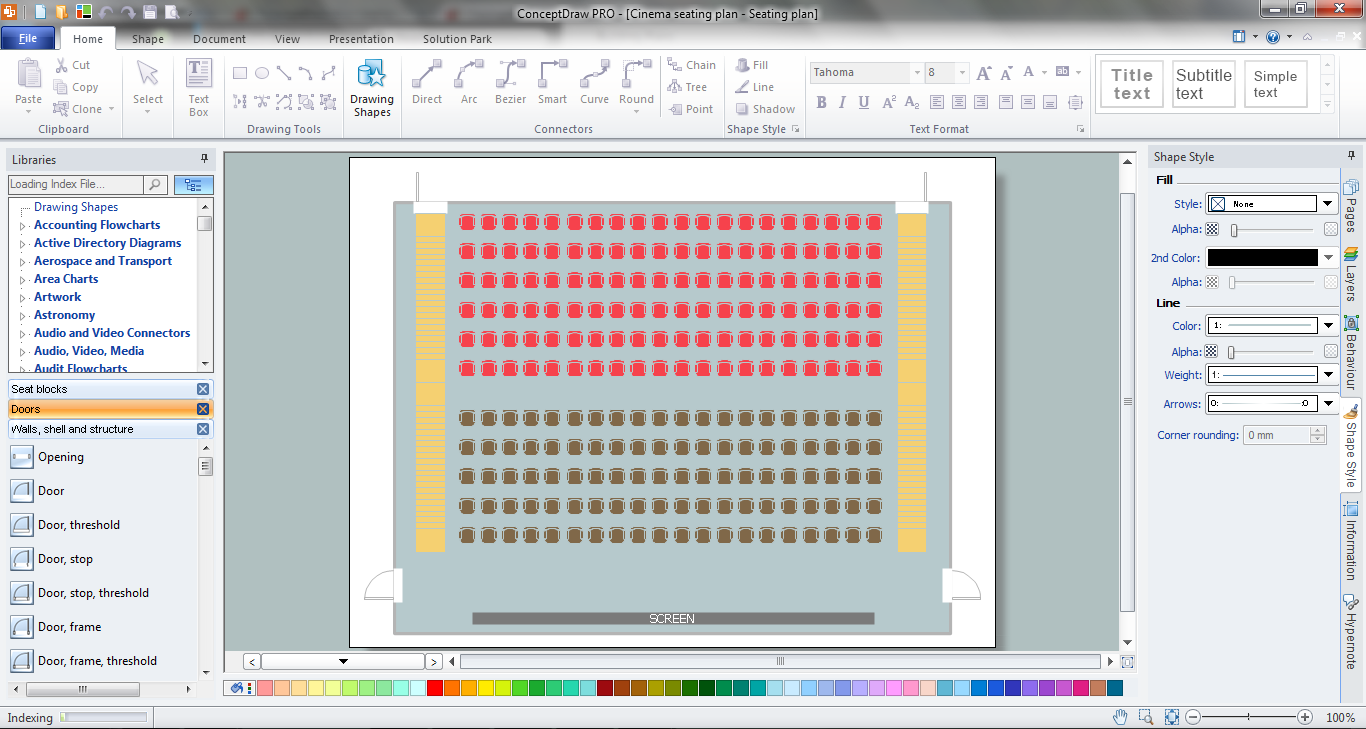
Example 1. Seating Chart Template Free in ConceptDraw DIAGRAM /p>
Use of Seating Plans Solution lets you design the seating charts of any complexity in minutes. All what you need for this is create new document and drag the predesigned objects from the Seat Blocks library from the Seating Plans Solution and arrange them according to your idea. Or you can use the seating chart template free and quickly fill it.

Example 2. Seating Plans Solution in ConceptDraw STORE
Pay your attention to the collection of seating chart samples presented in ConceptDraw STORE. They are so different that anyone will be able to find something suitable for him.

Example 3. Seating Chart Template Free
This sample was created in ConceptDraw DIAGRAM using the tools of Seating Plans Solution. It shows the seating arrangement plan for the cinema and can be used as seating chart template free for creating your own professional looking seating chart for any premises. An experienced user spent 5 minutes creating this sample.
All source documents are vector graphic documents. They are available for reviewing, modifying, or converting to a variety of formats (PDF file, MS PowerPoint, MS Visio, and many other graphic formats) from the ConceptDraw STORE. The Seating Plans Solution is available for all ConceptDraw DIAGRAM or later users.
HoTo:
NINE RELATED HOW TO's:
There are many tools to manage a process or to illustrate an algorithm or a workflow. Flowcharting is one of those tools. However, it may be difficult to show complex processes that require multiple attributes or several people in a simple flowchart, so a cross-functional flowchart would be a solution for that situation. To create such flowchart, group processes and steps to labeled rows or columns, and divide those groups with horizontal or vertical parallel lines. It is worth mentioning that there are different types of cross-functional flowcharts, like opportunity or deployment flowchart.
This diagram shows a cross-functional flowchart that was made for a trading process. It contains 14 processes, distributed through 5 lines depicting the participants who interact with the process. Also there are connectors that show the data flow of information between processes. The cross-functional flowchart displays a detailed model of the trading process, as well as all participants in the process and how they interact with each other. The lines in the flowchart indicates the position, department and role of the trading process participants.
Picture: Cross-Functional Flowchart
Related Solution:
ConceptDraw DIAGRAM diagramming and vector drawing software extended with Biology solution from the Science and Education area offers a set of useful tools for fast and easy drawing of various biology illustrations and drawings.
Biology solution provides 3 libraries with large quantity of vector biology symbols: Biochemistry of Metabolism Library, Carbohydrate Metabolism Library, Citric Acid Cycle (TCA Cycle) Library.
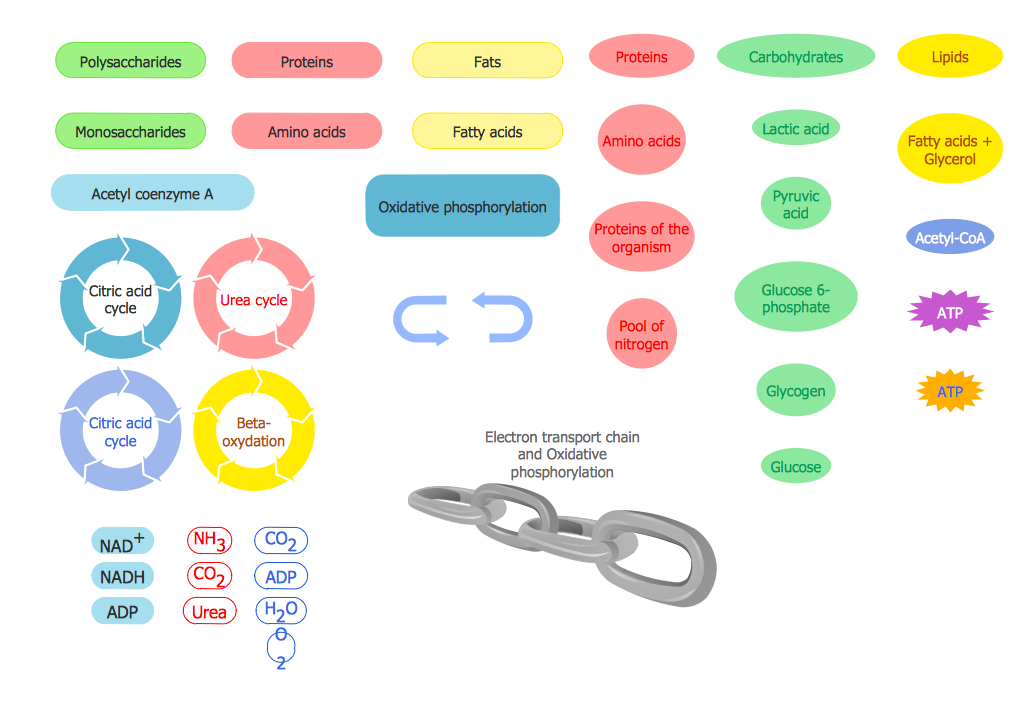
Picture: Biology Symbols
Related Solution:
The ConceptDraw vector stencils library Cisco Multimedia, Voice, Phone contains equipment symbols for drawing the computer network diagrams.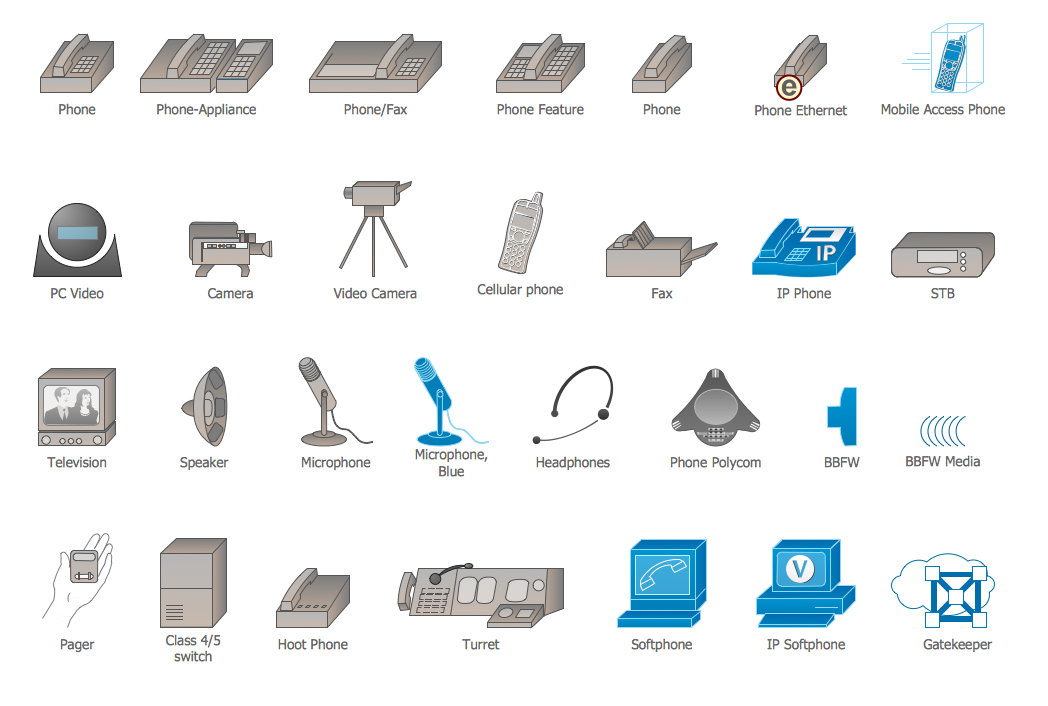
Picture: Cisco Multimedia, Voice, Phone. Cisco icons, shapes, stencils and symbols
Related Solution:
Set of vector cliparts, samples, templates and libraries helps you to create all sorts of new imagesthe for Money Illustrations.
Various styles of money design elements (currency symbols, clipart, money symbols) can be found in ConceptDraw DIAGRAM Business and Finance Solution.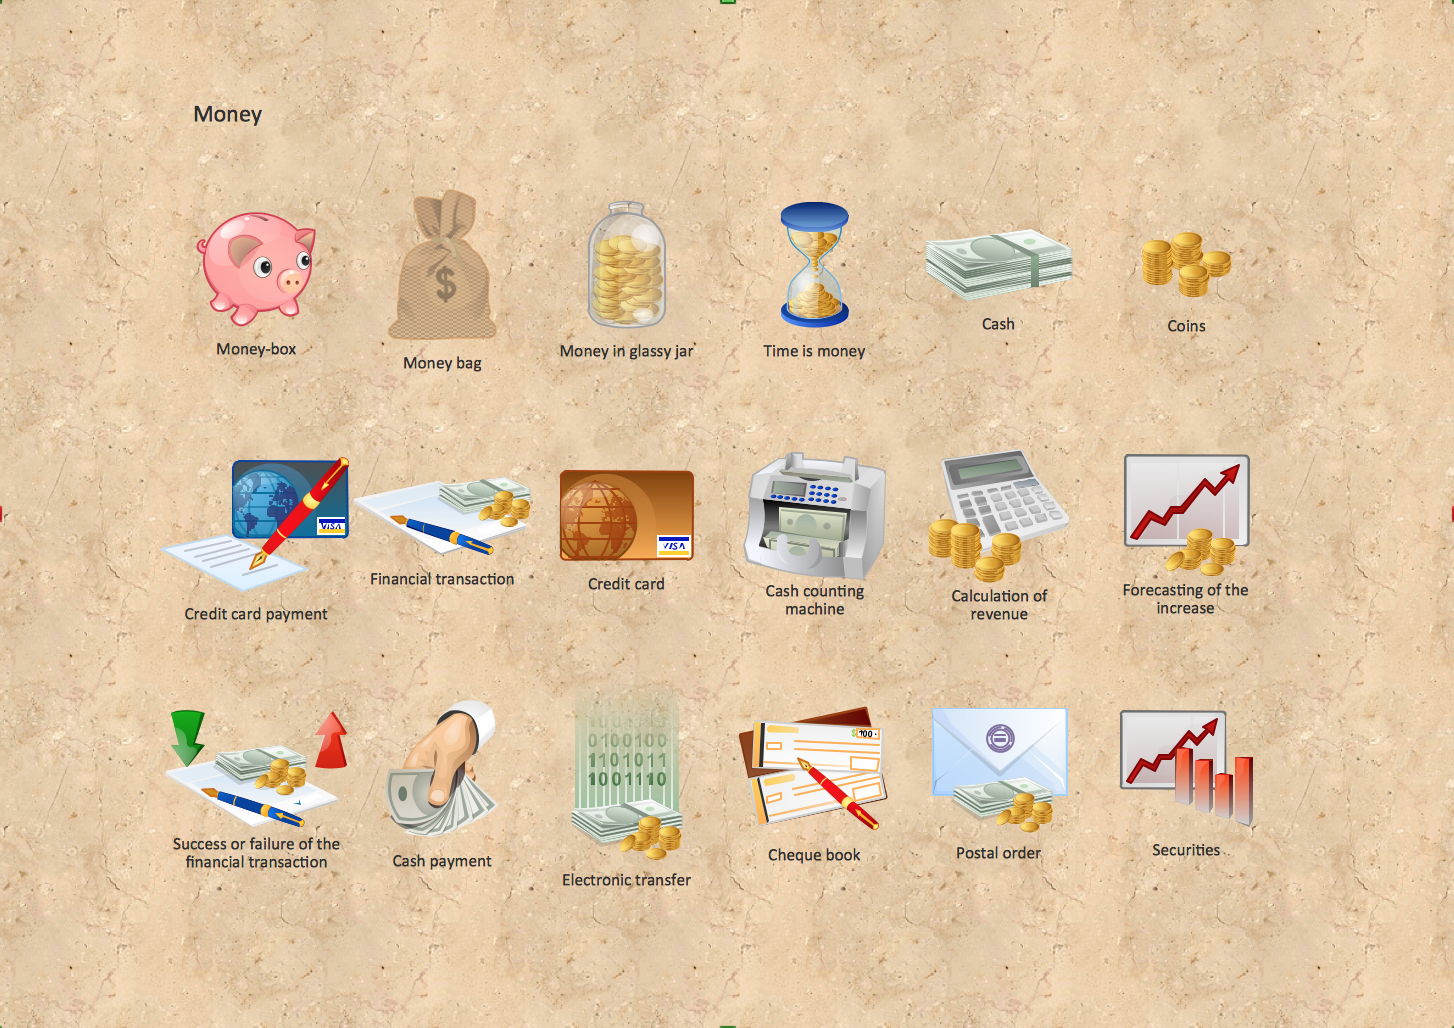
Picture: Money - Design Elements
Related Solution:
Designing your own house sounds exciting at the beginning, but as the time passes, the more you realize there are stumbling blocks. To aid yourself, discover how to use house design software, and develop floor plans, landscape layouts or furniture arrangement plans easily. You can start from altering templates, and you won’t even notice how your designing skills would improve rapidly.
This private country house and landscape plan was created using ConceptDraw Floor Plans solution. Its power set of libraries containing near 700 vector graphic elements enhanced with handy templates is designed, so that an ordinary people can create professional floor plans. Using the stuff, provided by this solution, you can effortlessly design a plan of house, rooms and even backyard layout and landscape. This will save your time and money.This sample plan represents a detailed plan of the private ownership. It defines the apartments layout, the appointment arrangement and even possible location of plants in the garden.
Picture: How To use House Design Software
Related Solution:
Website wireframes are convenient and widely used by developers, visual designers, business analysts, and many other people related with projection, development and promotion websites. Usually website wireframes look lacking of brilliance, but they effectively reflect website functionality, content and visually represent its skeletal framework.
ConceptDraw DIAGRAM software offers a unique Website Wireframe solution from the Software Development area with all needed tools for fast and easy drawing professional looking website wireframe with attractive interface design.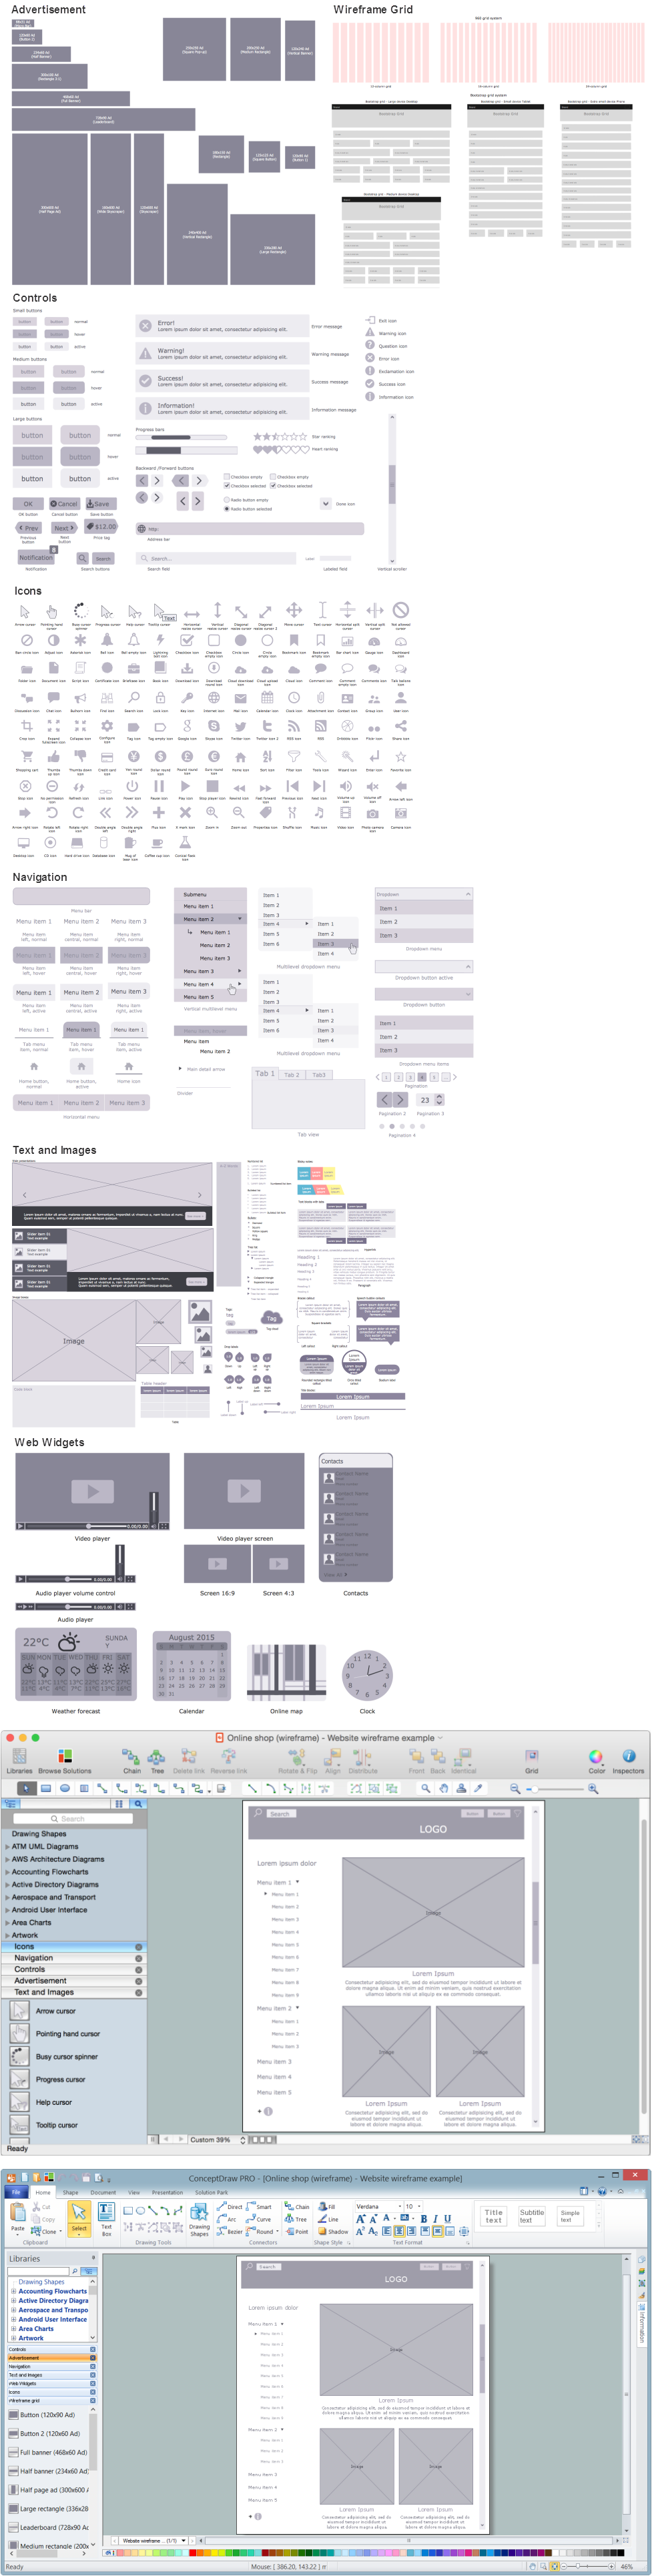
Picture: Interface Design
Related Solution:
Successful Cafe Interior Design is so much broad definition, it includes a lot of things beginning from the choice of furniture and its placement, and finishing by the elements of design and interior, and by many other little details. ConceptDraw DIAGRAM offers the Cafe and Restaurant Floor Plan Solution from the Building Plans area allowing architects and designers develop and represent the Cafe Interior Design of any detailing.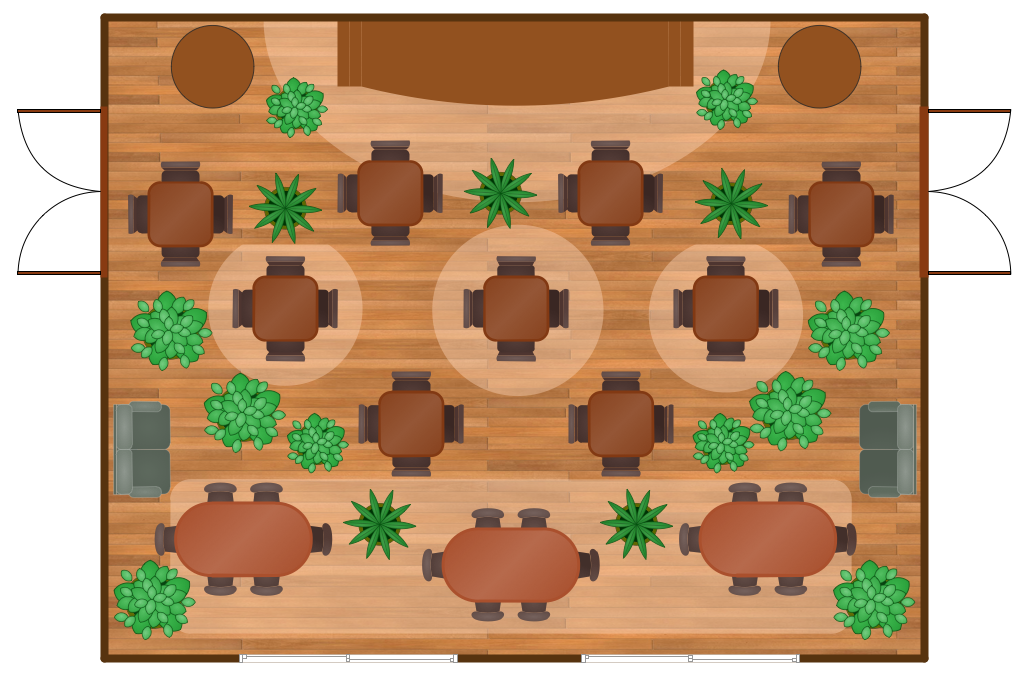
Picture: Cafe Interior Design
Related Solution:
To design line and scatter charts use ConceptDraw DIAGRAM diagramming and vector drawing software extended with Line Graphs solution from Graphs and Charts area of ConceptDraw DIAGRAM Solution Park. (Line chart, scatter chart, 2d chart).
Picture: Line Graph Charting Software
Related Solution:
Bar charts represent data in different categories or groups.
Create bar graphs for visual solving your scientific problems and data comparison using the ConceptDraw DIAGRAM diagramming and vector drawing software extended with the Bar Graphs Solution from the Graphs and Charts area of ConceptDraw Solition Park.
Picture: Bar Diagrams for Problem Solving.Create space science bar charts with Bar Graphs Solution
Related Solution:

