Best Value Stream Mapping mac Software
Looking for the best value stream mapping Mac software you might find ConceptDraw DIAGRAM application the only one helpful and useful, discovering the solutions, which can be found in ConceptDraw STORE — another product of CS Odessa, created to simplify the ConceptDraw DIAGRAM users’ work of drawing maps, charts, diagrams, flowcharts and different schemes.
Value stream mapping is known to be a lean-management method for conducting the analysis of the current state as well as designing this future state for the series of events, taking a product/service from its beginning all the way through to the customer. Value stream mapping has the supporting methods, which are used in so called “Lean” environments for analyzing and designing the flows at the system level. This value stream mapping is often associated with manufacturing, but also it can be used in supply chain, logistics, healthcare, software and product development, service related industries, as well as the office and administrative processes.
The Japanese industrial engineer Shigeo Shingo was considered as the world’s leading expert on the Toyota Production System, and the manufacturing practices. He suggested that the value-adding steps should be drawn across the centre of the map and the non-value-adding steps should be represented using the vertical lines at right angles to the value stream. Thus, the activities become simply separated into the value stream, which is the focus of one type of attention and the so called “waste” steps, another type. He calls the “process” as the “value stream” and the “operations” as the “non-value streams”, because the so called “non-value-adding steps” are often preparatory or tidying up to the value-adding step and they are closely associated with the person or machine or workstation, executing that value-adding step. Each of the vertical lines is the “story” of a person (or workstation) on the horizontal line represents the “story” of the product, which is being created.
The described value stream mapping is a well-known method, being used as part of Six Sigma methodologies. In software development, the success of Lean in manufacturing as well as production has led to an interest in its adoption. But the current literature on adoption of Lean in the software development sphere of business activity had a disconnect between the high-level principles and the concrete practices related to lean as well as agile software development. The literature had also a limited focus on wastes that were literally mapped from the categories, which were especially identified for manufacturing. This ignoring the transformation that lean thinking has itself moved away and undergone from the focus on so called "removal of waste" to the "delivering and creating value". The pioneer authors of the field Womack and Jones suggested to use the value stream mapping, identifying the missing link in the current literature on lean in the software development activities.
Value stream mapping analyzes both information flow and material, also known as artifact. The following two resources, exemplifying the use of VSM to do it in the context of software process improvement in industrial settings, are, first of all, "information flow analysis", which is known to be an analysis of information flows in the development process, and the "artifact analysis", which is simply the analysis of software artifacts or material, such as use case, requirements, change request or defect report through the development process.
Two key metrics associated with value stream mapping are: the non value adding times and the value adding times. Non-value adding time is also known to be called “waste” as well as “muda”. There are seven value stream mapping tools defined by Hines and Rich in 1997, which are “Process Activity Mapping”, “Supply Chain Responsiveness Matrix”, which is known to be a tool that is used to analyse inventory and lead time within some particular organization (this matrix is represented by showing the so called “lead time” along the X-Axis and inventory along the Y-Axis, showing the result where the slow moving stock resides are illustrated), “Product Variety Funnel”, “Quality Filter Mapping”, known to be a part of the Value Stream Mapping toolkit, used for analysing the processes or functions with respect to a “Quality”), “Forrester Effect Map”, known to be one of the business techniques used for analysing the disturbance on the supply chain of the re-order activity, “Overall Structure Maps” and “Decision point analysis”.
Talking about one of the seven value stream mapping tools defined by Hines and Rich in 1997 — the Forrester Effect Map — as a business technique, which is widely used for conducting the analysis of the disturbance on the supply chain of the reorder activity, it’s important to remember that the Forrester's research in 1961 showed that demand could be erratic, illustrated with peaks and troughs commonplace within most of the organizations. These variations in requirements as well as supply are being amplified within the supply chain when the mentioned re-orders are made. The map is portrayed as a graph or scheme with a line, that shows the elements, such as shipments to customers, customer forecasts and orders for raw materials over a period of time shown on the X-Axis. The distortion between all of the inventory levels is shown as a result of the poor communication. It also shows an inability for scheduling things in a proper, accurate way. Thus, depending on how flat the lines are displayed, the more leaner the system is and so the more accurate the forecast can be.

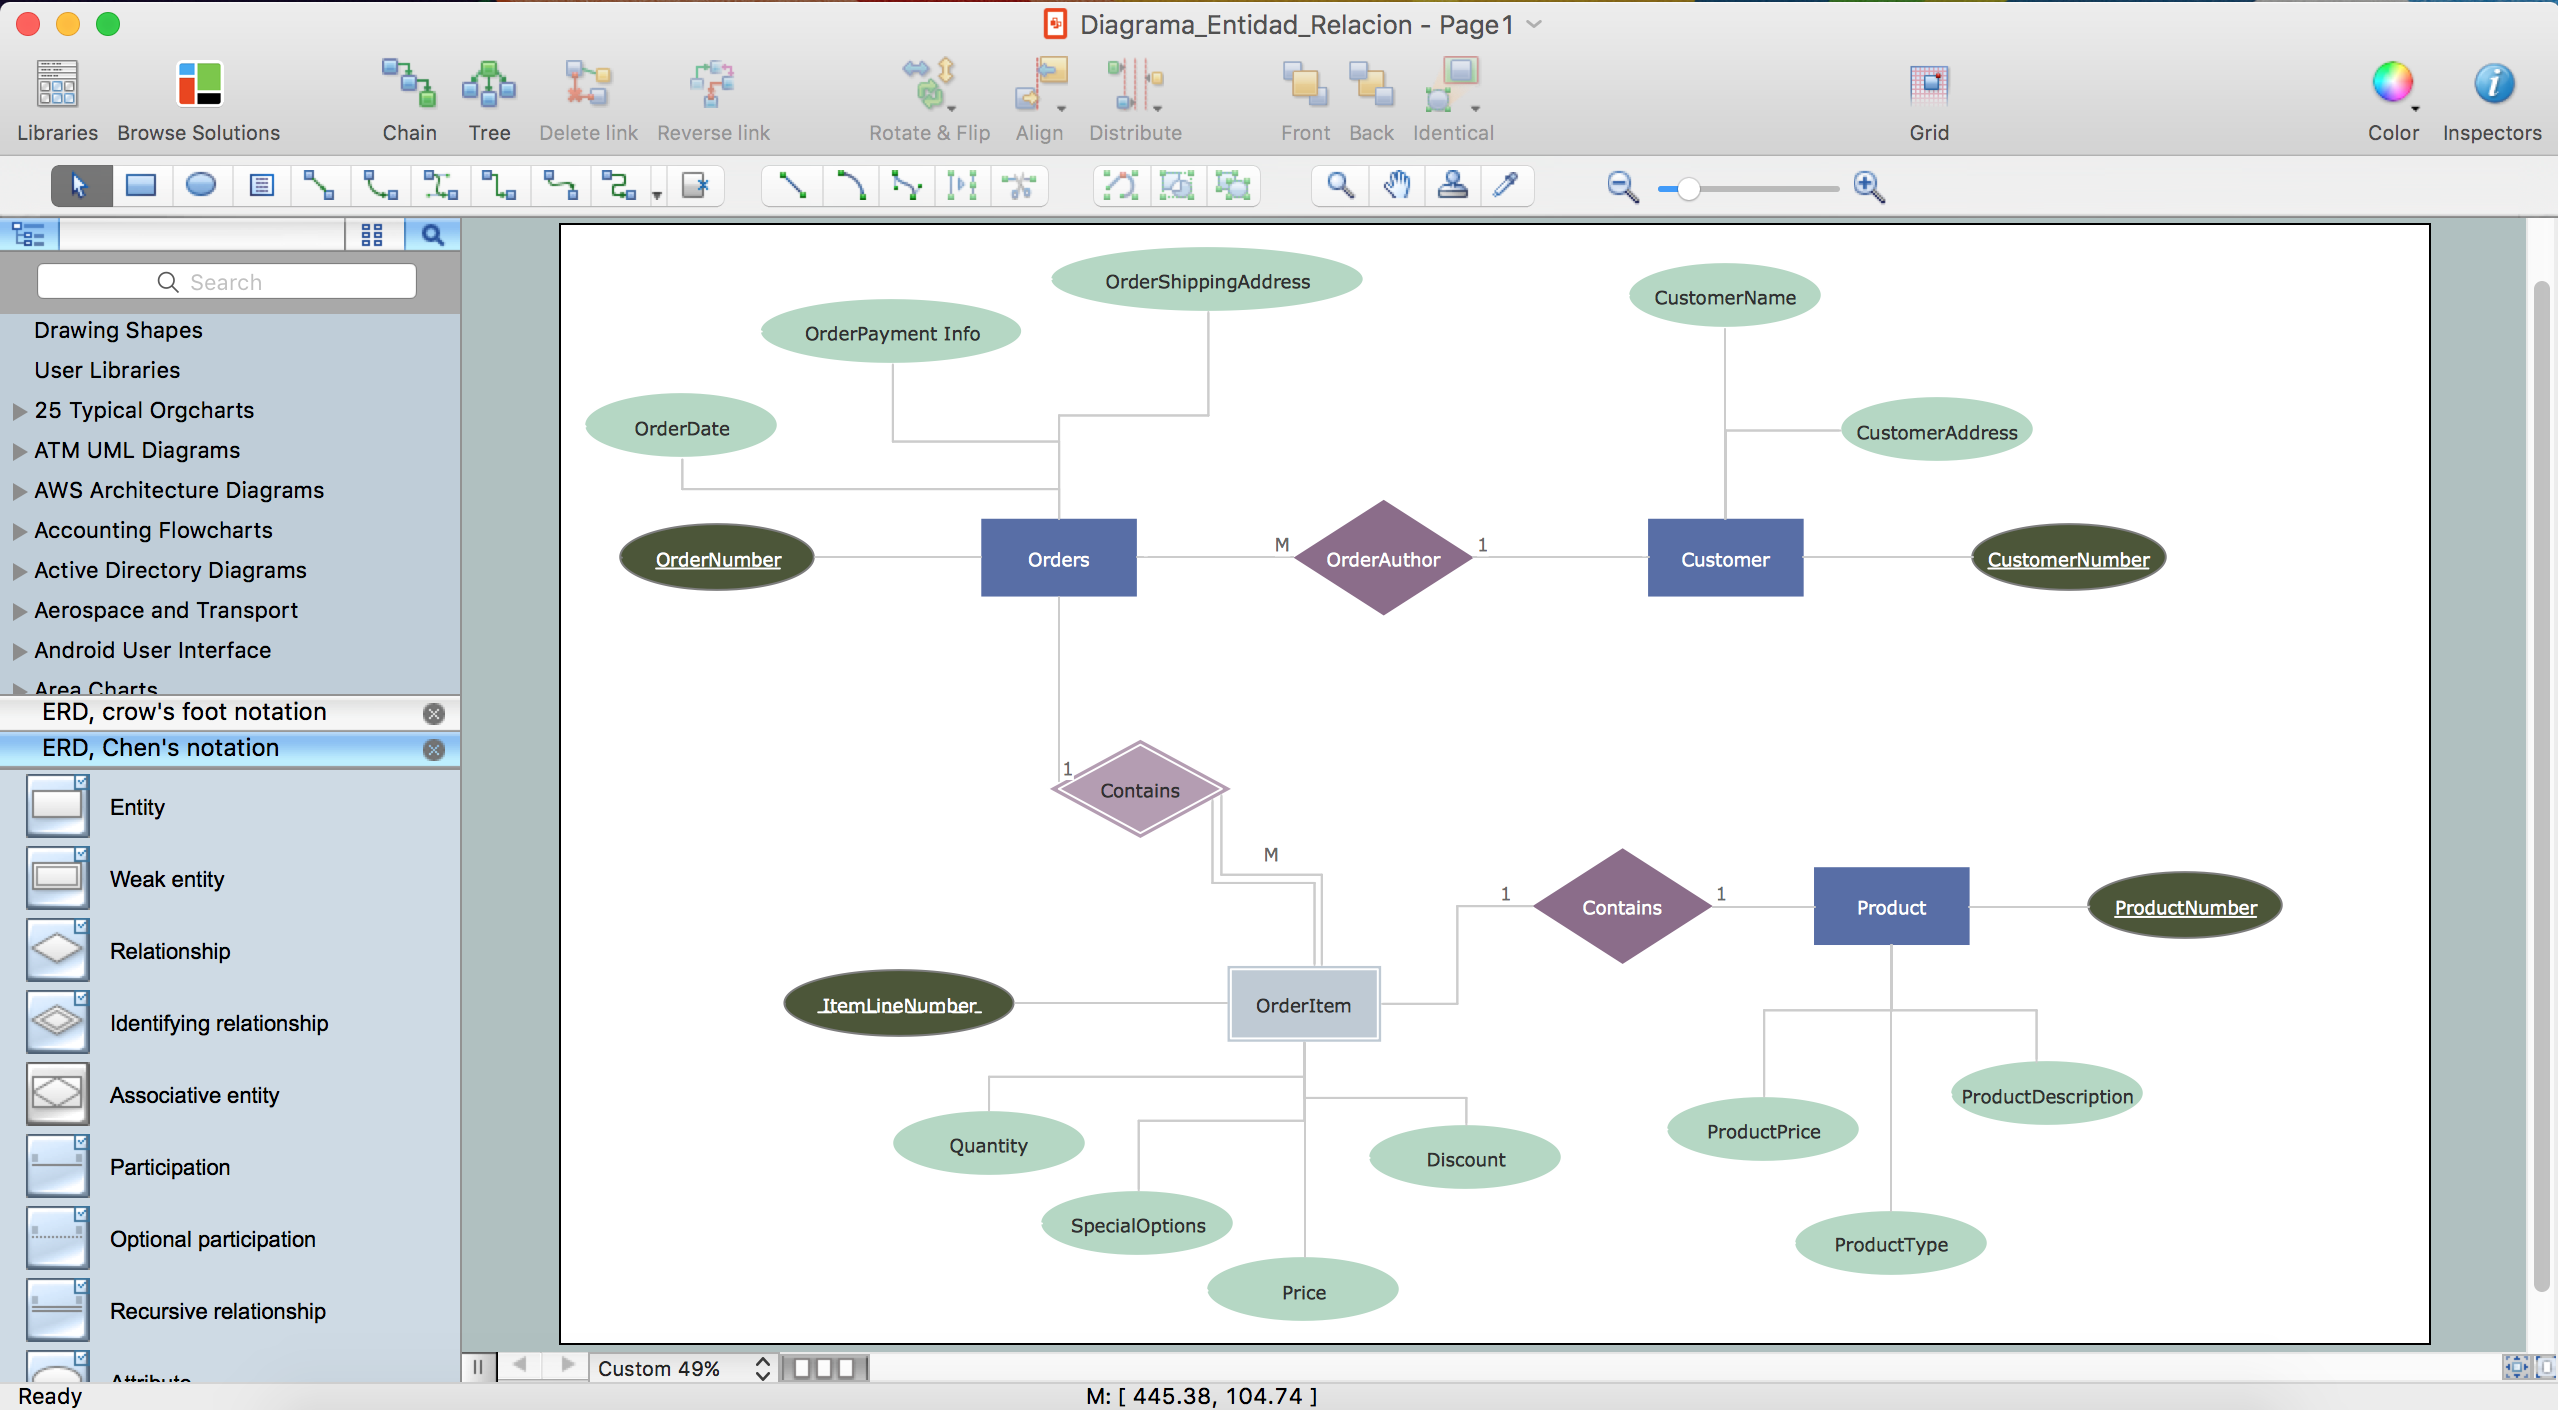
Pic.1 Value Stream Mapping Software for Mac
ConceptDraw DIAGRAM is known to be one of the best Value Stream Mapping Mac softwares as you can always create any graphical representations of any processes using this powerful tool, that helps in the diagnosis of the process efficiency. This application also allows different companies to develop the improved processes using the new “Value Stream Mapping solution”, which can be found and so downloaded from the ConceptDraw Solution Park on this site as well as from ConceptDraw STORE, extending the range of ConceptDraw DIAGRAM software into a business graphics tool that can be used in any document process in any organization.