Value Stream Analysis
The new Value Stream Mapping solution found in the ConceptDraw Solution Park continues to extend the range of ConceptDraw DIAGRAM into a business graphics tool that can be used to document processes in all organizations. This graphical representation of a process is a powerful tool for the Value stream analysis of process efficiency and allows companies to develop improved processes.

Pic.1 Value stream mapping diagram - Production-control.
Value Stream Maps are used in lean practice for analysis of manufacturing processes to identify the improvement opportunities.
See also Samples:
TEN RELATED HOW TO's:
An event-driven process chain diagram is a flowchart used in business process analysis. It evolved from Architecture of Integrated Information Systems (ARIS) and utilised in the business process improvement and analysis. It is also used to facilitate enterprise resource planning.
An EPC diagram is a complex flowchart that shows different business processes through various workflows. The workflows are seen as functions and events that are connected by different teams or people, as well as tasks that allow business processes to be executed.
ConceptDraw DIAGRAM is a software for making EPC diagrams that allows managers visually present business process models for making decisions for business.
Picture: How to Draw EPC Diagram Quickly
Related Solution:
A flowchart is a powerful tool for examining processes. It helps improving processes a lot, as it becomes much easier to communicate between involved people, to identify potential problems and to optimize workflow. There are flowcharts of different shapes, sizes and types of flowchart vary from quite basic process flowcharts to complex program flowcharts. Nevertheless, all these diagrams use the same set of special symbols like arrows to connect blocks, parallelogram to show data receiving or rectangles for showing process steps.
Basic flowcharts are used to represent a simple process algorithm. A basic flowchart notation consists of rectangles (business processes), arrows (the flow of information, documents, etc.). The same notation is used in items such as the "decision", which allow you to do the branching. To indicate the start of the entire business process and its termination can be used the "Terminator" element. The advantages of Basic Flowchart are simplicity and clarity. With it you can quickly describe the business process steps. Creating of Basic Flowchart does not require any special knowledge, as easily understand by employees with different levels of education and IQ.
Picture: Types of Flowchart: Comprehensive Overview
Related Solution:
ConceptDraw DIAGRAM is a Mac OS X and Windows software. Numerous vector stencils, samples and templates created by designers are included in the basic package. This is classic flowchart maker which exactly follows the industry standards using flowchart symbols geathered during a ten years into solution park.
Picture: Flowchart Software
Related Solution:
Use the ConceptDraw DIAGRAM software that has vector clipart of numerous cable connectors, examples, and templates for drawing different types of audio and video connection diagrams. Paste icon of the receiver or another device to page and layout sockets and plugs. Further connect plugs with each other, and now you have well-designed connection diagram.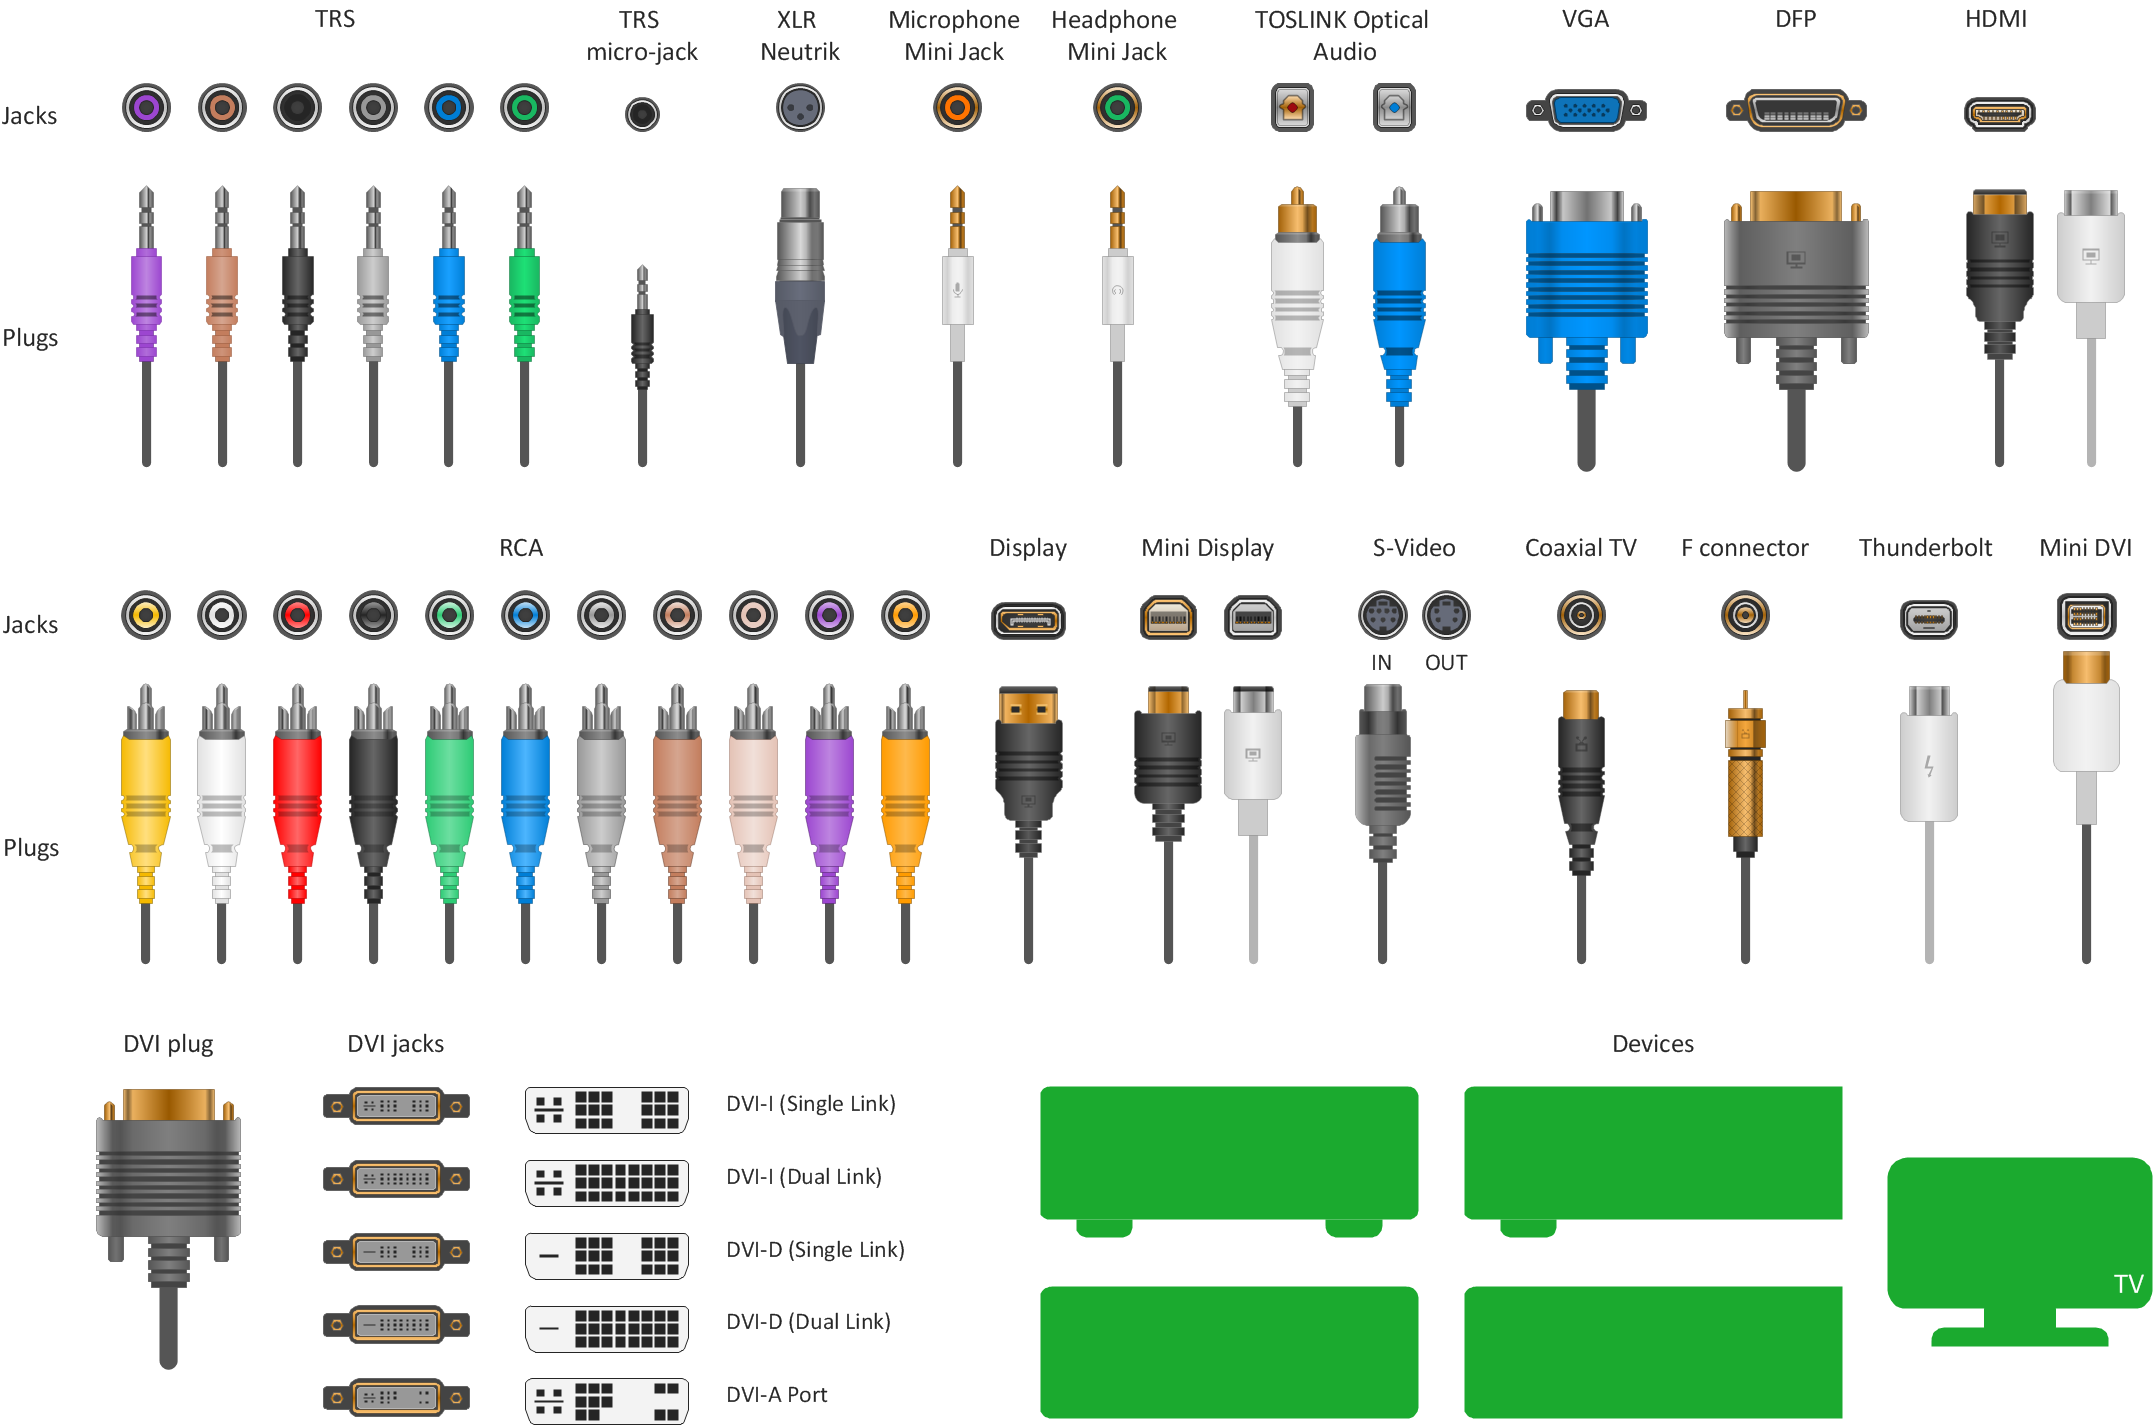
Picture: How to Make Audio and Video Connections
Related Solution:
An abstract representation is usually the first thing you will need while developing a database. To understand the ways that databases are structured, you should look through entity-relationship diagram examples and see the notations features and attributes. With an entity-relationship model you can describe a database of any complexity.
This Entity-relationship diagram is a tool for software developers. It enables every element of database to be managed, communicated and tested before release. This ERD was created using symbols advocated by Chen's notation. Because of a linguistic origin of the Chen’s notation, the boxes representing entities could be interpreted as nouns, and the relationships between them are in verb form, shown on a diagram as a diamond.
Picture: Entity Relationship Diagram Examples
Related Solution:
ConceptDraw DIAGRAM diagramming and vector drawing software extended with Sales Flowcharts solution from the Marketing area of ConceptDraw Solution Park offers the set of extensive tools for quick and easy drawing professional looking Sales Process Flowcharts.
Picture: Sales Process Flowcharts
Related Solution:
UML Object Diagram shows the structure of a modeled system at a specific time.
ConceptDraw Rapid UML solution delivers libraries contain pre-designed objects fit UML notation, and ready to draw professional UML Object Diagram.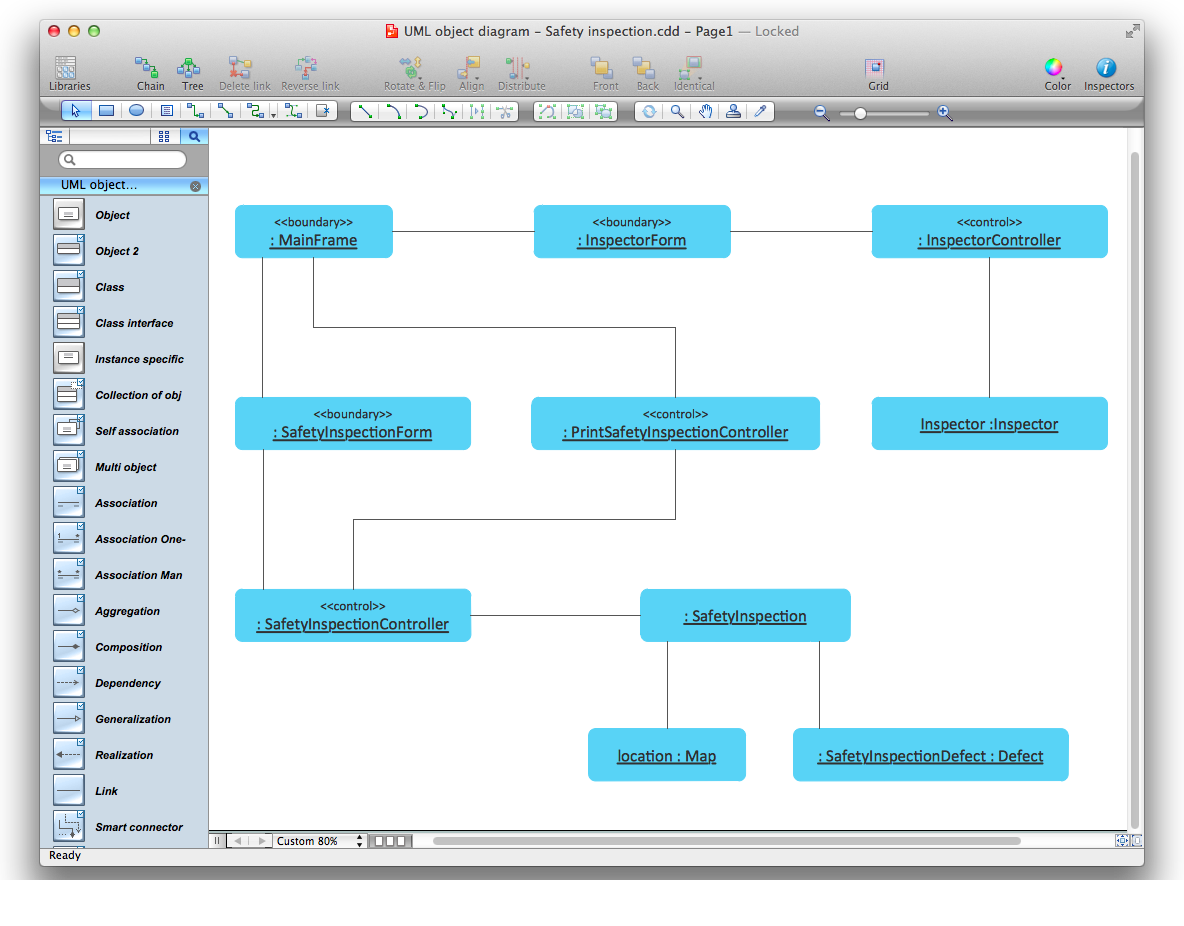
Picture: Diagramming Software for Design UML Object Diagrams
Related Solution:
ORM diagrams are a straightforward and incredibly effective way to explore domain concepts with your stakeholders.
Picture: ORM Diagram
A wireframe is a scheme of a future web page. Wireframe illustrates the web page structure, location and size of the main elements, as well as their interaction with the user. With such scheme designer defines the functionality of the page, not its appearance.
Picture: Wireframe Tools
Related Solution:
How do Fishbone diagrams solve manufacturing problems? Fishbone diagrams are successfully used in various fields of industries and manufacturing to analyze the set of possible causes and their effects. Fishbone diagram provides a process to clearly define the “Effect” and then puts you to thinking about the possible causes, based on the categories of common problems in manufacturing.
ConceptDraw DIAGRAM application extended with Fishbone Diagrams solution lets you construct Fishbone diagrams and represent globally recognized standards for manufacturing 6 Ms and 8 Ms.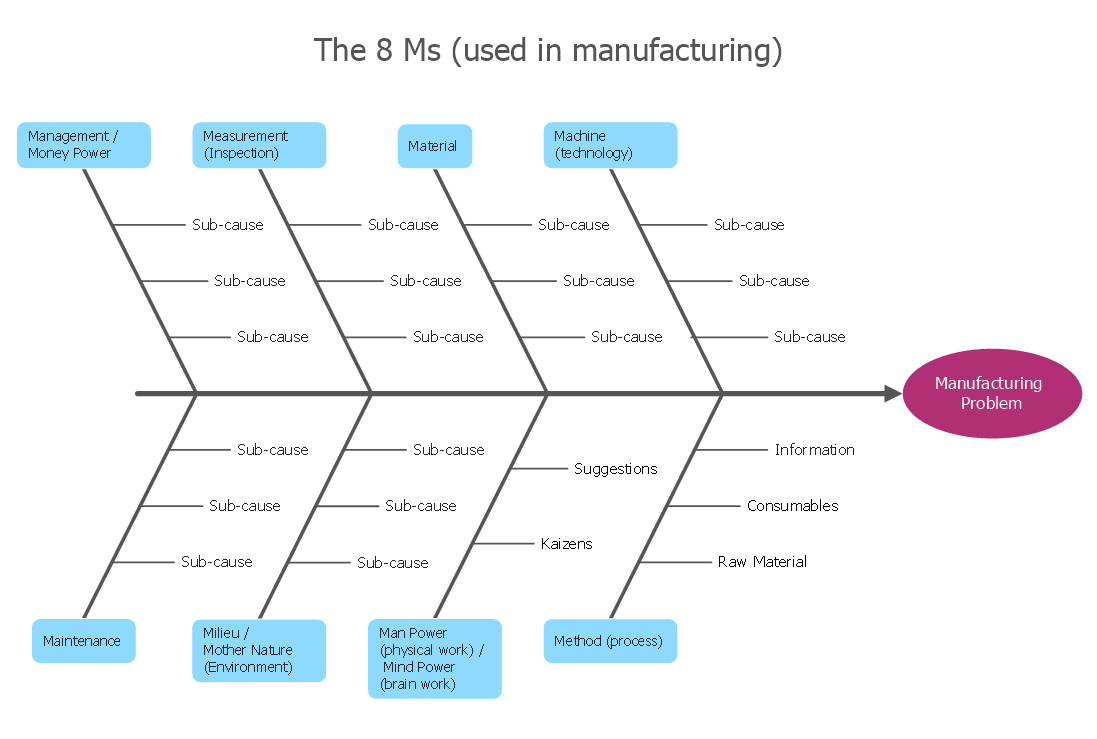
Picture: How Do Fishbone Diagrams Solve Manufacturing Problems
Related Solution:
ConceptDraw
MINDMAP 16