Lean Value Stream
Value Stream Mapping is a Lean Manufacturing tool that uses a flow diagram to document in great detail every step of a manufacturing process. This graphical representation of a process is a powerful tool used to visualize the entire lifecycle of a product production and delivery. Visual representation helps estimate process efficiency and focus on process improvements.
ConceptDraw DIAGRAM, extended with the Value Stream Mapping solution, is an excellent graphical tool for creating professional Value Stream Mapping presentations for your projects. This solution is available in the Quality Management area of the ConceptDraw Solution Park and can be downloaded directly here: Value Stream Mapping Solution. It is a powerful extension for ConceptDraw DIAGRAM software designed to document processes in any organization.
This tool is intended for creating high-quality visuals, acting as a specific type of flowchart that describes the entire product cycle from raw materials to final delivery. It helps visually identify waste and process timing. Visual documenting takes into account three flows as three general steps for preparing visual docs:
(1) Information Flow: Describes how orders are communicated (data exchange, steps, and scheduling).
(2) Product Flow: Describes product production steps and processing phases.
(3) Timeline: Describes the timelines of cycles, including processing, waiting, and transportation, focusing on Processing and Waiting Time (Value-Added Time and Queue Time). How to Draw a Value Stream Map: Step-by-Step
Step 1: Define the Scope and Initial Setup
Start by identifying the product family and defining the scope of the process from the initial customer order to the final delivery. Open the Value Stream Mapping solution in ConceptDraw DIAGRAM and select the appropriate template. Place the primary icons for customers, suppliers, and the production process on your canvas.
Step 2: Map the Flow of Information and Materials
Use the connector tools to draw the flow of materials and information, ensuring each stage is clearly linked to reflect the actual movement of goods and data across your facility. This establishes the structural backbone of your diagram.
Step 3: Analyze Metrics and Visualize the Timeline
Add "data boxes" beneath each process step to record key metrics such as cycle time and uptime. Finally, add the "timeline" at the bottom of the diagram to contrast Value-Added Time against Non-Value-Added (queue) time. This final step allows you to identify bottlenecks and areas for waste reduction.
The Impact of Your Value Stream Map
The final result of your mapping is a comprehensive visual baseline that transforms abstract process data into actionable insights. By clearly documenting the current state, you gain the ability to pinpoint exact locations of waste and non-value-added activities that typically remain hidden in standard documentation. This visual clarity enables teams to foster data-driven discussions, align on improvement priorities, and ultimately design a more efficient "future state" that significantly enhances productivity and reduces lead times.
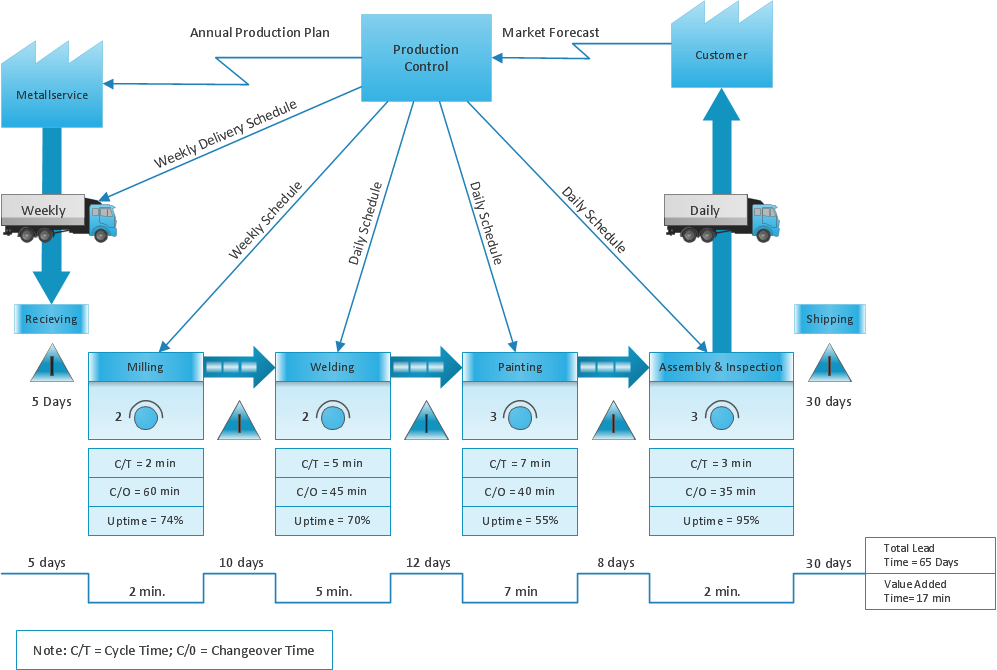
Pic.1 Value stream map — Template
This template of Value Stream Map is contained in the Value Stream Mapping solution located in the ConceptDraw Solution Park. Use it to draw VSM diagrams with ConceptDraw DIAGRAM in your lean manufacturing practice.
See also Samples: