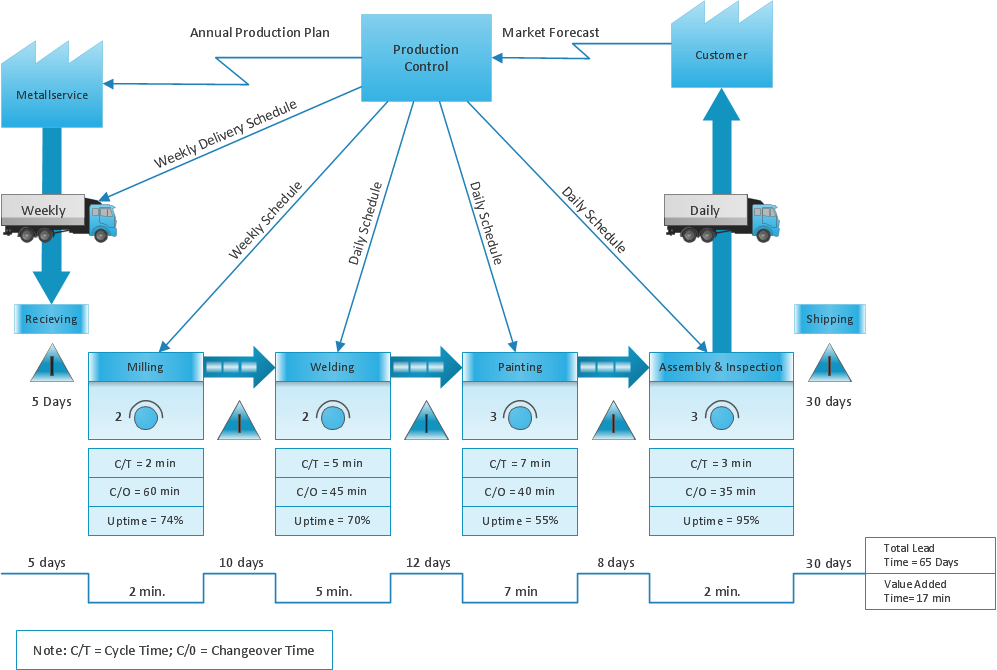
Value stream mapping is used in lean enterprise practice to analyze and identify the process improvement opportunities that are available.
NINE RELATED HOW TO's:
Accounting flowchart is a pictorial way to represent the flow of data in an organization and the flow of transactions process in a specific area of its accounting or financial department. Accounting Flowcharts solution contains the full set of standardized accounting flowchart symbols which will help you design in minutes various types of Accounting Flowcharts including such popular diagrams which represent the whole accounting process: Purchasing Flowchart, Receiving Flowchart, Voucher Payable Flowchart, Treasurer Flowchart, Payment Flowchart.
Picture: Accounting Flowchart Purchasing Receiving Payable and Payment
Related Solution:
Diagramming is an astonishing way to visualize business processes. The list of the most common business process flowchart symbols is quite long starting from basic flowcharts, continuing with SIPOC diagrams. Business process modeling was never easier than now, with special ConceptDraw Business Process Mapping solution.
To carry out all professional standard requirements for business processes mapping, it is necessarily to follow the special graphical notations. ConceptDraw Business Process Mapping solution offers an exhaustive suite of tools to aid business process mapping. There are three vector libraries SIPOC Diagrams, Business Process Flowcharts, and Swim Lanes that contains totally more than 50 symbols of standard BPM notations. This is all that professionals need to effectively evaluate and manage quality in business processes.
Picture: Business Process Flowchart Symbols
Related Solution:
The Event-driven Process Chain ( EPC ) Diagrams allows users to present business process models in terms of work flows.
The EPC diagram can shows various vayes how to reach positive company performance.
Picture: EPC - Business Processes in Terms of Work Flows
Related Solution:
Flow diagrams is a diagram used for structuring complex system and visually representing a flow and interactions of elements in a system.
ConceptDraw DIAGRAM diagramming and vector drawing software enhanced with Flowcharts Solution from the Diagrams Area of ConceptDraw Solution Park is perfect for easy drawing professional looking Flow Diagrams.
For drawing Flow Diagrams the Flowcharts Solution provides: 2 libraries with commonly used predesigned vector objects - Flowchart library and Flowcharts Rapid Draw library; collection of Flow Diagrams samples; Basic Flowchart template.
Picture: Flow Diagrams
Related Solution:
The Flowcharts are widely used in engineering, architecture, science, analytics, government, politics, business, marketing, manufacturing, administration, etc.
Picture:
Flowchart of Products
Flowchart Examples
Related Solution:
Subway infographic design elements of MetroMap and ConceptDraw software tools.
Picture: Subway infographic design elements - software tools
Related Solution:
When trying to figure out the nature of the problems occurring within a project, there are many ways to develop such understanding. One of the most common ways to document processes for further improvement is to draw a process flowchart, which depicts the activities of the process arranged in sequential order — this is business process management. ConceptDraw DIAGRAM is business process mapping software with impressive range of productivity features for business process management and classic project management. This business process management software is helpful for many purposes from different payment processes, or manufacturing processes to chemical processes. Business process mapping flowcharts helps clarify the actual workflow of different people engaged in the same process. This samples were made with ConceptDraw DIAGRAM — business process mapping software for flowcharting and used as classic visio alternative because its briefly named "visio for mac" and for windows, this sort of software named the business process management tools.
This flowchart diagram shows a process flow of project management. The diagram that is presented here depicts the project life cycle that is basic for the most of project management methods. Breaking a project into phases allows to track it in the proper manner. Through separation on phases, the total workflow of a project is divided into some foreseeable components, thus making it easier to follow the project status. A project life cycle commonly includes: initiation, definition, design, development and implementation phases. Distinguished method to show parallel and interdependent processes, as well as project life cycle relationships. A flowchart diagram is often used as visual guide to project. For instance, it used by marketing project management software for visualizing stages of marketing activities or as project management workflow tools. Created with ConceptDraw DIAGRAM — business process mapping software which is flowcharting visio alternative or shortly its visio for mac, this sort of software platform often named the business process management tools.
Picture: Process Flowchart: A Step-by-Step Comprehensive Guide
Related Solution:
Preventive Action - ConceptDraw OFFICE suite is a software for the Preventive Action making. The Seven Management and Planning Tools solution is a set of such tools for problems preventive actions via investigating of the core problem.
Skilled use of these diagrams makes collaborative teamwork both more engaging and more effective.
Picture: Preventive Action
Event-Driven Process chain Diagrams for improvement throughout an organisation. Best software for Process Flow Diagram. The Event-driven Process Chain (EPC) Diagrams allows managers to plan processes and resources.
Picture: Business process Flow Chart — Event-Driven Process chain (EPC) diagrams
Related Solution: