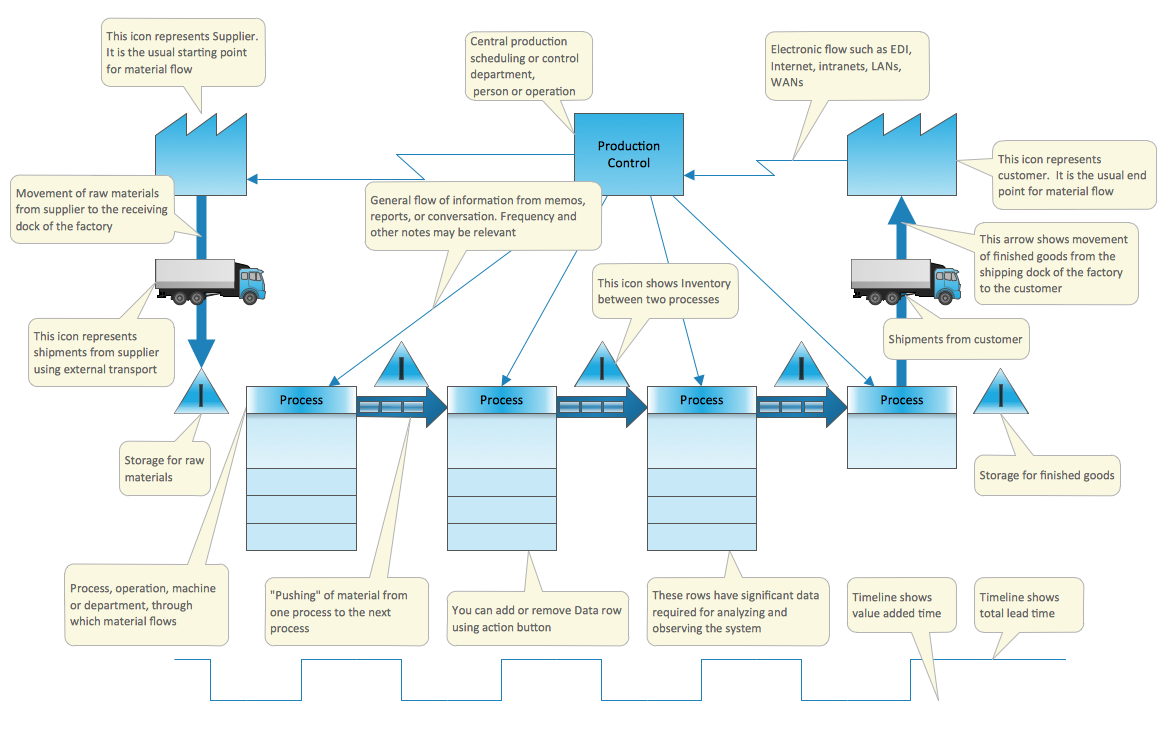
Example 1. Value Stream Mapping Template
This Value Stream Map template included in the Value Stream Mapping Solution explains the meanings of the VSM design elements. You can simply fill it to get a professional-looking Value Stream Map in a few minutes.

Example 2. Value Stream Map Sample
This sample was created in ConceptDraw DIAGRAM software on the base of the Value Stream Mapping template and shows how customer value is created in the steps of manufacturing, production control, and shipping processes. An experienced user spent 15 minutes creating this sample.
Use the Value Stream Mapping solution for ConceptDraw DIAGRAM Solution Park to create your own professional-looking Value Stream Maps quick, simply and effectively.
All source documents are vector graphic documents. They are available for reviewing, modifying, or converting to a variety of formats (PDF file, MS PowerPoint, MS Visio, and many more graphic formats) from the ConceptDraw STORE. The Value Stream Mapping solution is available for all ConceptDraw DIAGRAM users.
See also Samples:
TEN RELATED HOW TO's:
Developing a software project supposes architecture first. To make it proper, you can use data flow diagram model in your current project.
The data flow diagram represents the Model of small traditional production enterprise that is made using Yourdon and Coad notation. It shows how the data is transfered through a process. According to the notation of Yourdon and Coad a process is represented by circles and data stores are drawn using parallel lines. This DFD was created using the ConceptDraw Data Flow Diagrams solution. Using this solution one can visualize data flow accordingly to the rules of two basic notations used for data flow modeling.
Picture: Data Flow Diagram Model
Related Solution:
Target Diagram is a convenient and visual way of presentation information which is popular and widely used in marketing, business and economics. ConceptDraw DIAGRAM diagramming and vector drawing software extended with Target and Circular Diagrams solution from the Marketing area of ConceptDraw Solution Park is ideal for fast and easy drawing a Target Diagram.
Picture: Target Diagram
Related Solution:
ConceptDraw MINDMAP is a powerful business and personal productivity software application that provides visual organization and access to information for individuals and organizations.
Picture: ConceptDraw MINDMAP :Brainstorming, Mind Mapping for macOS and Windows
The Internet is a giant computer network which connects computers all over the world. It is integral part of human society and business. But the serious question for network engineers, designers, lawmakers and enforcers is the need for protect the Internet networks from the Internet crimes, hacking and attacks. There are quite a number of hardware, software and physical methods of protection against them.
The samples you see on this page were created in ConceptDraw DIAGRAM using the tools of Network Security Diagrams Solution for ConceptDraw DIAGRAM software. They show protection networks with Firewalls and other network security devices.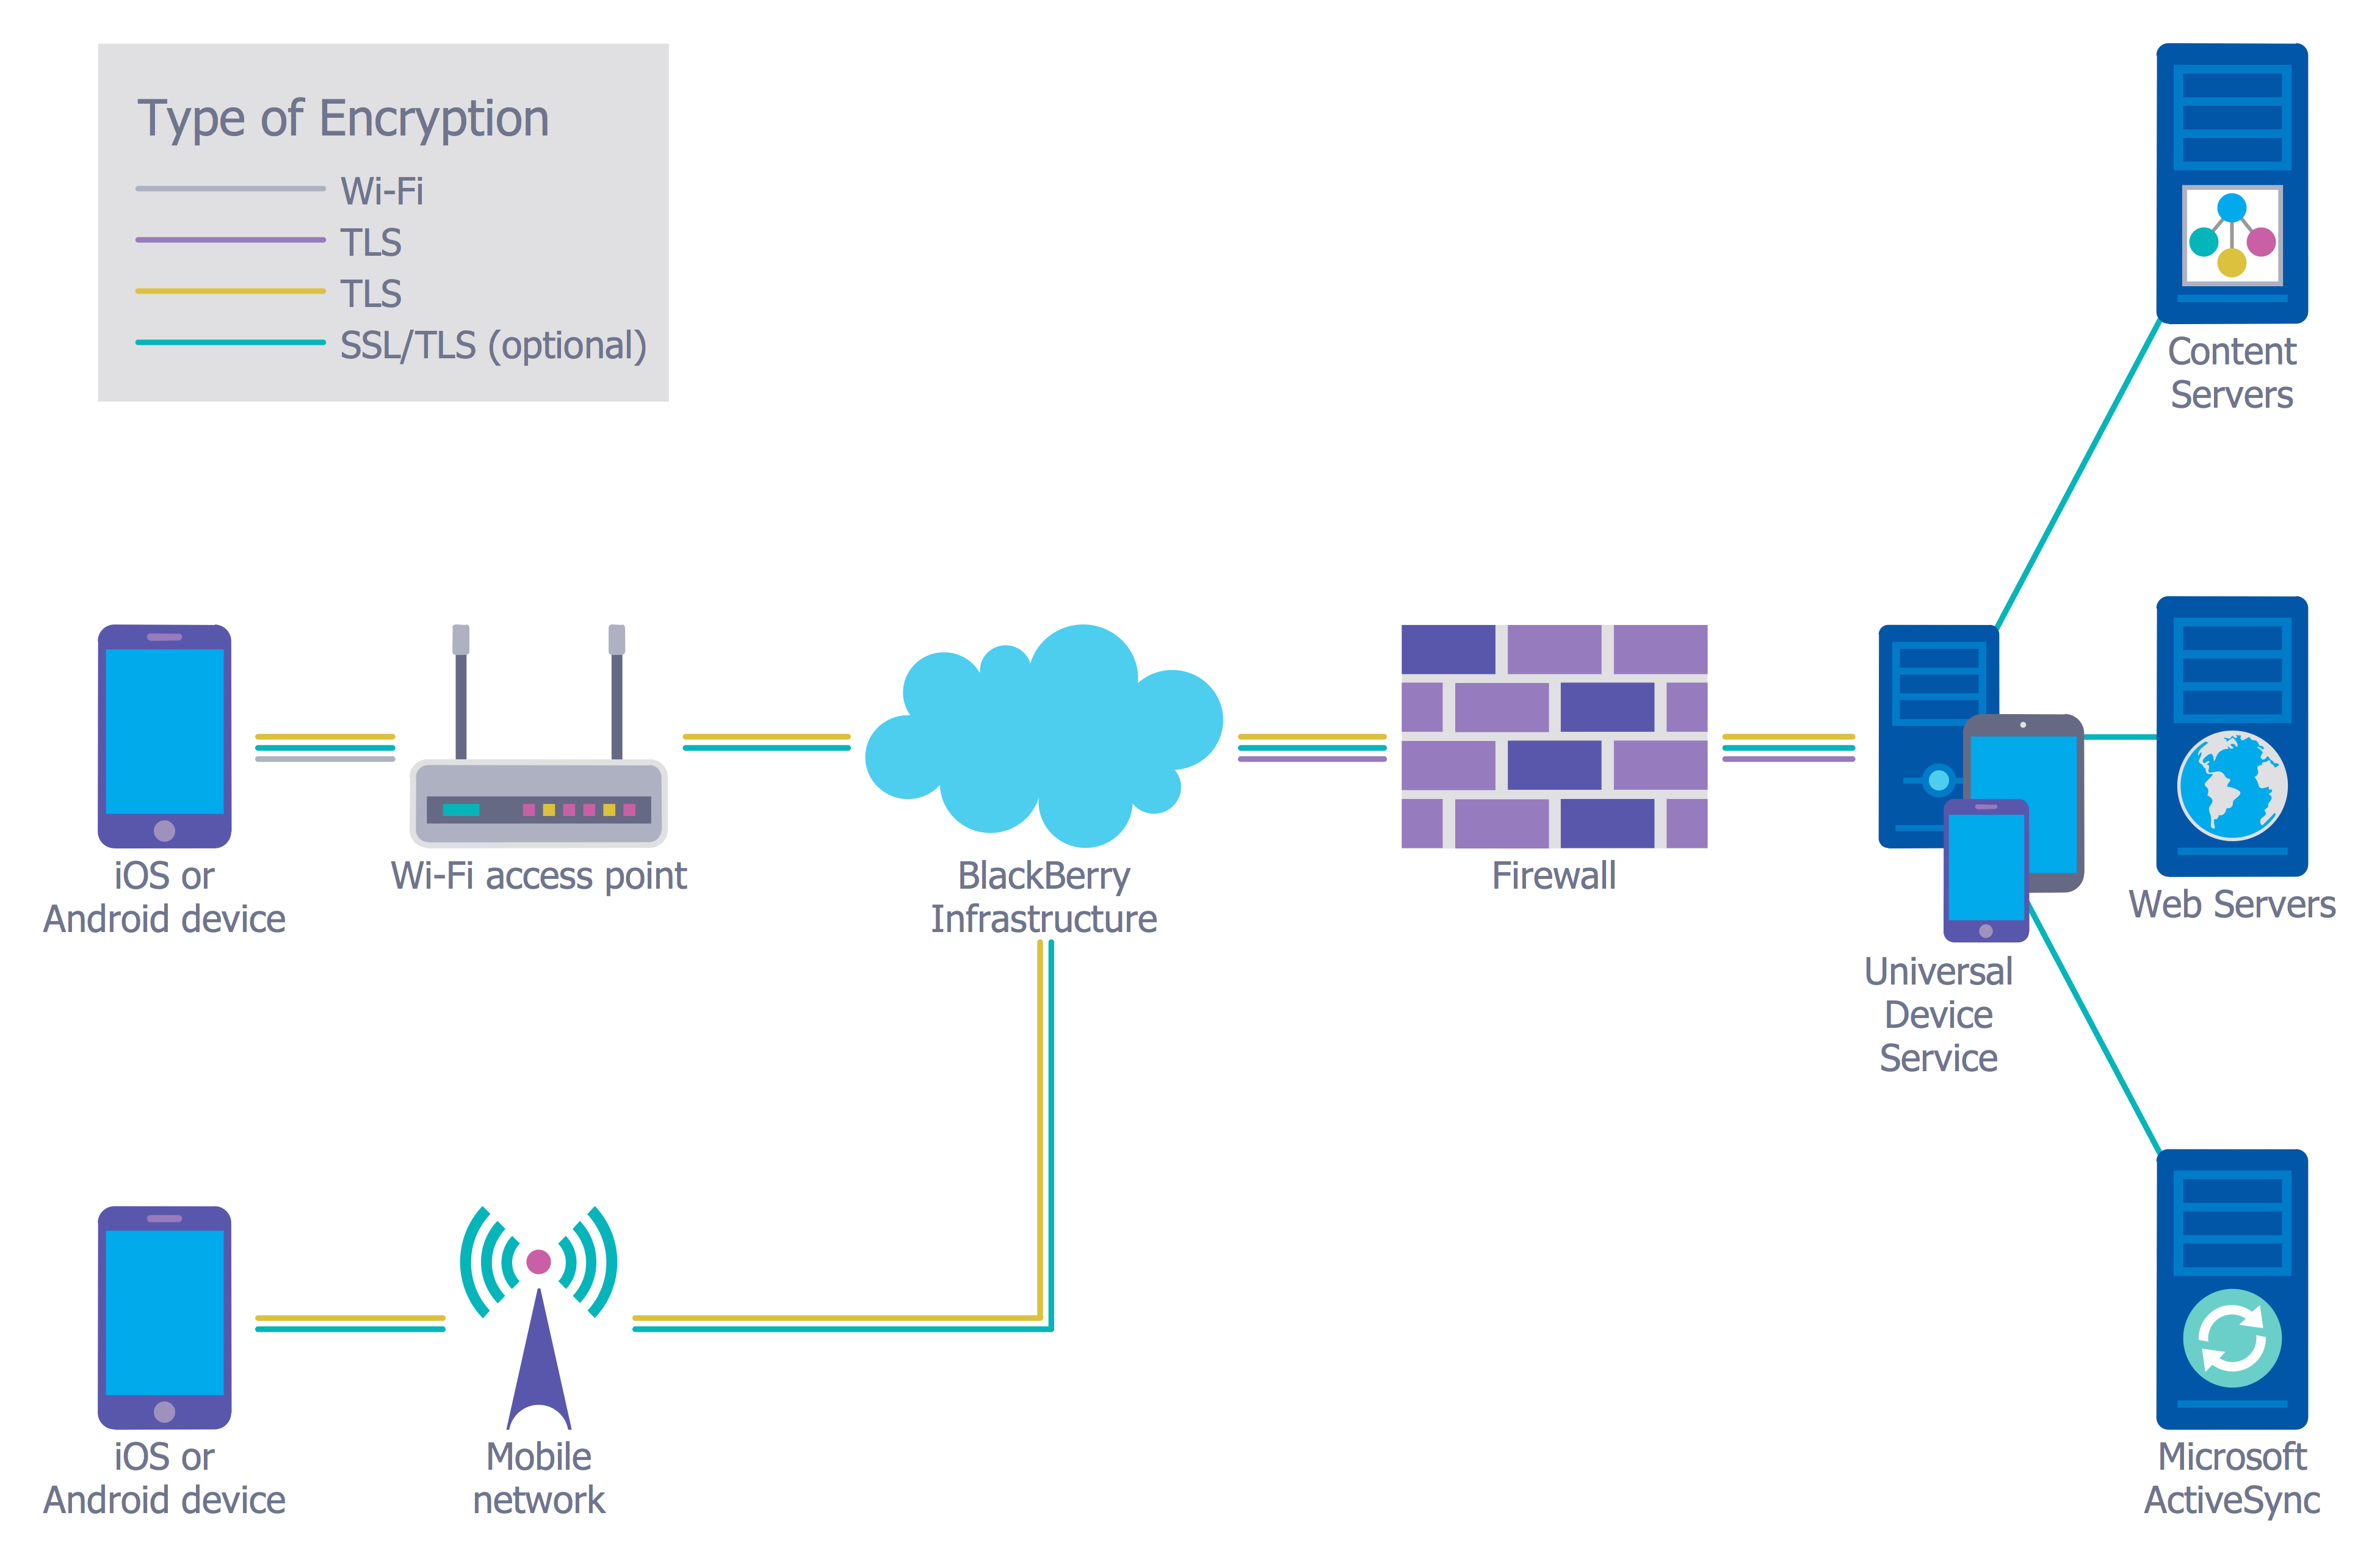
Picture: Network Security
Related Solution:
ConceptDraw solution Computer and Networks provides Interactive Voice Response samples, templates and library of 35 vector stencils for drawing the IVR network diagrams.
Use ConceptDraw DIAGRAM diagramming and vector drawing software enhanced with solution Computer and Networks to visualize the logical and physical structure of IVR systems for inbound and outbound call centers and voice mail systems.
Picture: Interactive Voice Response Network Diagram
When you need a drawing software to create a professional looking cross-functional charts, ConceptDraw with its Arrows10 Technology - is more than enough versatility to draw any type of diagram with any degree of complexity.
Use templates with process maps, diagrams, charts to get the drawing in minutes.
Picture: Cross-Functional Process Map Template
Electrical maintenance - troubleshooting electrical circuit.
The diagrams are a big help when workers try to find out why a circuit does not work correctly.
26 libraries of the Electrical Engineering Solution of ConceptDraw DIAGRAM make your electrical diagramming simple, efficient, and effective. You can simply and quickly drop the ready-to-use objects from libraries into your document to create the electrical diagram.
Picture: Electrical Symbols — Maintenance
Related Solution:
Beginning from the 19th century, people tried to tame electricity. Nowadays, electrical engineering covers a wide range of applications starting from providing illumination in our homes to developing space technologies. Considering the fact that every project needs documentation, engineers use electrical diagram software to develop these projects. Standard electrical symbols of electrical components are recognizable all around the world.
This illustration represents the 26 libraries that are supplied by the ConceptDraw Electrical Engineering solution. The Electric Engineering libraries contains about a thousand objects enabling you to draw various charts depicting electrical connections and circuits, along with schemes of different equipment and devices. The electric engineering libraries delivered with ConceptDraw solution meet the standards adopted in the image to electrical circuits. So they can be used by professionals along with amateurs in electrical engineering.
Picture: Electrical Diagram Software
Related Solution:
In electronics, a diode is a two-terminal electronic component that conducts primarily in one direction (asymmetric conductance); it has low (ideally zero) resistance to the flow of current in one direction, and high (ideally infinite) resistance in the other. A semiconductor diode is a crystalline piece of semiconductor material with a p–n junction connected to two electrical terminals. Today, most diodes are made of silicon, but other semiconductors such as selenium or germanium are sometimes used.
26 libraries of the Electrical Engineering Solution of ConceptDraw DIAGRAM make your electrical diagramming simple, efficient, and effective. You can simply and quickly drop the ready-to-use objects from libraries into your document to create the electrical diagram.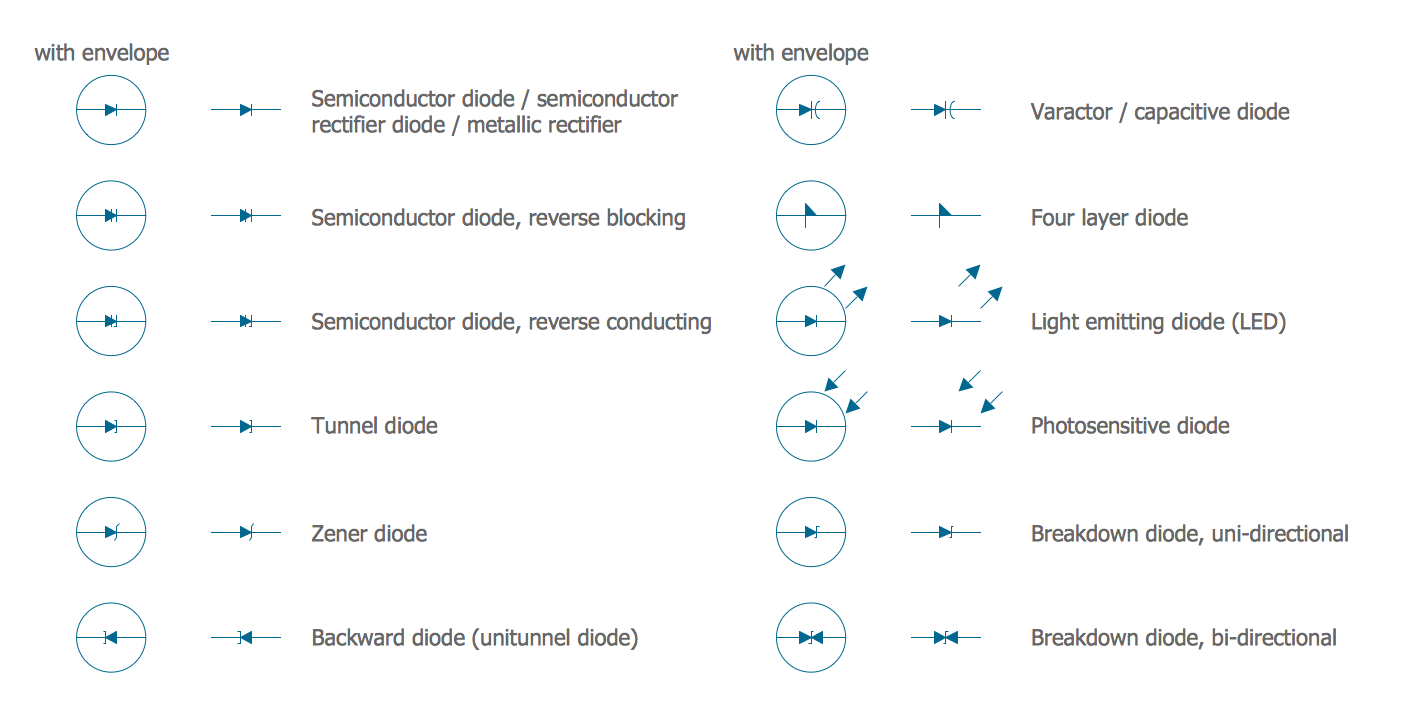
Picture: Electrical Symbols — Semiconductor Diodes
Related Solution:
ConceptDraw Value Stream Maps visualize for a manufacturing plant the material and information flow.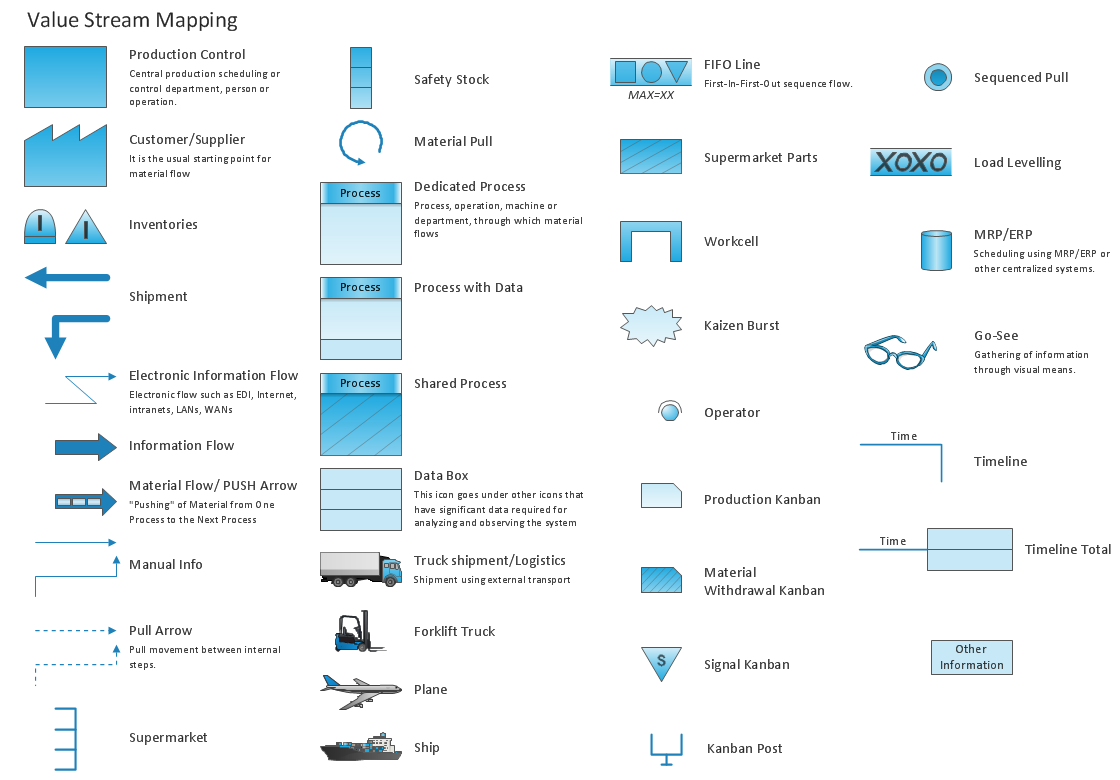
Picture: Value Stream Maps Visualize
Related Solution:
