
Example 1. Histogram - Age of Presidential Acsension
Use of special software such as ConceptDraw DIAGRAM is the easiest way of drawing a Histogram. Seven Basic Tools of Quality Solution provides 9 libraries with variety of predesigned vector objects, among them is a Histogram library which contains ready-to-use histogram objects.
Now, to design a Histogram, you need only choose the appropriate object from the Histogram library and simply fill it with your own data.

Example 2. Histogram Library Design Elements
Another way is to use as the basis one of the samples offered by the Seven Basic Tools of Quality Solution in ConceptDraw STORE.

Example 3. Seven Basic Tools of Quality Solution in ConceptDraw STORE
Each sample included in Seven Basic Tools of Quality solution for ConceptDraw DIAGRAM is carefully thought-out example, perfect base for drawing your own chart, diagram or histogram and excellent source of inspiration!

Example 4. Histogram - Frequency Allocation Diagram
The samples you see on this page were created in ConceptDraw DIAGRAM software using the Seven Basic Tools of Quality Solution and demonstrate the Histograms. These examples successfully demonstrate solution's capabilities and professional results you can achieve. An experienced user spent 10-15 minutes creating each of them.
Use the Seven Basic Tools of Quality Solution for ConceptDraw DIAGRAM software to create your own professional looking Histogram of any complexity quick, easy and effective.
All source documents are vector graphic documents. They are available for reviewing, modifying, or converting to a variety of formats (PDF file, MS PowerPoint, MS Visio, and many other graphic formats) from the ConceptDraw STORE. The Seven Basic Tools of Quality Solution is available for all ConceptDraw DIAGRAM
TEN RELATED HOW TO's:
Affinity Diagram Software - ConceptDraw DIAGRAM is a powerful diagramming and vector drawing software that allows quick, easy and effective create the Affinity Diagrams.
Seven Management and Planning Tools solution from the Business Productivity area of ConceptDraw Solution Park provides templates, samples and ready-to-use vector stencils that will help you design the professional looking Affinity Diagrams in a few moments.
Picture: Affinity Diagram Software
Related Solution:
ConceptDraw DIAGRAM extended with IDEF0 Diagrams solution from the Software Development area of ConceptDraw Solution Park is a powerful diagramming and vector drawing IDEF0 software. All IDEF0 diagrams created in ConceptDraw DIAGRAM are vector graphic documents and can be reviewed, modified and converted to MS Visio XML format. To obtain the IDEF0 Visio documents from ConceptDraw DIAGRAM documents use the wide export possibilities of ConceptDraw DIAGRAM.
Picture: IDEF0 Visio
Related Solution:
Use ConceptDraw DIAGRAM diagramming and business graphics software for drawing your own PM life cycle flow charts.
Picture: Program to Make Flow Chart
Related Solution:
The audit process is a definite set of steps used in a financial, operational or compliance audit. This set of steps depends of the audit services company. The auditing process usually includes three main steps: planning, fieldwork and reporting.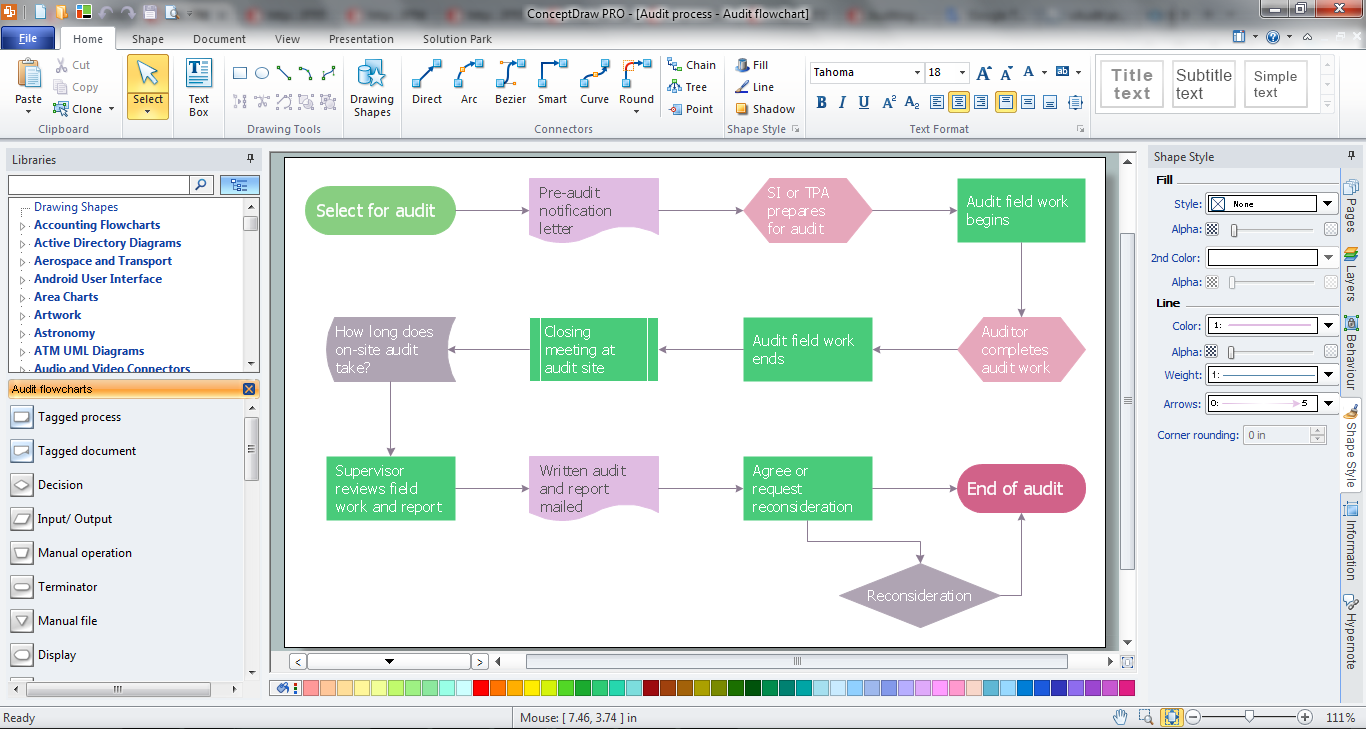
Picture: Audit Process
Related Solution:
If you are just a beginner in drawing flowcharts, it may seem that a sheet of paper and a pen are just enough. However, at the time you would want to share your results, diagramming applications would suite you better. it’s very easy to create diagrams that way and to discover new kinds of flowcharts.
The huge collection of sample ConceptDraw diagrams, charts, illustrations and other types of business drawings includes a wide range of business themes. A huge number of graphic images of ConceptDraw documents is divides on business application areas according to business-oriented solutions for which they were made.Here is a short visual list of samples of flowcharts, process diagrams, UML models, management charts, computer network diagrams, maps, infographics, illustrations, etc. In short, each ConceptDraw solution is accompanied with at least ten samples representing some particular examples of the application of the given chart.
Picture: Applications
Fishbone, Ishikawa or Cause and Effect diagram helps understand the reasons of completed or potential actions by structuring their causes in smaller categories. Also, one can use it to see how the contributing factors are related to each other. In everyday company routine, a Cause and Effect diagram is helpful with a number of regular activities like brainstorming, project management, and problem solving.
How to Construct a Fishbone Diagram? Construction a Fishbone diagram in professional diagramming software ConceptDraw DIAGRAM is more easy than you think. Just use the predesigned vector elements from the Fishbone Diagrams library for Fishbone Diagrams solution or one of plenty Fishbone templates and examples, and you will get a Cause and Effect diagram in minutes.
Picture: How to Construct a Fishbone Diagram
Related Solution:
Matrix organizational structure is one of the main forms of structures which is actively used by organizations to carry forth the functions of a company visually and effectively.
Now we have ConceptDraw DIAGRAM diagramming and vector drawing software extended with 25 Typical Orgcharts solution from the Management area of ConceptDraw Solution Park which will help easy represent matrix organizational structure of any degree of complexity.
Picture: Matrix Organization Structure
Related Solution:
Fishbone diagram, often reffered as Cause and Effect diagram or Ishikawa diagram, is one of the basic and the most effective tools for problems solving. It is a way of graphical identifying, structuring and exploration the root causes of a problem for determining effective decision.
ConceptDraw DIAGRAM enhanced with Fishbone Diagrams solution is a professional fishbone problem solving tool which helps you draw Business Productivity diagram, Cause and Effect, Fishbone, Ishikawa Diagrams to solve problems at your business.
Picture: Fishbone Problem Solving Tool
Related Solution:
The vector stencils library IDEF0 Diagram from the solution IDEF0 Diagrams contains specific IDEF0 diagram symbols such as arrow symbols and entity symbols for ConceptDraw DIAGRAM software.
Picture: IDEF0 Diagram
Related Solution:
The Line Graphs solution from Graphs and Charts area of ConceptDraw Solution Park contains a set of examples, templates and design elements library of line and scatter charts. Use it to draw line and scatter graphs using ConceptDraw DIAGRAM diagramming and vector drawing software for illustrating your documents, presentations and websites.
Picture: Line Chart Examples
Related Solution:


