Flow Map: A Step-by-Step Guide
Visualizing Movement and Direction
Visual flow mapping with the help of Flowcharts Solution is always more convenient as all the solutions from ConceptDraw STORE were developed especially for simplifying all ConceptDraw DIAGRAM users' work by making the needed drawings within only a short period of time, so there is no need to make the maps and diagrams from a scratch anymore, but to use the previously based examples.
The flow maps as well as flow diagrams are basically a mix of drawings, such as maps and flow charts, used for showing the movement of different objects, “traveling” from one location to another. An example can be migrating people going from one country to another. Also, an example can be some goods being traded and so delivered from their producer to the warehouse and then from the warehouse to the port, later to the ship, and eventually to their port of destination.
Such flow maps can be always used for showing the movement of whatever is needed, including tangible things (products, natural resources, people, weather, and others). It is also always possible to illustrate the intangible things: for example, talent, credit of goodwill or some know-how. Flow maps are very useful for indicating such things as what can flow, move, migrate, etc., illustrating the direction of the flow moving with a note of its source, as well as its destination.

Example 1. Flow Map — Project Management Life Cycle
Introduction to Flow Maps: Definition and Overview
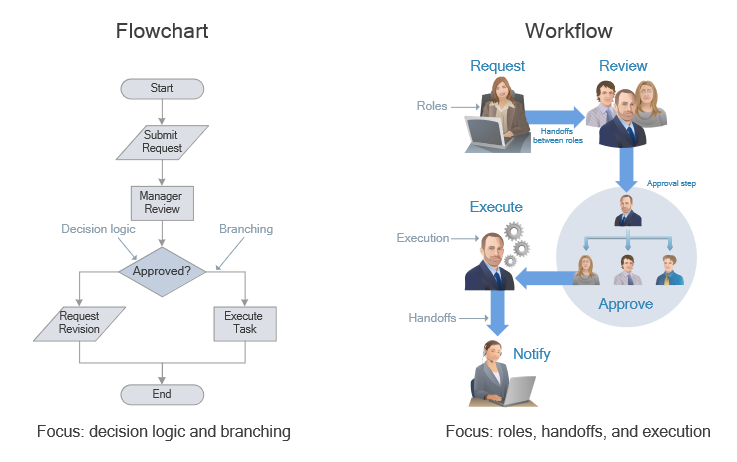
The flow diagrams are those used for structuring, as well as ordering a complex system. Sometimes they are used for revealing the underlying structure of the elements, as well as their interaction. The terms “flow diagram”, “flow map” and “flow charts” are almost identical. They are all the drawings made for visually displaying the interrelated information (e.g., steps in some process, stages, events, functions, etc.) in some organized structure in either sequential or chronological way. The flow maps, as well as the flow diagrams, are simply the graphic representations of some physical flow or some route of materials, paperwork, people, vehicles, etc. associated with some process, investigation, or procedure plan.
You can always also describe the way something is being transferred, flowing, or transported, as well as mentioning the general information about things that are flowing, as well as the way they are flowing with the aid of previously mentioned flow diagrams. Being different from route maps for a reason of showing more than just the paths and the roads from one point to another, there are many kinds of flow maps, such as baker flow maps of the fluid flows, blood flow maps used in neuroimaging, etc.
Process flow diagram is one of the kinds of flow maps used for representing some particular manufacturing process. You can always make any needed flow map, such as a Traffic Flow Map with the help of ConceptDraw DIAGRAM software. In case you want to make any needed XSL flow map, you can always create it with the aid of Flowcharts solution downloaded from ConceptDraw STORE, so it helps have a professionally looking map which you can always edit the way you want it to be and so to make things much simpler for yourself.

Example 2. Flow Map
Sankey Flow Diagram
The Sankey diagram is also one of the flow map types widely used in the petroleum engineering business. Different Sankey diagrams are used every day known to be a specific type of flow diagram, where the width of the arrows is known to be proportional to the flow quantity. Any Sankey diagram you make can be the one for representing all the primary energy flows into some factory, for example. The widths of the bands can be directly proportional to the energy production, as well as to losses and utilization.
The primary energy sources are known to be electricity, coal, oil, gas, etc., representing the energy inputs on the left-hand side, for example, of the Sankey diagram. The mentioned features can also visualize the material flow accounts on a national or regional level, the energy accounts, as well as the breakdown of the cost of the services or items. The Sankey diagrams are mainly used for representing the major flows within some particular system, being helpful with locating the dominant contributions to some flow. Very often Sankey diagrams are known to be showing the conserved quantities within some defined system boundaries, which were previously limited.

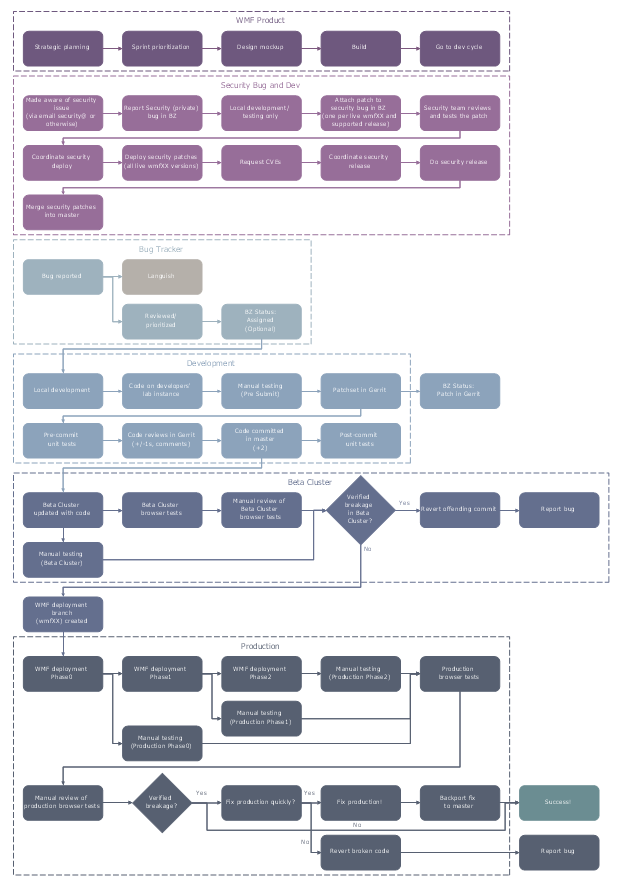
Example 3. Flow Map — Approval Process
Benefits of Flow Map
The Flow Map has a wide set of benefits:
gives a clear documentation of a process;
allows to define and offers common understanding of processes;
helps to build a process visual representation for analysis, discussion, and communication;
allows to identify the scope of the process;
allows to trace and analyze the process steps;
helps to standardize and find areas for monitoring, improvement, and increased efficiency in a process;
allows to find and detach the steps of the process that are not essential;
helps in understanding the logic of complex problems;
offers a guidance for managers overseeing operations;
shows the plant design basis, the arrangement of major equipment, process lines, main control loops;
indicates feedstock, product, main streams flow rates, and operating conditions;
facilitates communication between programmers and business people;
helps programmers to write programs of any complexity and using any high-level language;
helps in debugging process and provides efficient program maintenance;
helps to understand and explain to other people the logic of complex problems and their solutions;
assists to improve teamwork effectiveness.
Benefits of ConceptDraw DIAGRAM Software
Apart from the already mentioned maps, you can also make many other diagrams with the help of ConceptDraw DIAGRAM, ConceptDraw STORE, and Flowcharts Solution in particular, such as those illustrating the Energy Flow, the Petroleum Flow, the Natural Gas Flow, the Electricity Flow, the Coal Flow, as well as many other flows. Sometimes such maps are known to be also called as Flow diagrams, which represent a collective term for the diagrams used for illustrating some flow or some set of the dynamic relationships in a system. The term “flow diagram” itself can also be used as a synonym for a flowchart, for example, being sometimes a counterpart of the flowchart as well.
For example, the illustration of the flows in some nuclear submarine propulsion system can be created to show different streams forth and back in the system. The representation of such a system can be made with the aid of one or more than one maps, charts, diagrams, or flowcharts, illustrating the sequence of one of the flows going in one direction, or any other control flows managing the system as a whole. The physical movement of the objects, which go from one location to another can also be always visualized as a mix of flow maps, flow diagrams, including Sankey one, or flowcharts. Flow maps can always help show what moves (migrates or flows), in which direction, and in which quantities.

Example 4. Flowcharts Rapid Draw Library Design Elements
Key Components of a Flow Map
A flow map is created using the symbols, each representing a different step within a sequence or process. These include inputs and outputs (source and destination), flow lines, arrows representing the direction and movement of the flow, actions, materials, objects, people, services, legend, etc.
Having Flowcharts Solution from ConceptDraw STORE means having all the necessary tools for creating a flow chart, as well as a flow map, flowchart diagram, flow diagram, process diagram, and any other illustration meant to represent some kind of flow. ConceptDraw DIAGRAM is a diagramming as well as drawing software developed for its users to have the design elements they can always use from the basic shapes library, as well as from other stencil libraries from the mentioned solutions, which you can always find very useful within ConceptDraw STORE application.
Conclusion
A Flow Map is a type of thinking maps, which help organize and understand information easily. It consists of a set of boxes and arrows and visually displays a sequence of events. ConceptDraw DIAGRAM process flow mapping software extended with Flowcharts Solution from the Diagrams Area of ConceptDraw Solution Park allows users to create a Flow Chart for Mac or Windows of any degree of complexity in a few minutes.
All ConceptDraw source documents are vector graphic documents. They are available for reviewing, modifying, or converting to a variety of formats (PDF file, MS PowerPoint, MS Visio, and many graphic formats) from the ConceptDraw STORE. The Flowcharts Solution is available for all ConceptDraw DIAGRAM users.