
Example 1. IT Security Solutions
Numerous IT security solutions help us create well protected network, but for beginning it is recommended to create clear and detailed plan. Try to use for this the powerful tools of Network Security Diagrams Solution for ConceptDraw DIAGRAM with its large collection of predesigned vector objects represented by 4 libraries.
All these objects are vector, so you can resize them without loss of quality, change their color to make your Network Security Diagram more interesting, bright and attractive.

Example 2. Network Security Diagram - Fork Bomb
You will also benefit from the set of Network Security Diagrams samples offered by Network Security Diagrams solution at ConceptDraw STORE. You can choose any desired from the offered that meets your requirements and change it for your needs.

Example 3. Network Security Diagram - Access Control and Encryption
The samples you see on this page were created in ConceptDraw DIAGRAM using the tools of Network Security Diagrams Solution for ConceptDraw DIAGRAM software. An experienced user spent 5-10 minutes creating each of these samples.
Use the Network Security Diagrams Solution for ConceptDraw DIAGRAM software and modern IT security solutions to protect your network and create your own Network Security Plans quick, easy and effective.
All source documents are vector graphic documents. They are available for reviewing, modifying, or converting to a variety of formats (PDF file, MS PowerPoint, MS Visio, and many other graphic formats) from the ConceptDraw STORE. The Network Security Diagrams Solution is available for all ConceptDraw DIAGRAM users.
TEN RELATED HOW TO's:
Use Sprint Backlog to visualize the Sprint Backlog.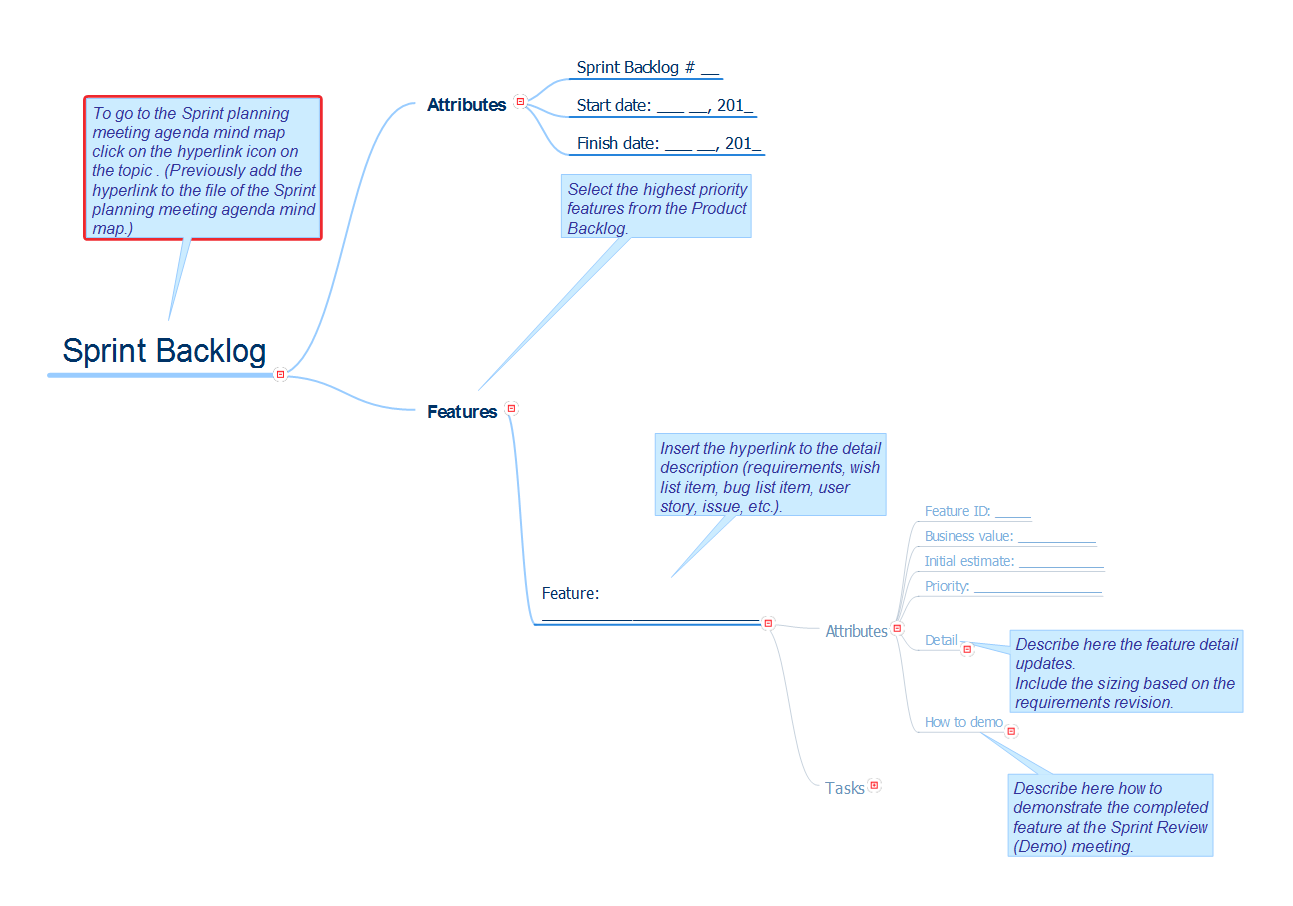
Picture: Sprint Backlog
Related Solution:
The Circular Arrows Diagrams are very popular in management and marketing. They are the useful way to visualize a sequence of steps, tasks, or events as a circular flow. But how design the Circular Arrows Diagram quick and easy? You will need a powerful software. ConceptDraw DIAGRAM charting and vector drawing software is exactly what you need. Extended with a multi-functional Business Diagrams solution from the Management Area, ConceptDraw DIAGRAM is the best for drawing the Circular Arrows Diagrams.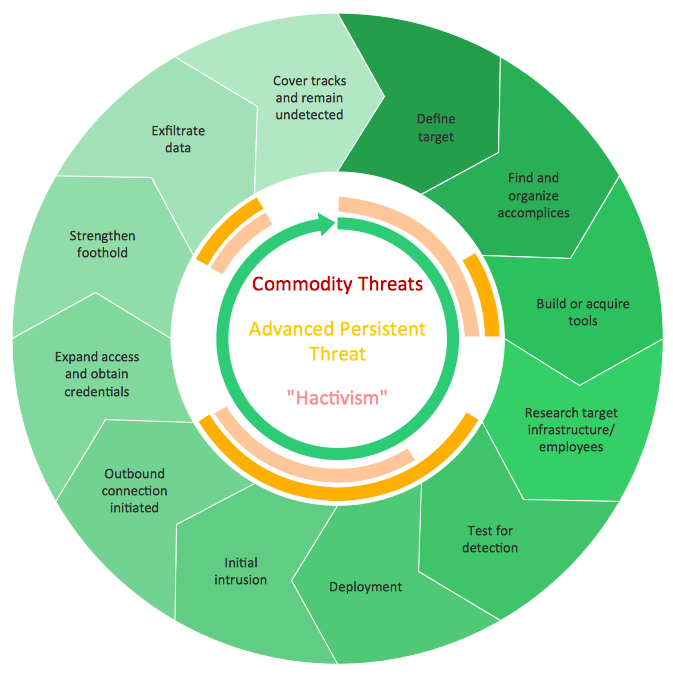
Picture: Circular Arrows
Related Solution:
An abstract representation is usually the first thing you will need while developing a database. To understand the ways that databases are structured, you should look through entity-relationship diagram examples and see the notations features and attributes. With an entity-relationship model you can describe a database of any complexity.
This Entity-relationship diagram is a tool for software developers. It enables every element of database to be managed, communicated and tested before release. This ERD was created using symbols advocated by Chen's notation. Because of a linguistic origin of the Chen’s notation, the boxes representing entities could be interpreted as nouns, and the relationships between them are in verb form, shown on a diagram as a diamond.
Picture: Entity Relationship Diagram Examples
Related Solution:
A perfect tool to draw network diagram for bandwidth management. Computer & Networks solution provides the symbol libraries with pre-designed network graphic elements.
Use Computer & Networks solution to draw the network diagrams for bandwidth management for Cisco networks, Apple networks, IVR networks, GPRS networks, wi-fi networks, LAN and WAN.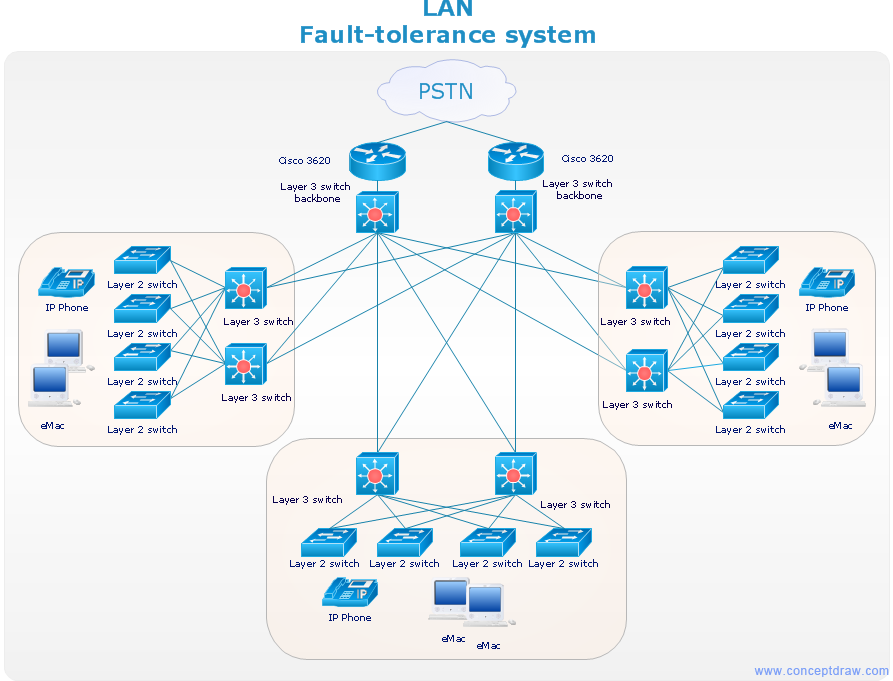
Picture: Network Diagrams for Bandwidth Management
Remote Networking - We explain the method most people use to connect to the Internet.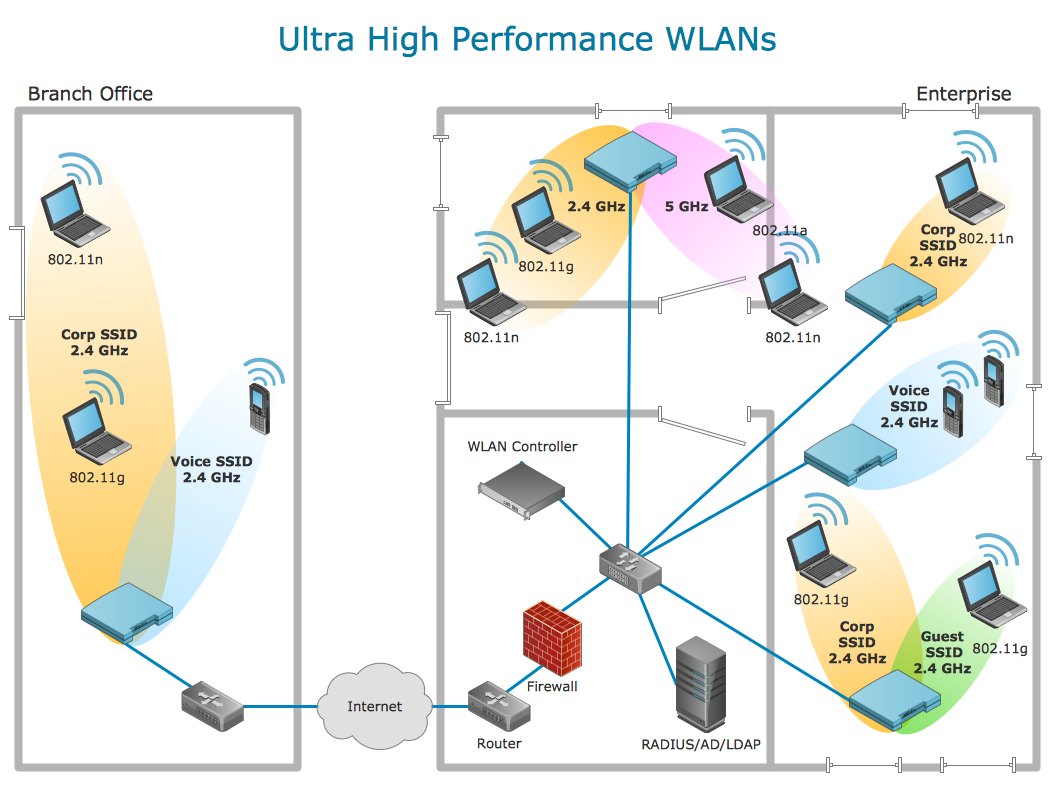
Picture: Using Remote Networking Diagrams
Have you ever created the fire plans on the base of Fire Evacuation Plan Template? It's incredibly convenient and time-saving way. Let's try to make sure this with Fire and Emergency Plans solution for ConceptDraw DIAGRAM software.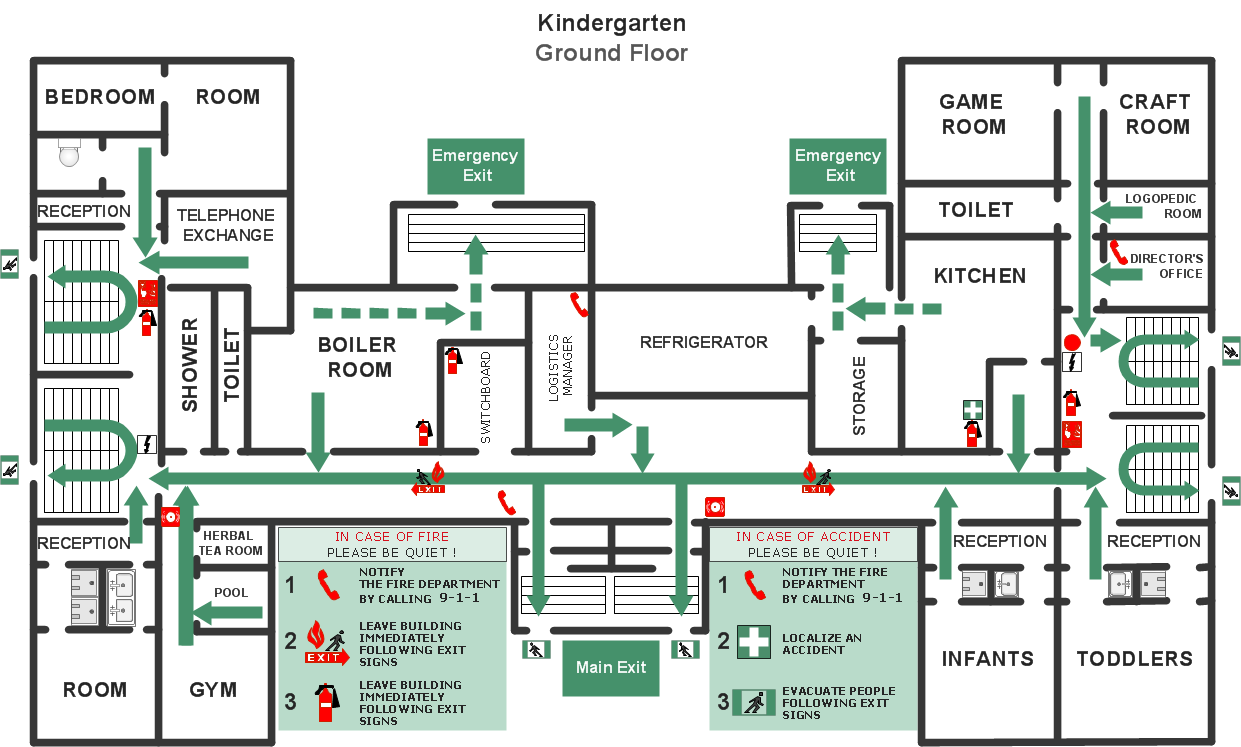
Picture: Fire Evacuation Plan Template
Related Solution:
Deliver your message with ConceptDraw Post Mail Design Elements.
Samples, templates and libraries contain vector clip art for drawing the Post and Mail Illustrations.
Choose your graphic Mail illustration among Envelope, Postal wrapper, Air-envelopes, Parcel, Mail box, Postman, Courier, E-mail.
Picture: Post and Mail - Design Elements
Related Solution:
AWS platform is great to develop reliable applications. If you are already aware of all the benefits that Amazon Web Services diagrams bring, then you'll need also a diagramming tool for architecture to share your vision. Luckily, ConceptDraw DIAGRAM has a special AWS Diagrams solution with vector icons and templates that are easy to edit.
The AWS architecture diagram, you see on this drawing, was designed using ConceptDraw Amazon Web Services Architecture Diagrams (AWS) solution. The 14 libraries, delivered with this solution introduces near 250 vector graphic images used to draw AWS Diagrams. The AWS Architecture Diagrams solution is a valuable tool for programmers, software architects and other IT professionals. It enables them to develop reliable applications with a high stage of interaction with AWS cloud.
Picture: Amazon Web Services Diagrams diagramming tool for architecture
Studying informatics demands knowledge in the area of computer networks as well. The most famous world network, Internet, is an example of wide area network (WAN) topology that connects devices spread on any distance. Unlike other smaller networks that are limited to a building or to a campus, WAN is almost limitless.
This WAN (wide area network) diagram was created in ConceptDraw DIAGRAM. It shows a telecommunication network that covers a large geographical area connecting several settlements. This type of networks is commonly used by business and government institutions. Using the WANs enables them quickly communicate information between remote geographical points. To reproduce this network diagram, you will need the means, provided by ConceptDraw Computer and Network Diagrams solution.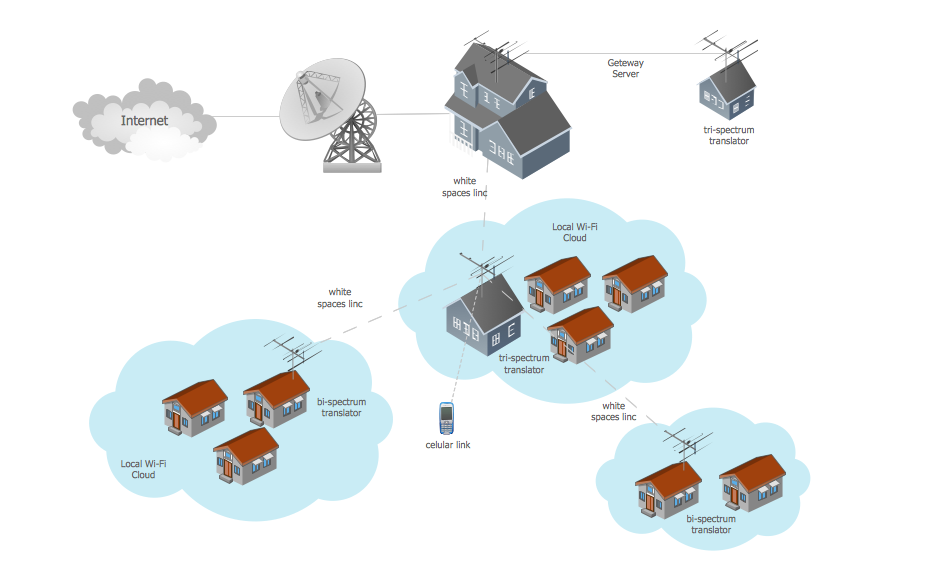
Picture: Wide area network (WAN) topology. Computer and Network Examples
Related Solution:
What is a Work Flow Chart? It is a chart which visually displays the step-by-step transferring of data, documents and tasks during the work. ConceptDraw DIAGRAM extended with Workflow Diagrams solution from the Business Processes area of ConceptDraw Solution Park is the best software for drawing the Work Flow Chart of any complexity.
Picture: Work Flow Chart
Related Solution:


