
Example 1. Bar Charts - Composition of lunar soil
Bar Graphs Solution provides large quantity of drawing tools, variety of templates and samples which will be useful in your bar charts drawing. You can open any template or sample from ConceptDraw STORE. Use it for you needs as is or change in minutes using the vector objects from the Bar Graphs library of Bar Graphs solution.

Example 2. Bar Charts - MIDEM 2011 Attendance by Region of the World
All bar charts designed in ConceptDraw DIAGRAM and included in Bar Graphs solution are professional looking, clear, visual, colorful and bright, and will have a success when used in various fields of work activity.

Example 3. Bar Charts - Times to productivity
The bar charts you see on this page were created in ConceptDraw DIAGRAM using the Bar Graphs Solution for ConceptDraw DIAGRAM An experienced user spent 5-10 minutes creating every of these samples.
Use the Bar Graphs Solution from the Graphs and Charts area to draw your own bar graphs of any complexity quick, easy and effective.
All source documents are vector graphic documents. They are available for reviewing, modifying, or converting to a variety of formats (PDF file, MS PowerPoint, MS Visio, and many other graphic formats) from the ConceptDraw STORE. The Bar Graphs Solution is available for all ConceptDraw DIAGRAM or later users.
NINE RELATED HOW TO's:
The vector stencils library COM and OLE from the solution Software Engineering contains 15 symbols of the COM and OLE objects for ConceptDraw DIAGRAM software.
Picture: COM and OLE Diagram
The purchase or purchasing funnel is a consumer focused marketing model which illustrates the theoretical customer journey towards the purchase of a product or service.
Picture: Pyramid Diagram
Related Solution:
Designing of food images, fruit art illustrations, pictures of vegetables, and many other food and cafe related images and infographics has never been easier than it is now with ConceptDraw DIAGRAM software.
ConceptDraw DIAGRAM diagramming and vector drawing software extended with Food Court solution from the Food and Beverage area of ConceptDraw Solution Park is perfect food pictures design software.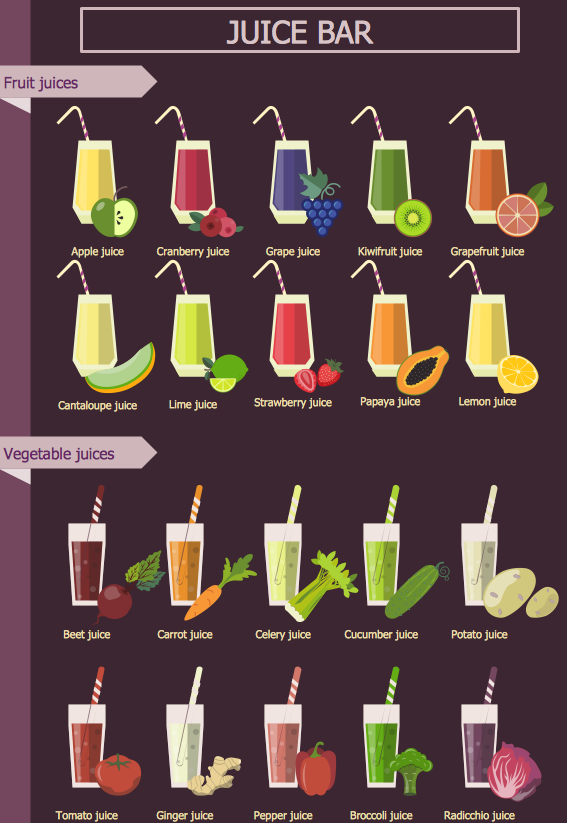
Picture: Pictures of Vegetables
Related Solution:
When searching for a diagramming tool, we look for a powerful and reliable software that would be easy to use. To mention one, ConceptDraw DIAGRAM has all the necessary features to create cross-functional flowcharts (Swim Lanes) quick and effortlessly. You can draw swim lane diagrams in both vertical and horizontal ways.
This cross-functional flowchart displays a payroll process. It explains to each participant his role in the process depending on the category, represented with swimlanes. Using this flowchart, every employee can easily find out what he can expect in terms of salary. Generally a cross-functional diagram enables one to take a look at processes with a wider scope and with more precision than simple flowchart. Business process capturing using cross-functional flowcharts can be useful for stakeholders and managers to define clearly the staff's roles and responsibilities.
Picture: Cross-Functional Flowchart (Swim Lanes)
Related Solution:
Create flowcharts, organizational charts, bar charts, line graphs, and more with ConceptDraw DIAGRAM.
Picture: Basic Diagramming
Related Solution:
Action Plan - For the action planning define people and groups involvement in corrective actions by roles, identify logical sequences of scheduled actions and critical path of problem solving, identify possible risks of action plan and propose preventive actions.
ConceptDraw Office suite is a software for decision making and action plan.
Picture: The Action Plan
When we think of an hierarchy, we intuitively imagine a pyramid. Thus, a lot of management tools use pyramid charts as examples or illustrations of various documents or models. You can create any type of triangle diagram using ConceptDraw DIAGRAM.
A triangle (pyramid) diagram is often used in marketing to show the data hierarchy. This pyramid diagram represents the Top Brand Model. It illustrate the model of rebranding strategy. It can be used by marketing agency dealing with rebranding strategies development. It’s critical for marketing diagrams to be both clear and eye catching. ConceptDraw Pyramid diagrams solution meet all these requirements and can be successfully applied for creating and presenting various marketing pyramidal diagrams.
Picture: Pyramid Chart Examples
Related Solutions:
It is convenient to represent various routes, directions, roads on the directional maps and navigation schemes. ConceptDraw DIAGRAM diagramming and vector drawing software supplied with Directional Maps Solution from the Maps Area of ConceptDraw Solution Park is effective for drawing Directions Maps.
Picture: Directions Maps
Related Solution:
Now it’s easy to share your visual documents with other people in a form most convenient for them.
ConceptDraw DIAGRAM can save your drawings and diagrams in a number of highly useful formats, including graphic files. You can save your drawing as a.PNG,.JPG, or other graphic format file.
Picture: Export from ConceptDraw DIAGRAM Document to a Graphic File

