How to Draw Business Process Diagrams with RapidDraw Interface
Business Process Modeling Notation (BPMN) is a set of standard symbols that allow you to create a graphical view of a business process. The symbols were developed to help users develop standard, unified structure of processes, and any messages shared between these processes.
As the business world becomes more complex, so must the processes that keep it running. What′s more, with more participants involved in the running of a business, both from inside and out, it′s important we have a unified modeling technique that can handle the interaction between these processes. BPMN is a visual tool for businesses and business process implementers. A critical focus of BPMN is that it is seen as critical for business users to easily read and understand business process diagrams.
BPMN is a process-oriented approach to modeling of systems; this sets it apart from UML which has a more object-oriented approach. With the addition of BPMN to ConceptDraw DIAGRAM users have the capability of using either BPMN or UML to describe a process, depending on their needs.
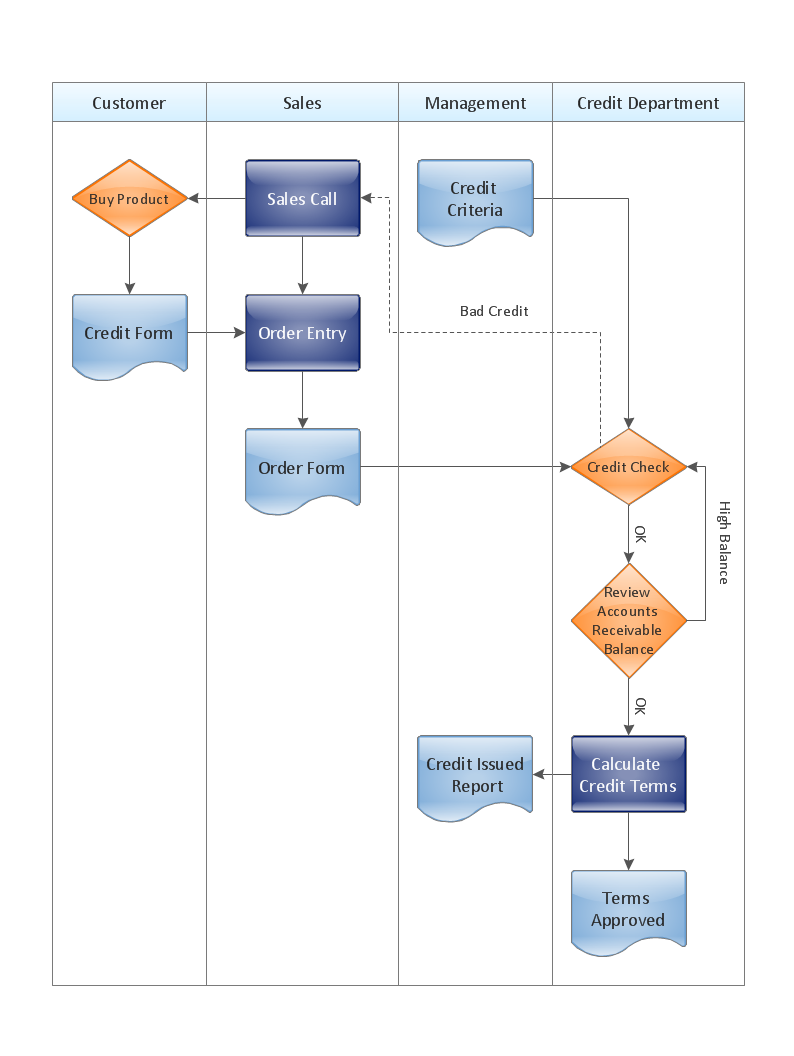
Pic.1. Swim Lane Diagram - Hiring Process Example
All source documents are vector graphic documents. They are available for reviewing, modifying or converting to a variety of formats (PDF file, Power point Presentation, image or MS Visio) from ConceptDraw STORE, for all users who have installed Business Process Diagram solutions.
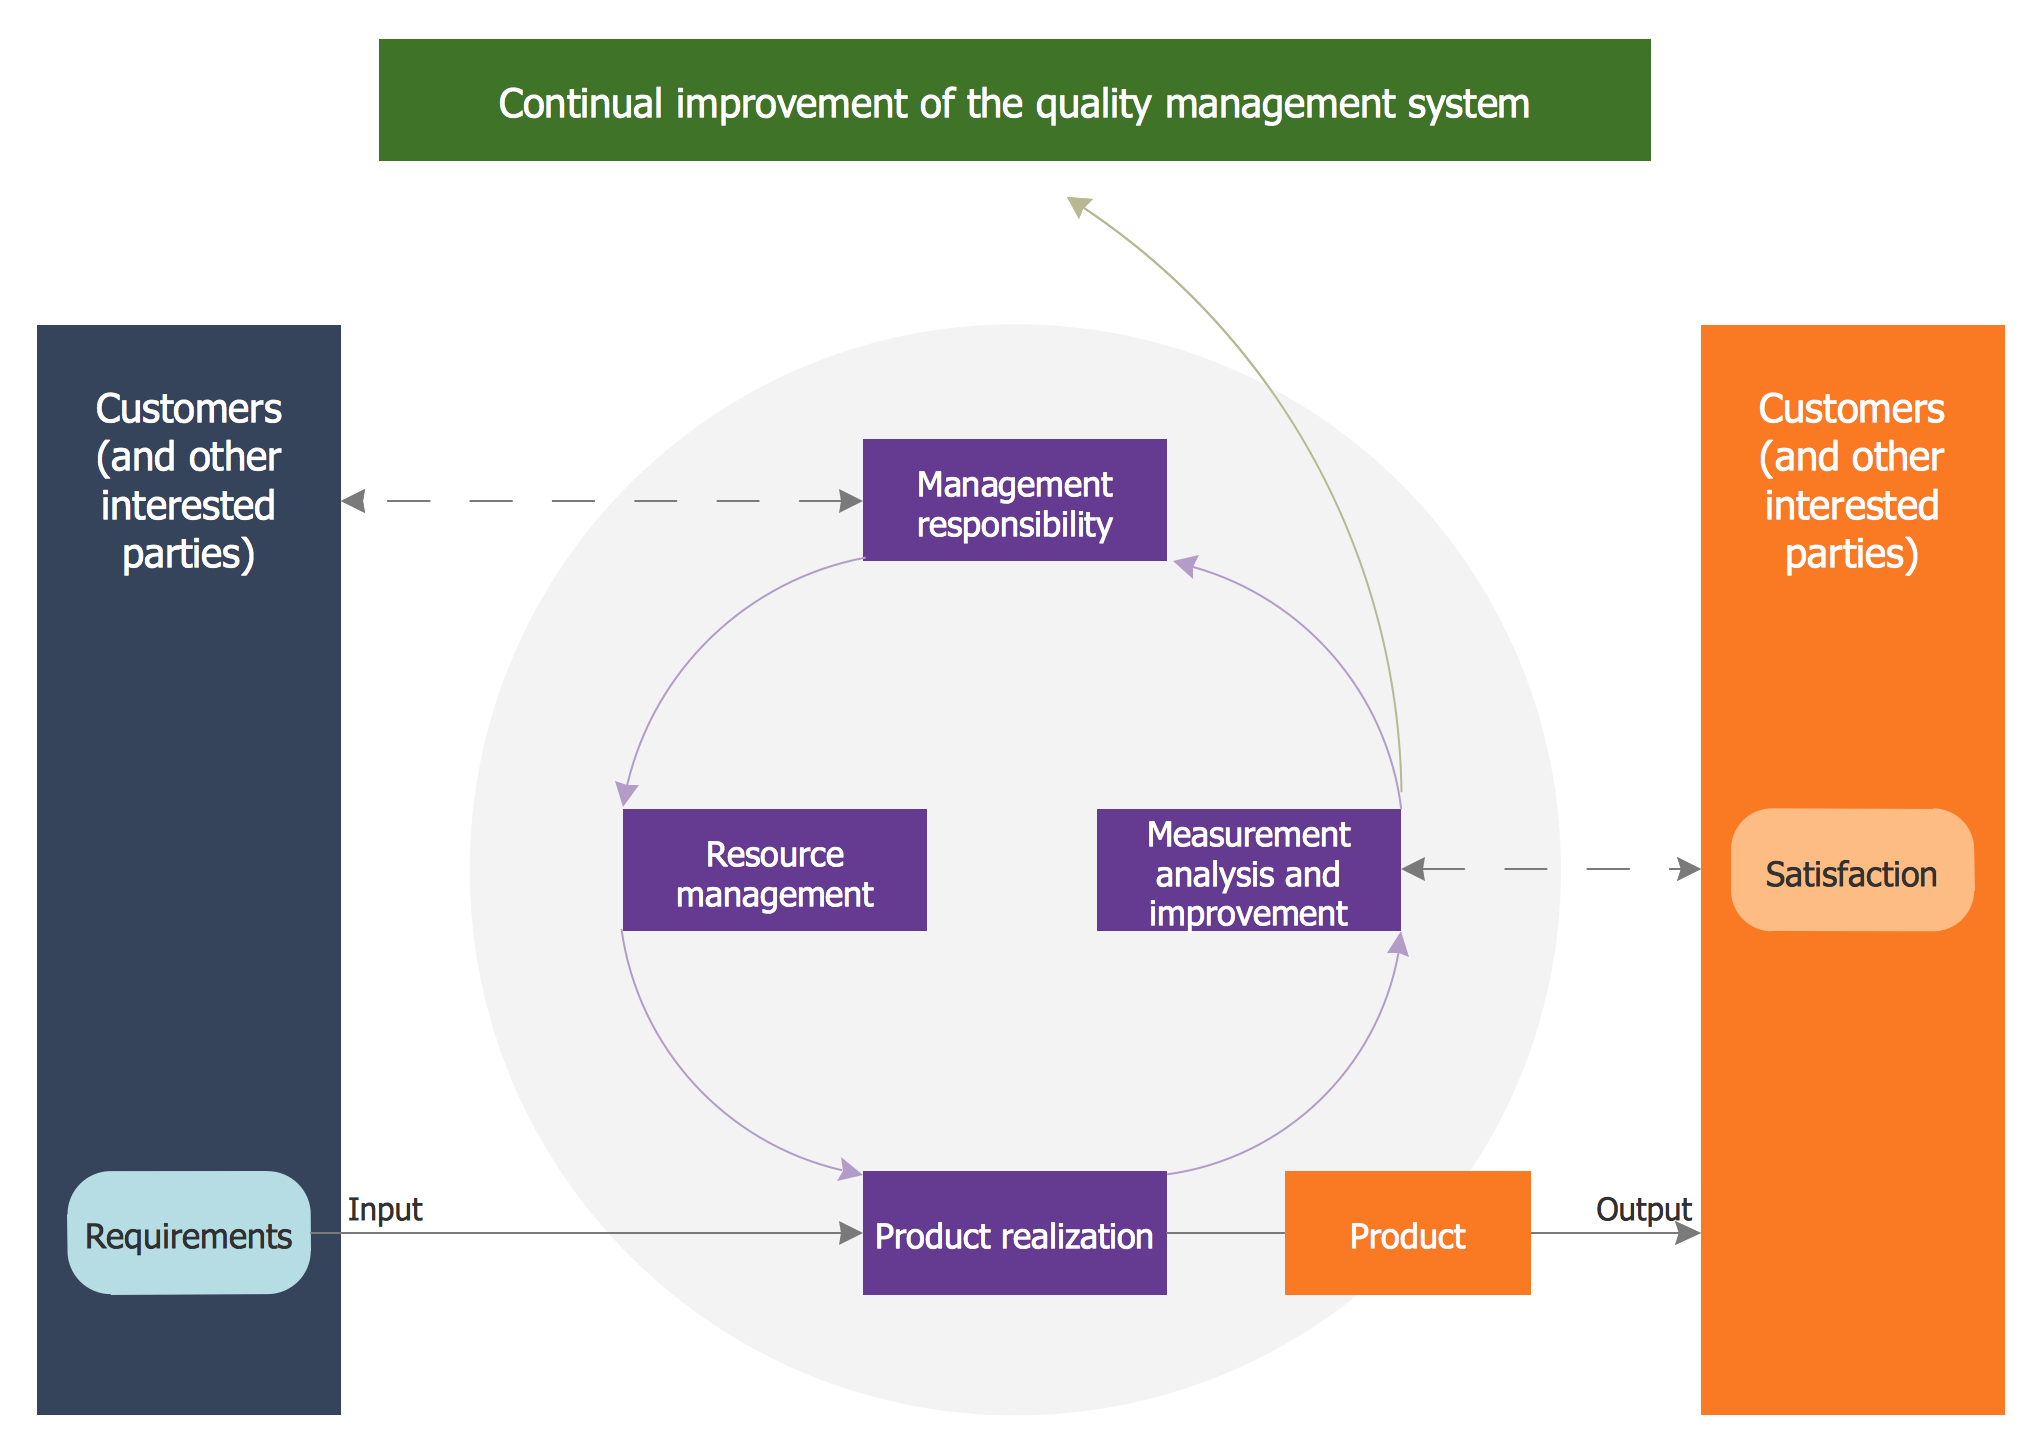
ConceptDraw DIAGRAM diagramming and vector drawing software extended with Total Quality Management (TQM) Diagrams solution from the Quality area of ConceptDraw Solution Park perfectly suits for development and visually representing a Quality Management System.
Event-Driven Process Chain Diagrams for improvement throughout an organisation.
ConceptDraw DIAGRAM - software that reduces the time needed to create a business process model.
You need to draw the Bar Graph? The automated tool can be useful for you. ConceptDraw DIAGRAM diagramming and vector drawing software extended with Bar Graphs solution from Graphs and Charts area of ConceptDraw Solution Park will help you create any Bar Graph.
When used in different areas, flowcharts use specific symbols to depict different elements. ConceptDraw DIAGRAM offers libraries of symbols for many areas. One of such libraries is flowchart symbols accounting, which provides symbols for accounting diagrams. Activity-based costing calculates the costs of all products and services based on activities in an organization. A type of accounting flowchart that shows how costs are assigned to products with resources and activities is called Activity-based costing (ABC) flowchart. It can be designed in a digital drawing software such as ConceptDraw DIAGRAM.
Here is an accounting flowchart template and symbols. These flowchart symbols are applied for making accounting flow charts in ConceptDraw DIAGRAM and with its Accounting Flowcharts solution. An accounting flowchart is a specific type of a flow diagram. Practically a number of flowchart-type diagrams commonly utilized to clarify many parts of an accounting department working process. Accounting flowchart assists a process of preparing accounting documentation. It shows who responsible for implementation of each step in the workflow of accounting department.
A Data Flow Diagram (DFD) is a graphical technique which allows effectively model and analyze the information processes and systems. The ability to fast and easy create the DFDs is made possible with Data Flow Diagrams solution from the Software Development area of ConceptDraw Solution Park. For designing the Data Flow Diagrams are used simple DFD flowchart symbols which are connected each other by arrows depicting the data flow from one step to another.
Fast creating visualization for structured data is the main capability of ConceptDraw DIAGRAM software. With numerous vector stencils from object libraries and the RapidDraw technology this software becomes the best cross-functional flowchart software.