A choreography diagram defines the expected behavior between interacting participants. The choreography activities are interactions that represent a set of message exchanges which involves two or more participants. There is no central controller, responsible entity or observer of the process.
TEN RELATED HOW TO's:
ConceptDraw DIAGRAM is a professional diagramming and vector drawing software. Now, enhanced with SysML Solution from the Software Development Area of ConceptDraw Solution Park, ConceptDraw DIAGRAM became an ideal software for model based systems engineering (MBSE).
Picture: Model Based Systems Engineering
Related Solution:
Auditing standards ensure a measure of audit quality and the objectives which must to be achieved in an audit. Illustrations are convenient way for auditors and audit-related people to display the auditing standards.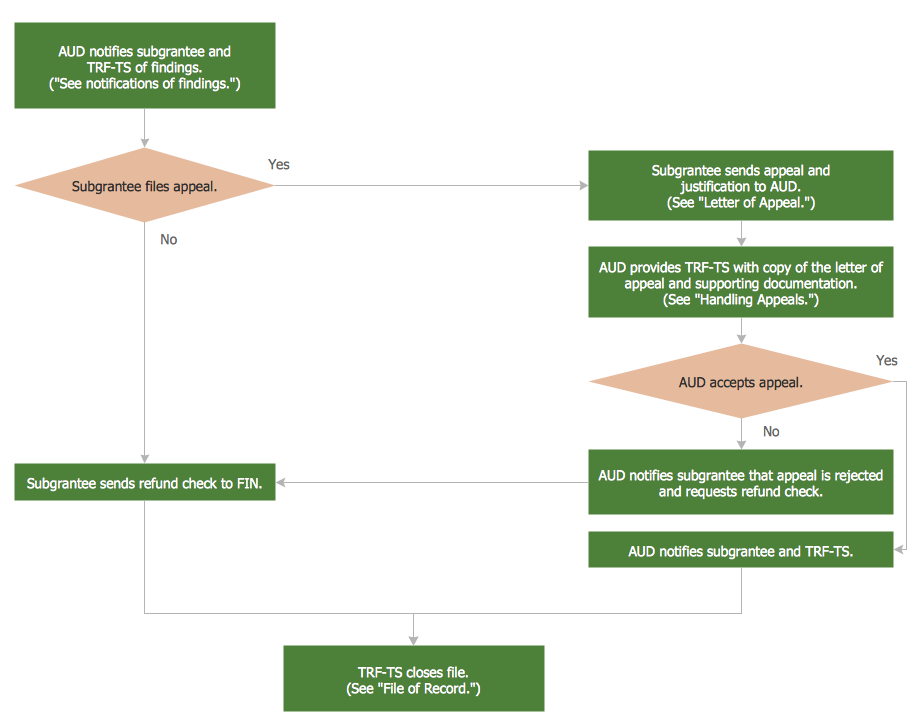
Picture: Auditing Standards
Related Solution:
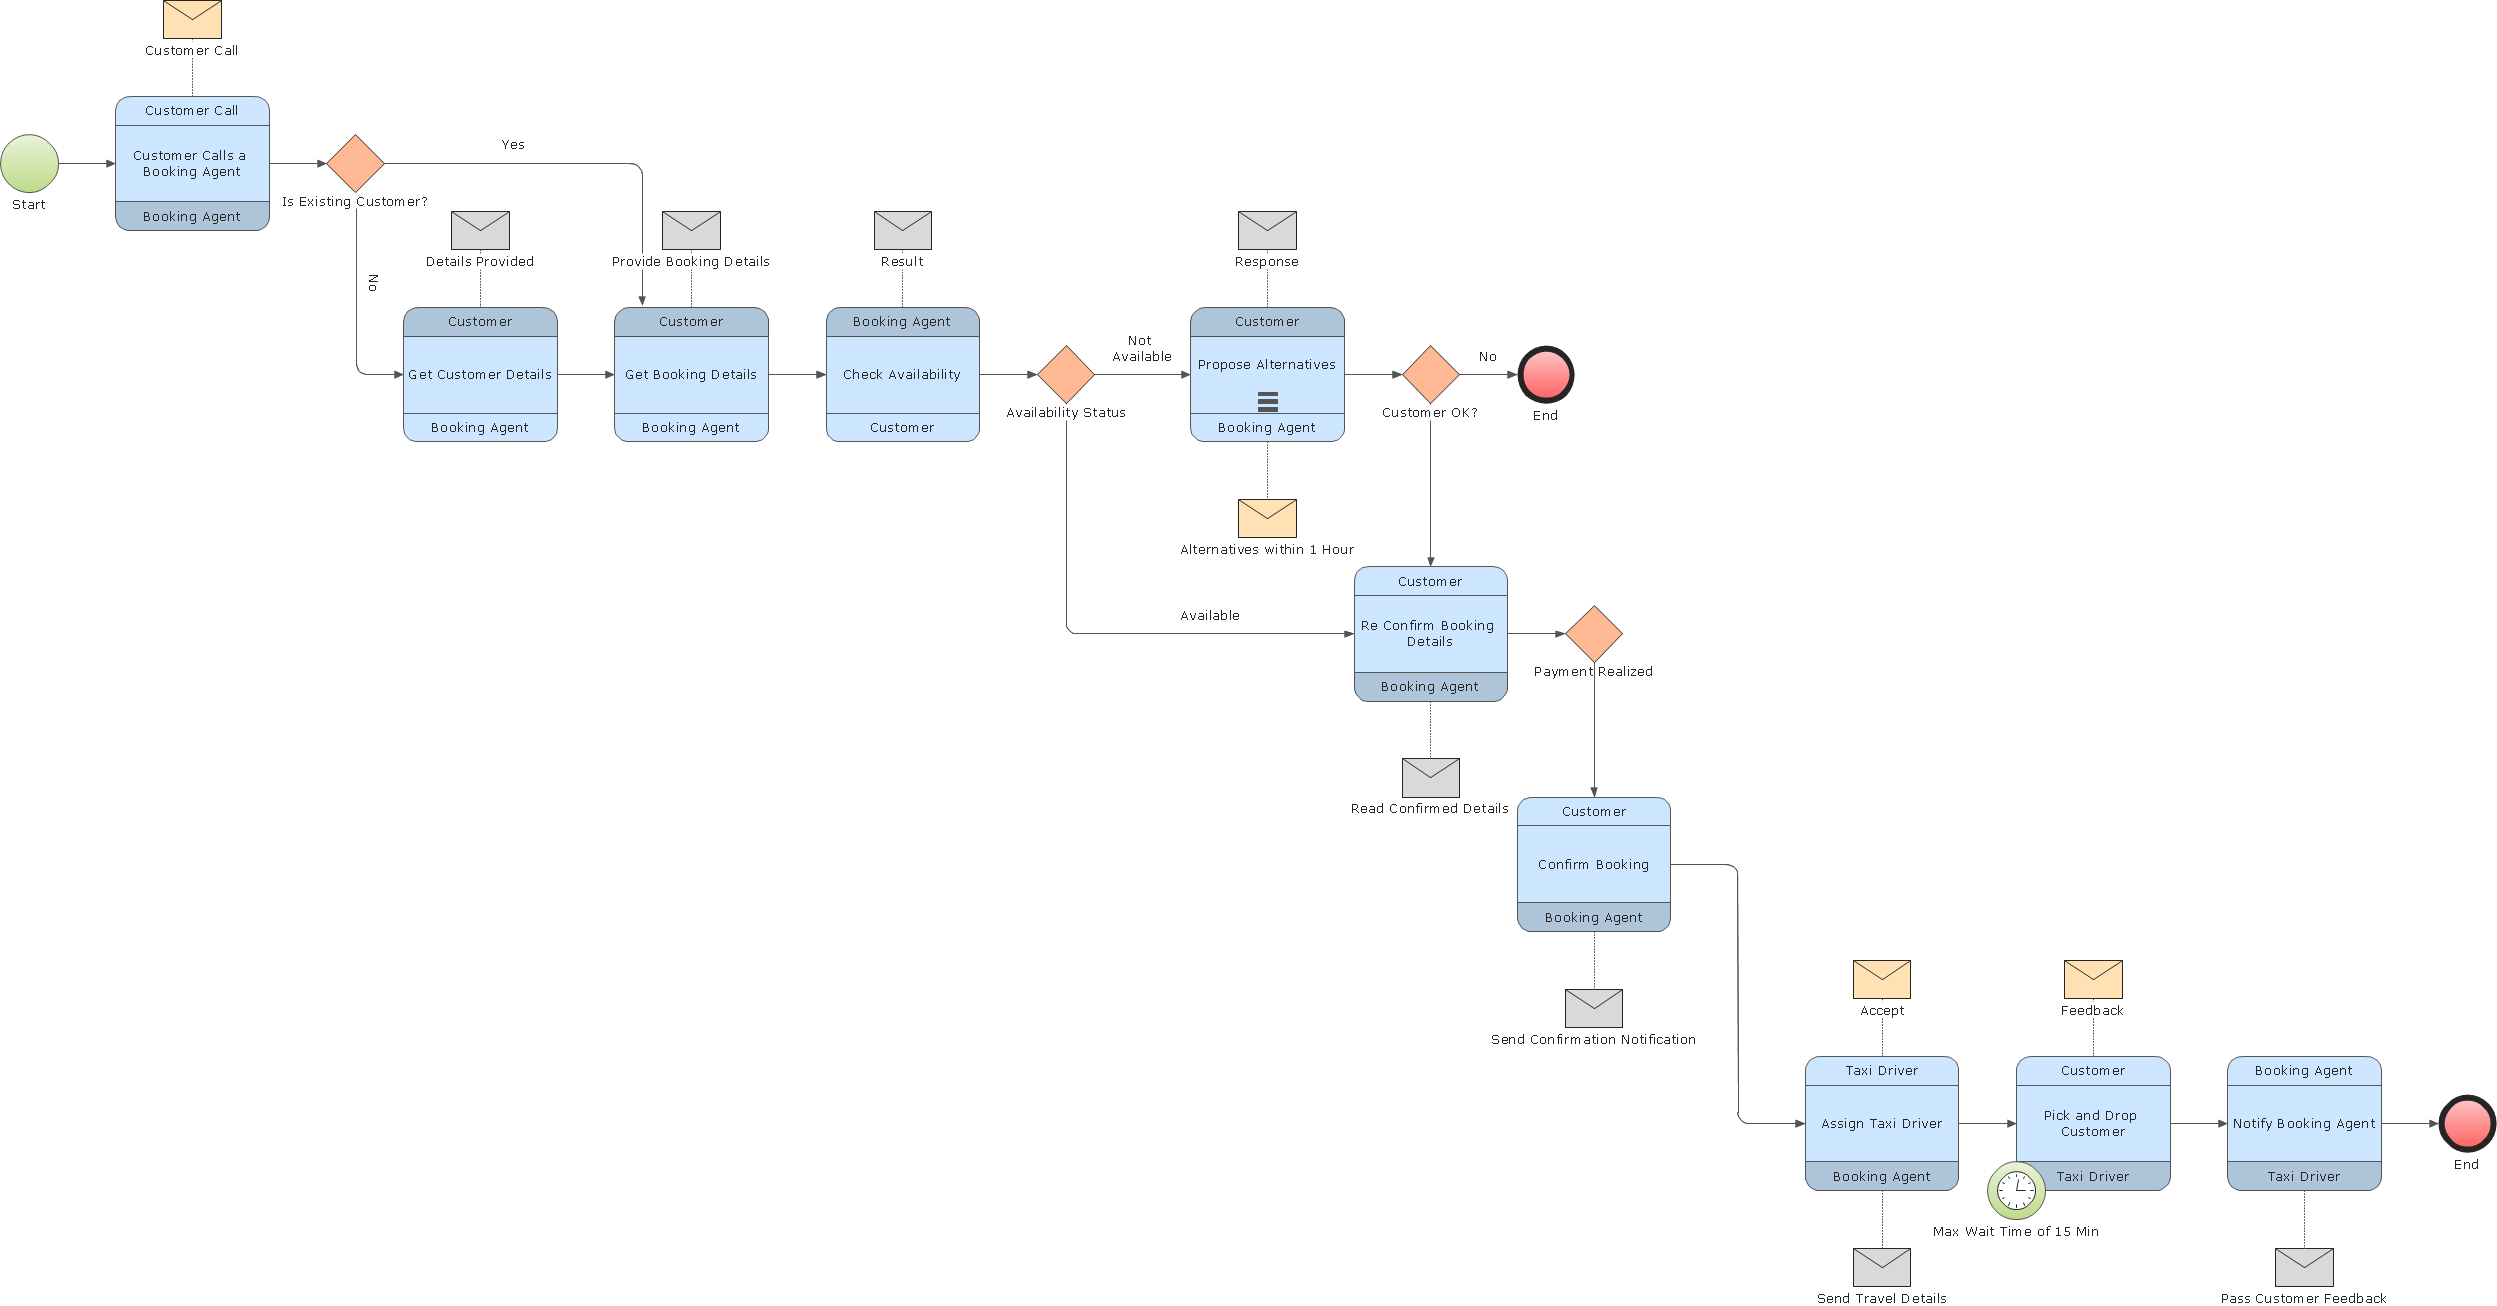
ConceptDraw DIAGRAM extended with Business Process Diagram Solution from the Business Processes Area is a powerful BPM Software which provides a set of useful drawing tools. This is business process improvement tools. Business Process Diagram Solution provides 16 libraries with wide variety of predesigned vector objects from BPMN 1.2 and BPMN 2.0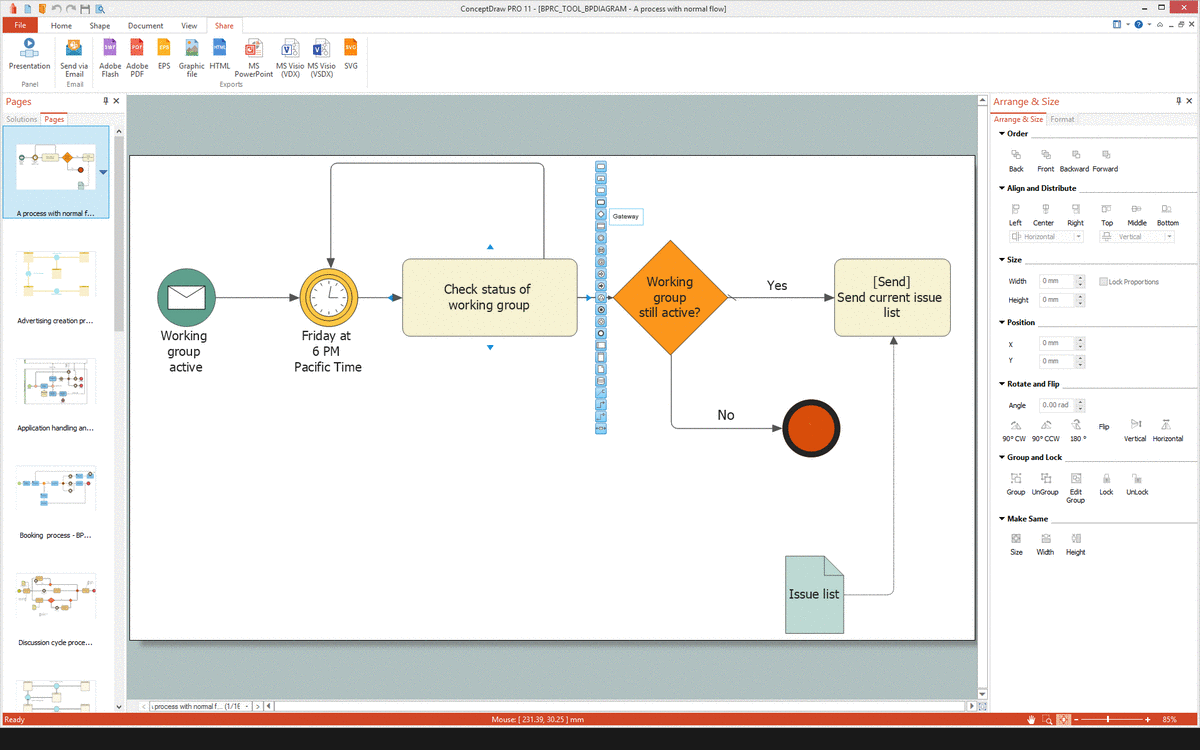
Picture: BPM Software
Related Solution:
ConceptDraw DIAGRAM is a business flowchart software includes the wide flowchart examples package.
Picture: Basic Flowchart Examples
Related Solution:
One of the ways effectively visualize what is a Cloud computing or Cloud computing architecture, is to create the Sequence diagram for Cloud computing. The ConceptDraw DIAGRAM diagramming and vector drawing software enhanced with Cloud Computing Diagrams solution from the Computers and Network area of ConceptDraw Solution Park will help you design all desired types of diagrams related with cloud computing.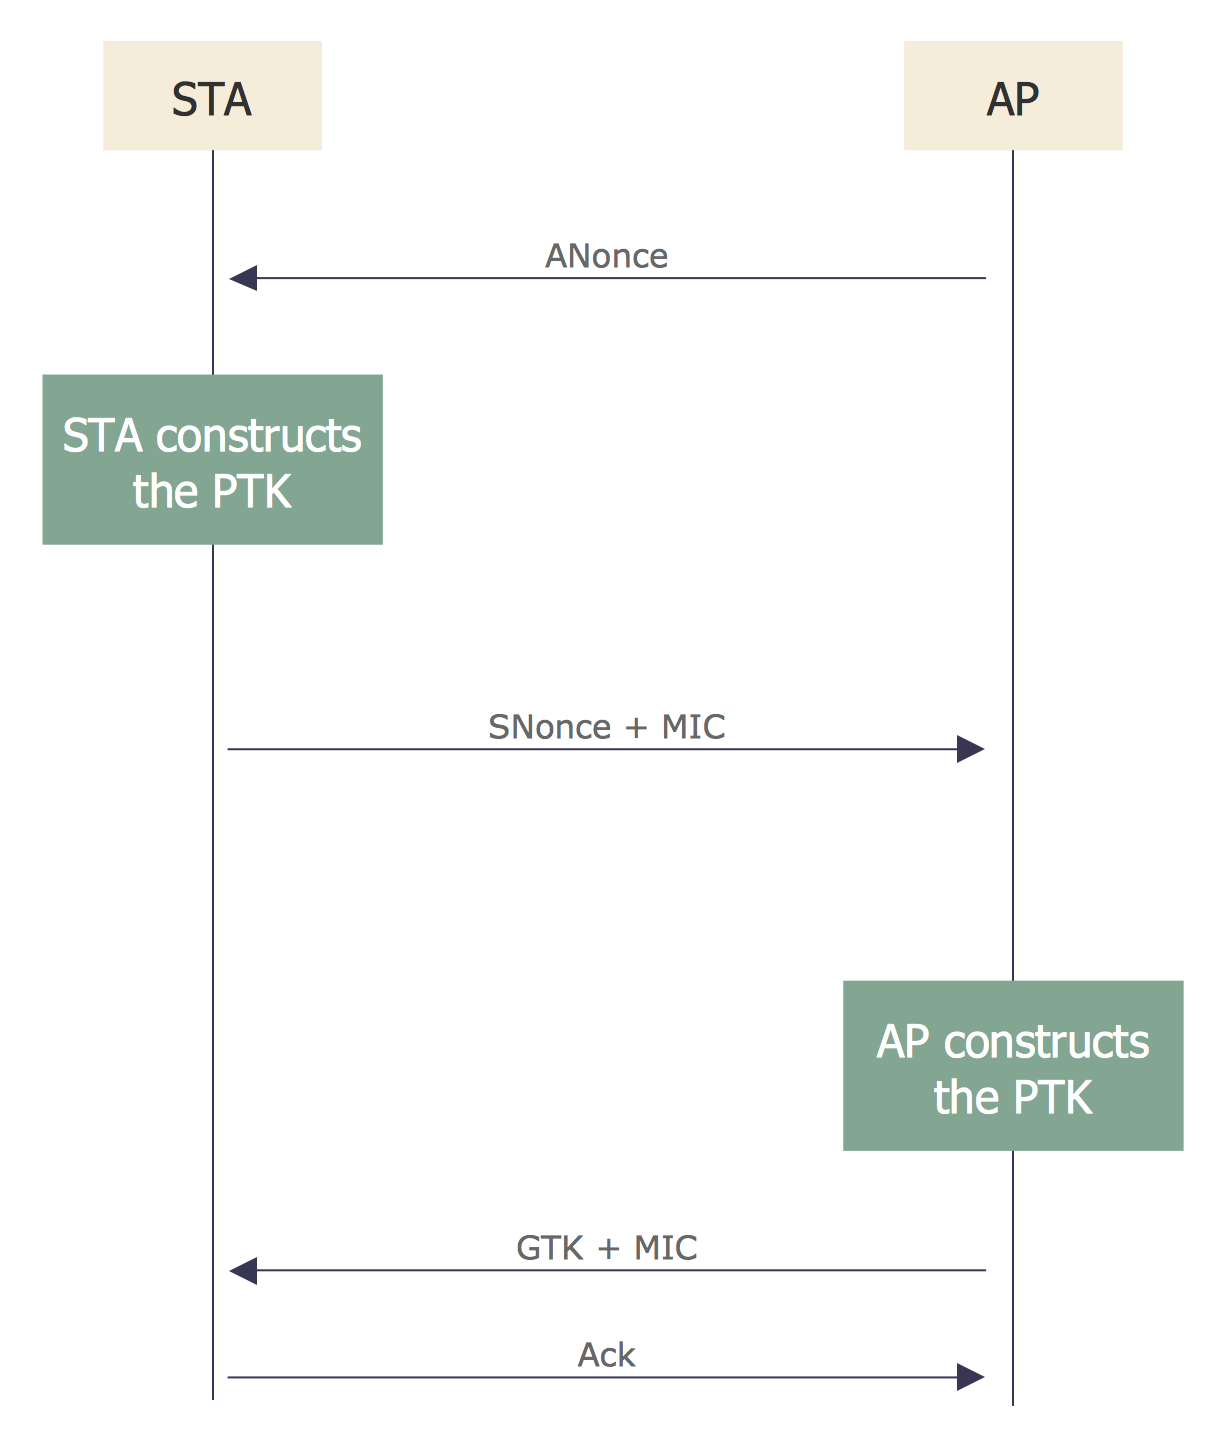
Picture: Sequence Diagram for Cloud Computing
Related Solution:
This sample shows the Flowchart of the ACC general account creation. This Flowchart describes the Start point, the process of the handling the user requests and the End point – creating of the account. The shapes represent the subprocesses and the arrows between the shapes shows the sequence of the actions.
This sample was created in ConceptDraw DIAGRAM diagramming and vector drawing software using the Flowcharts solution from the Diagrams area of ConceptDraw Solution Park.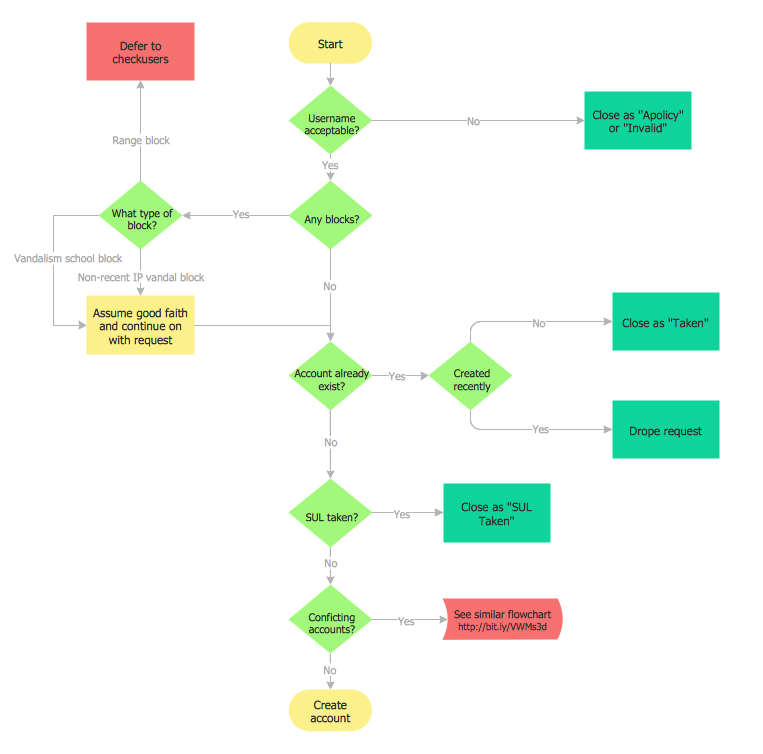
Picture: Examples of Flowchart
Related Solution:
When you are connecting existing objects you can control the diagram structure by changing selection order.
This is how diagramming software should work. You are able to draw a diagram as quickly as the ideas come to you.
Picture: ConceptDraw Arrows10 Technology
Use Sprint Planning to visualize the Sprint Planning meeting agenda.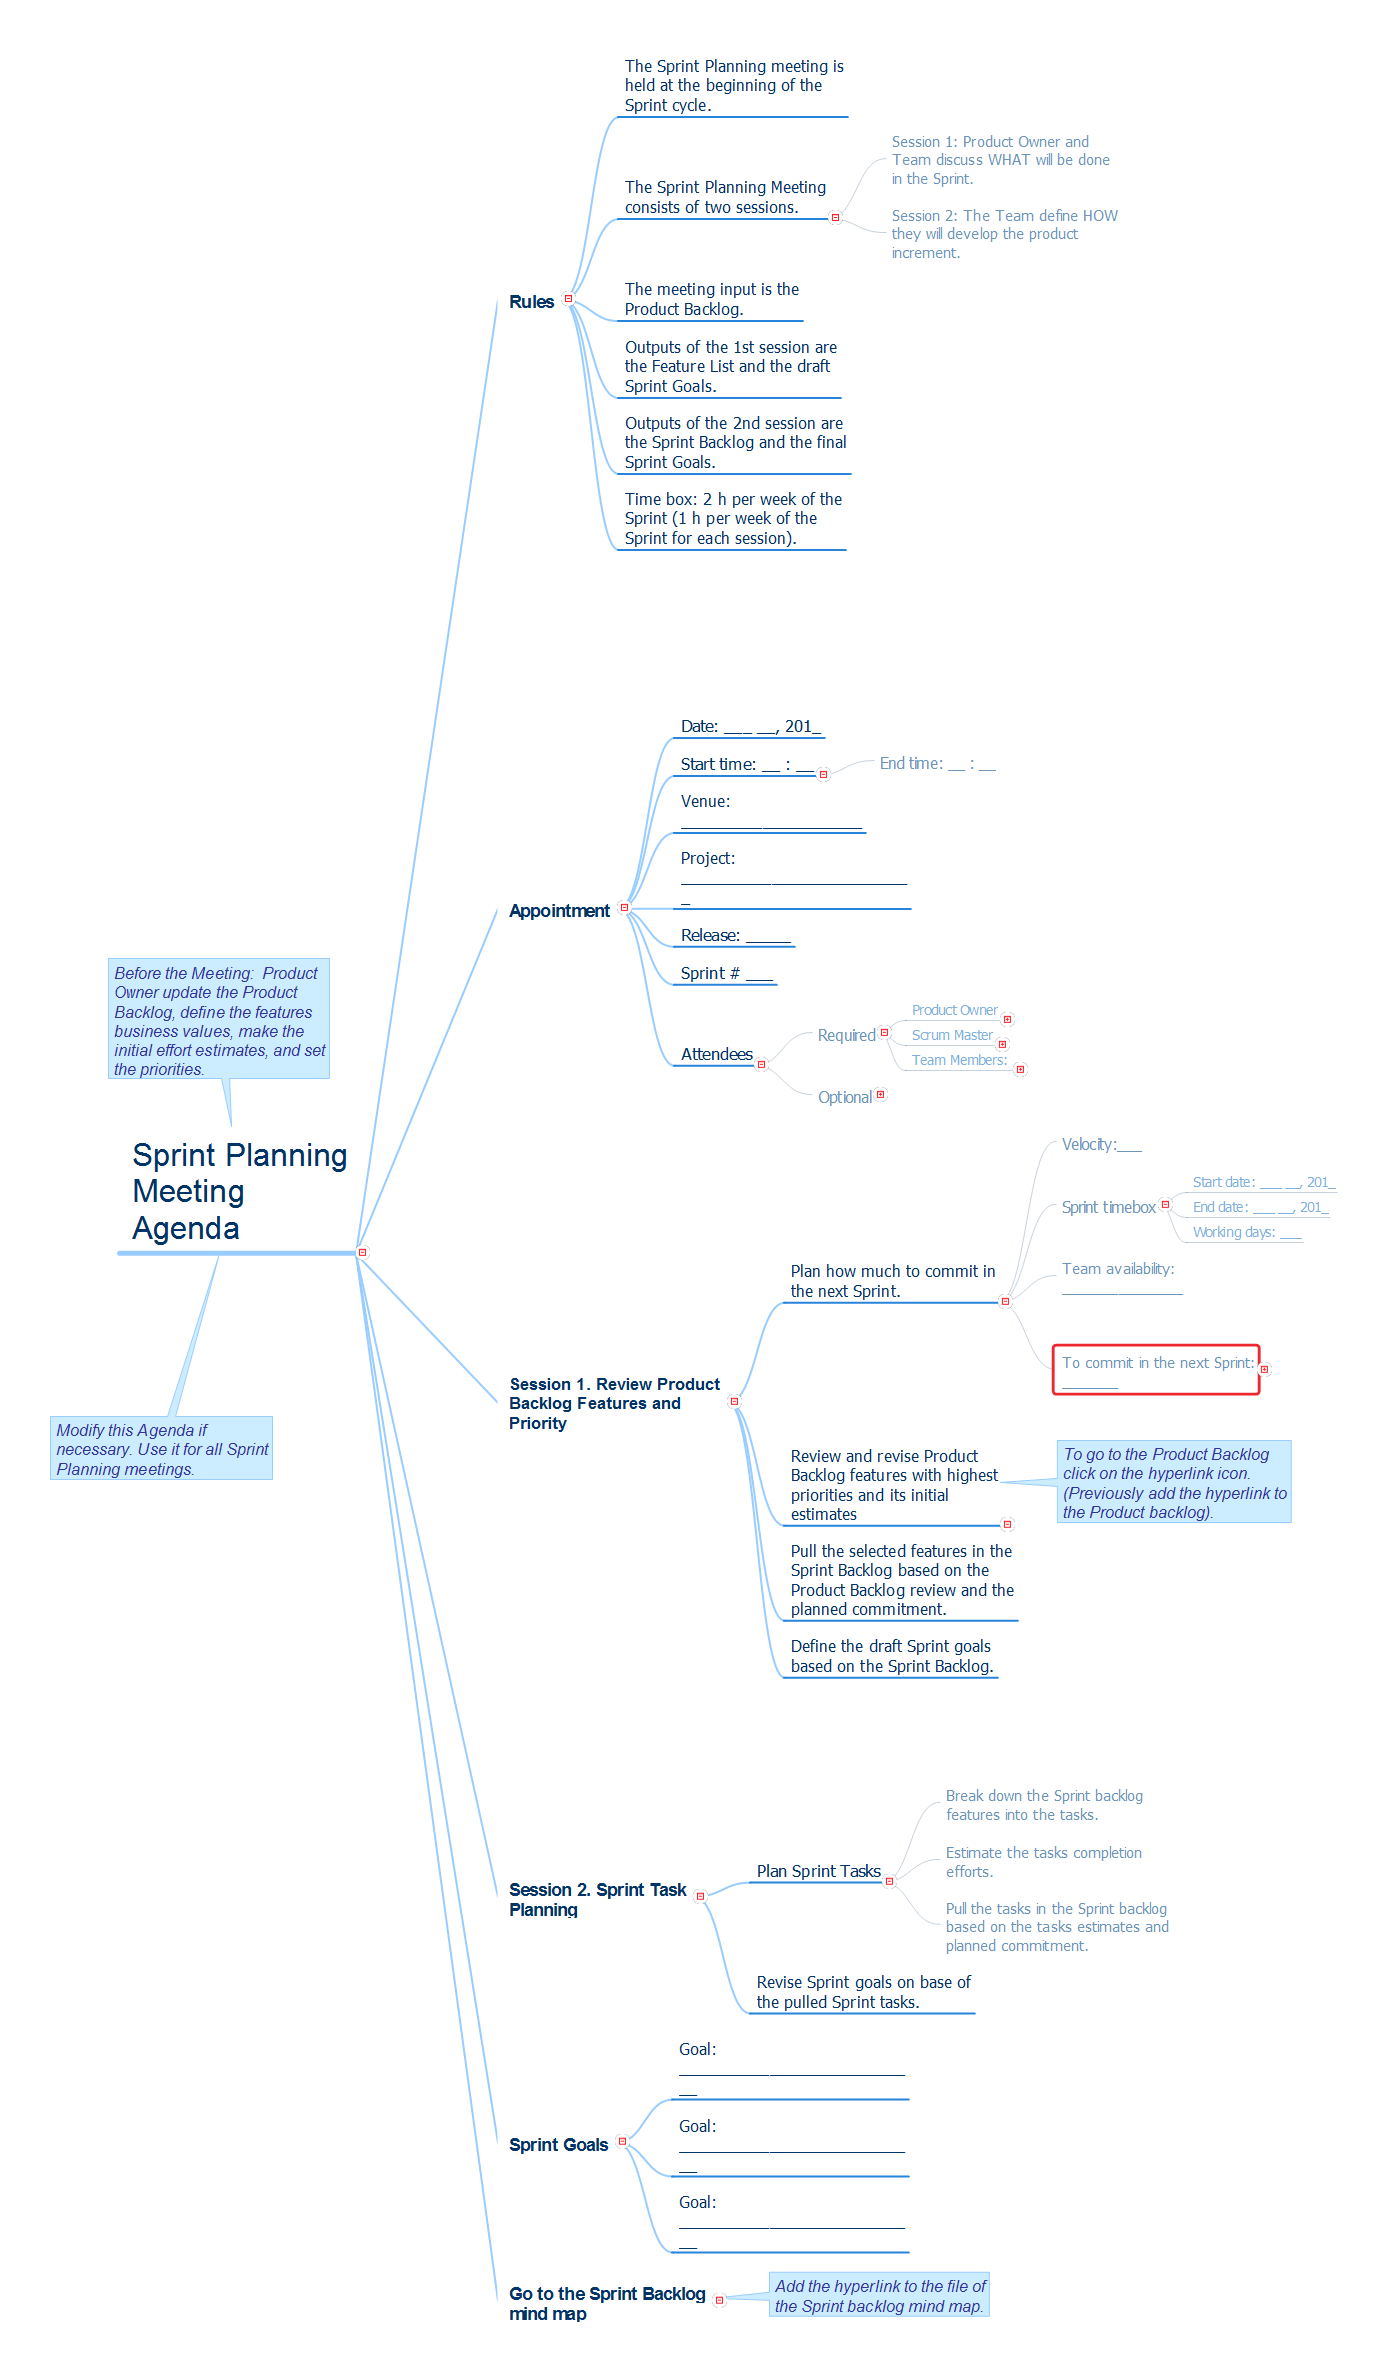
Picture: Sprint Planning Meeting Agenda
Related Solution:
Create business process diagrams (BPMN 2.0.) with ConceptDraw using professional looking templates. ConceptDraw is business process improvement tools.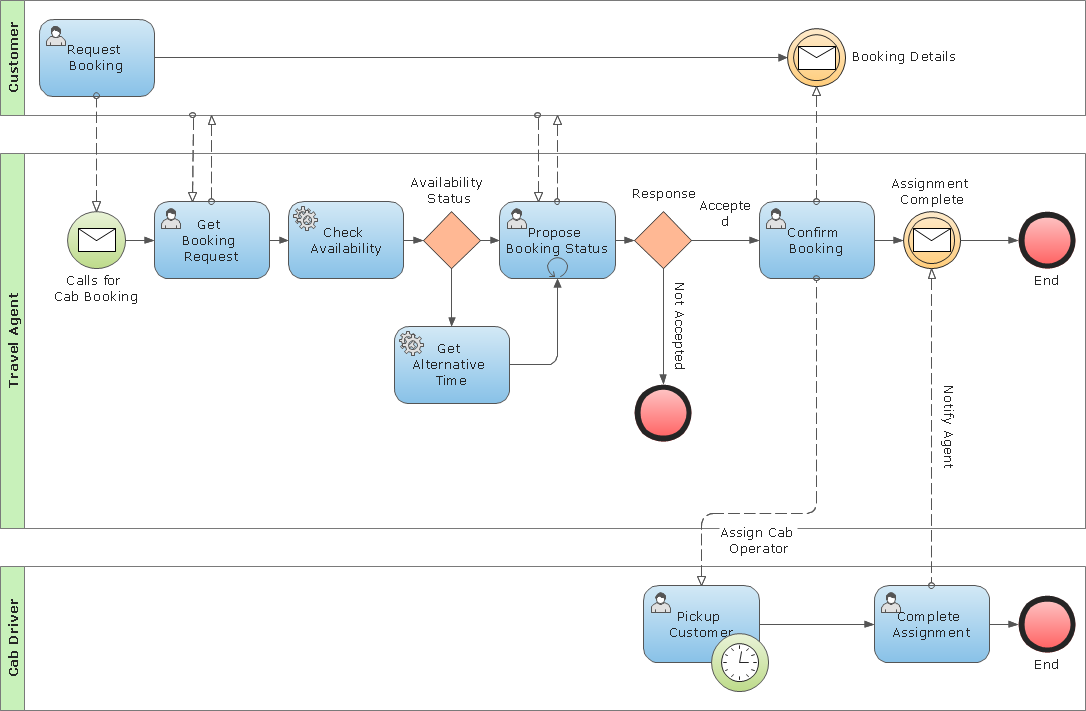
Picture: Business Process Modeling Notation Template
ConceptDraw DIAGRAM - business process modeling software for mac offers the Business Process Diagram Solution with powerful tools to help you easy represent the business processes and create the business process diagrams based on BPMN 1.2 and BPMN 2.0 standards that allows to create of both simple and complex (nested) models of processes.
There are 16 BPMN 1.2 and BPMN 2.0 stencil libraries containing 230 vector objects: Rapid Draw library, Connections library, Gateways and Artifacts libraries, Data library, Gateways library, Choreographies library, Conversations library, Activities libraries, Events libraries, Expanded Objects libraries, Swim lanes libraries.
Picture: Business Process Modeling Software for Mac
Related Solution: