TQM Diagram Example
Total Quality Management (TQM) practice uses diagrams and charts as flowcharts, fishbone diagrams, seven management and planning tools in continuous quality improvement for visual monitoring and control, analysis and improvement of management and manufacturing processes.

Pic.1 Import process flowchart.
This business process flowchart example shows import process step-by-step for visual analysis and improvement.
See also Samples:
TEN RELATED HOW TO's:
The ConceptDraw DIAGRAM is a best flow chart tool for the job. The samples and templates included in the basic set allows users to draw any type of a flowchart. The vector stencils created by designers give ability to draw great-looking flowchart. Flowcharts give to users the ability to represent structural data visually.
Picture: Use the Best FlowChart Tool for the Job
Related Solution:
Create flowcharts, flow charts, and more with ConceptDraw flowchart software.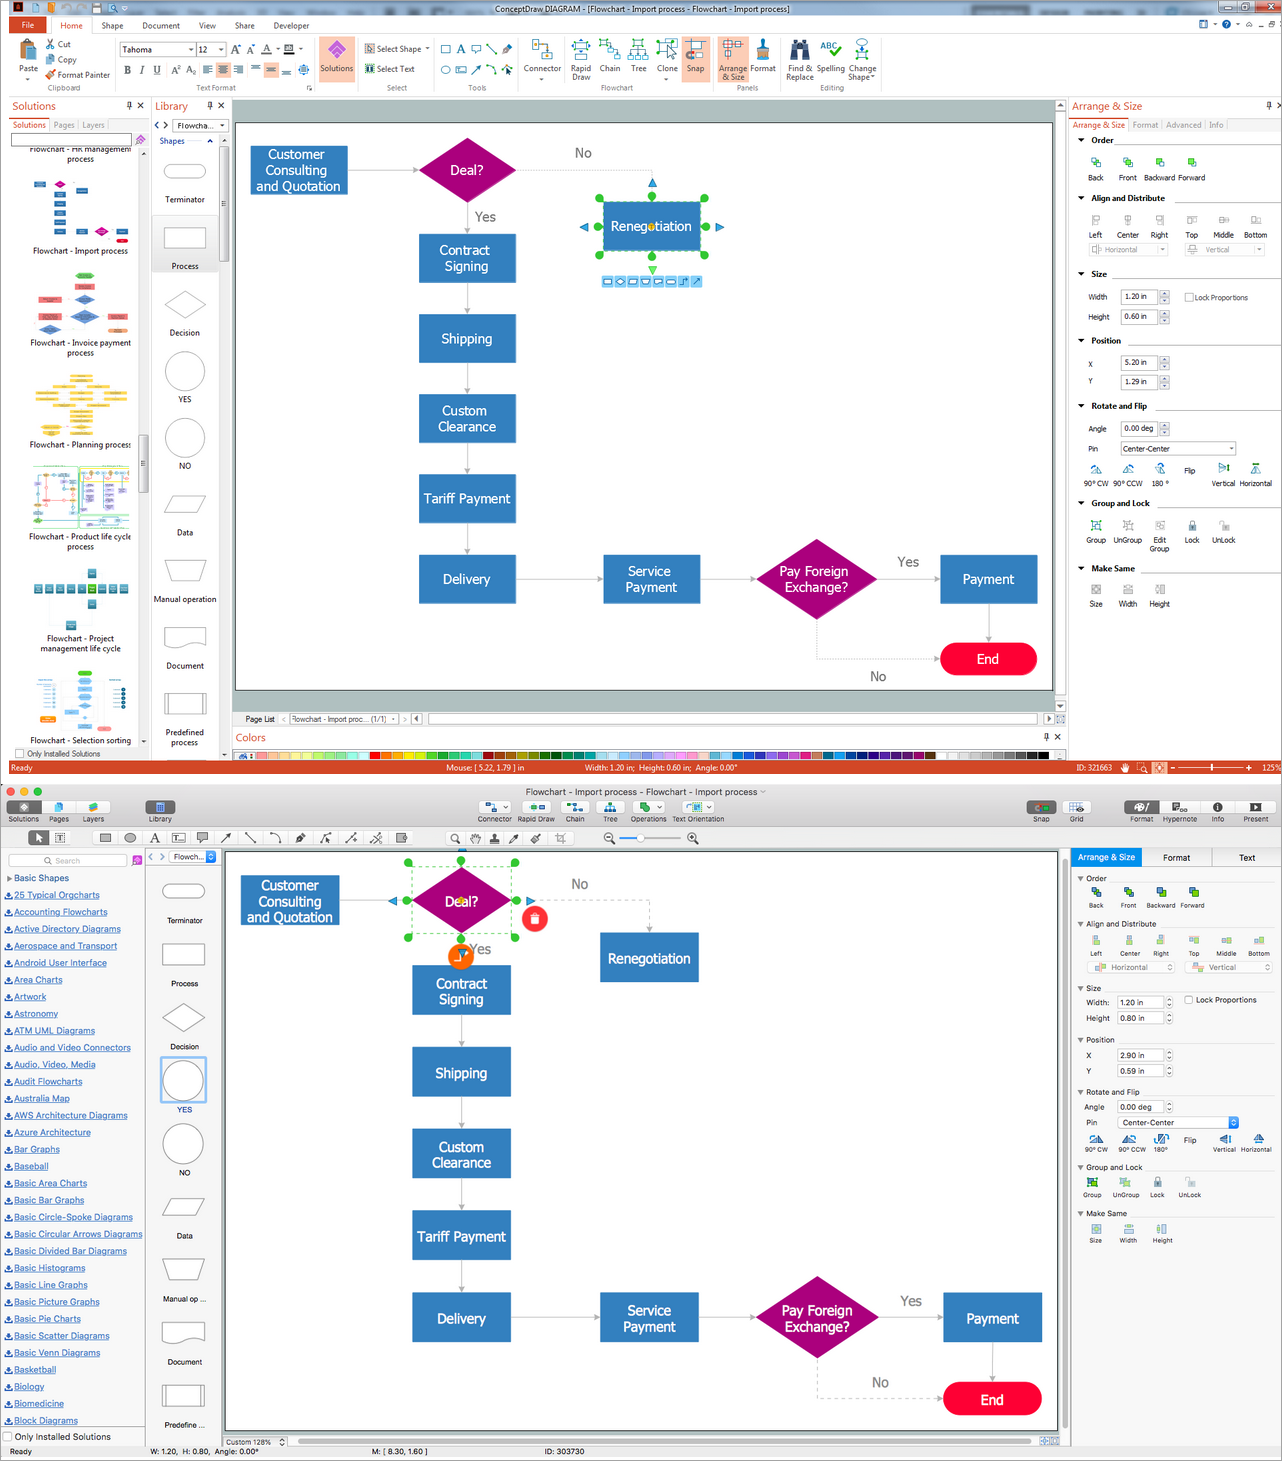
Picture: Basic Diagramming. Flowchart Software
Related Solution:
A process flow chart is a sequence diagram on events, actions, tasks and decisions that are visualized in a form of inputs and outputs. Such flow chart involves a defined number of standard symbols and notation keys used to help one understand and pass the information.
Process flow charts have become a day-to-day tool for chemical engineers, technologists and production engineers as well as software developers. However, their use has recently increased in other areas such as business, manufacturing and, especially a service sector.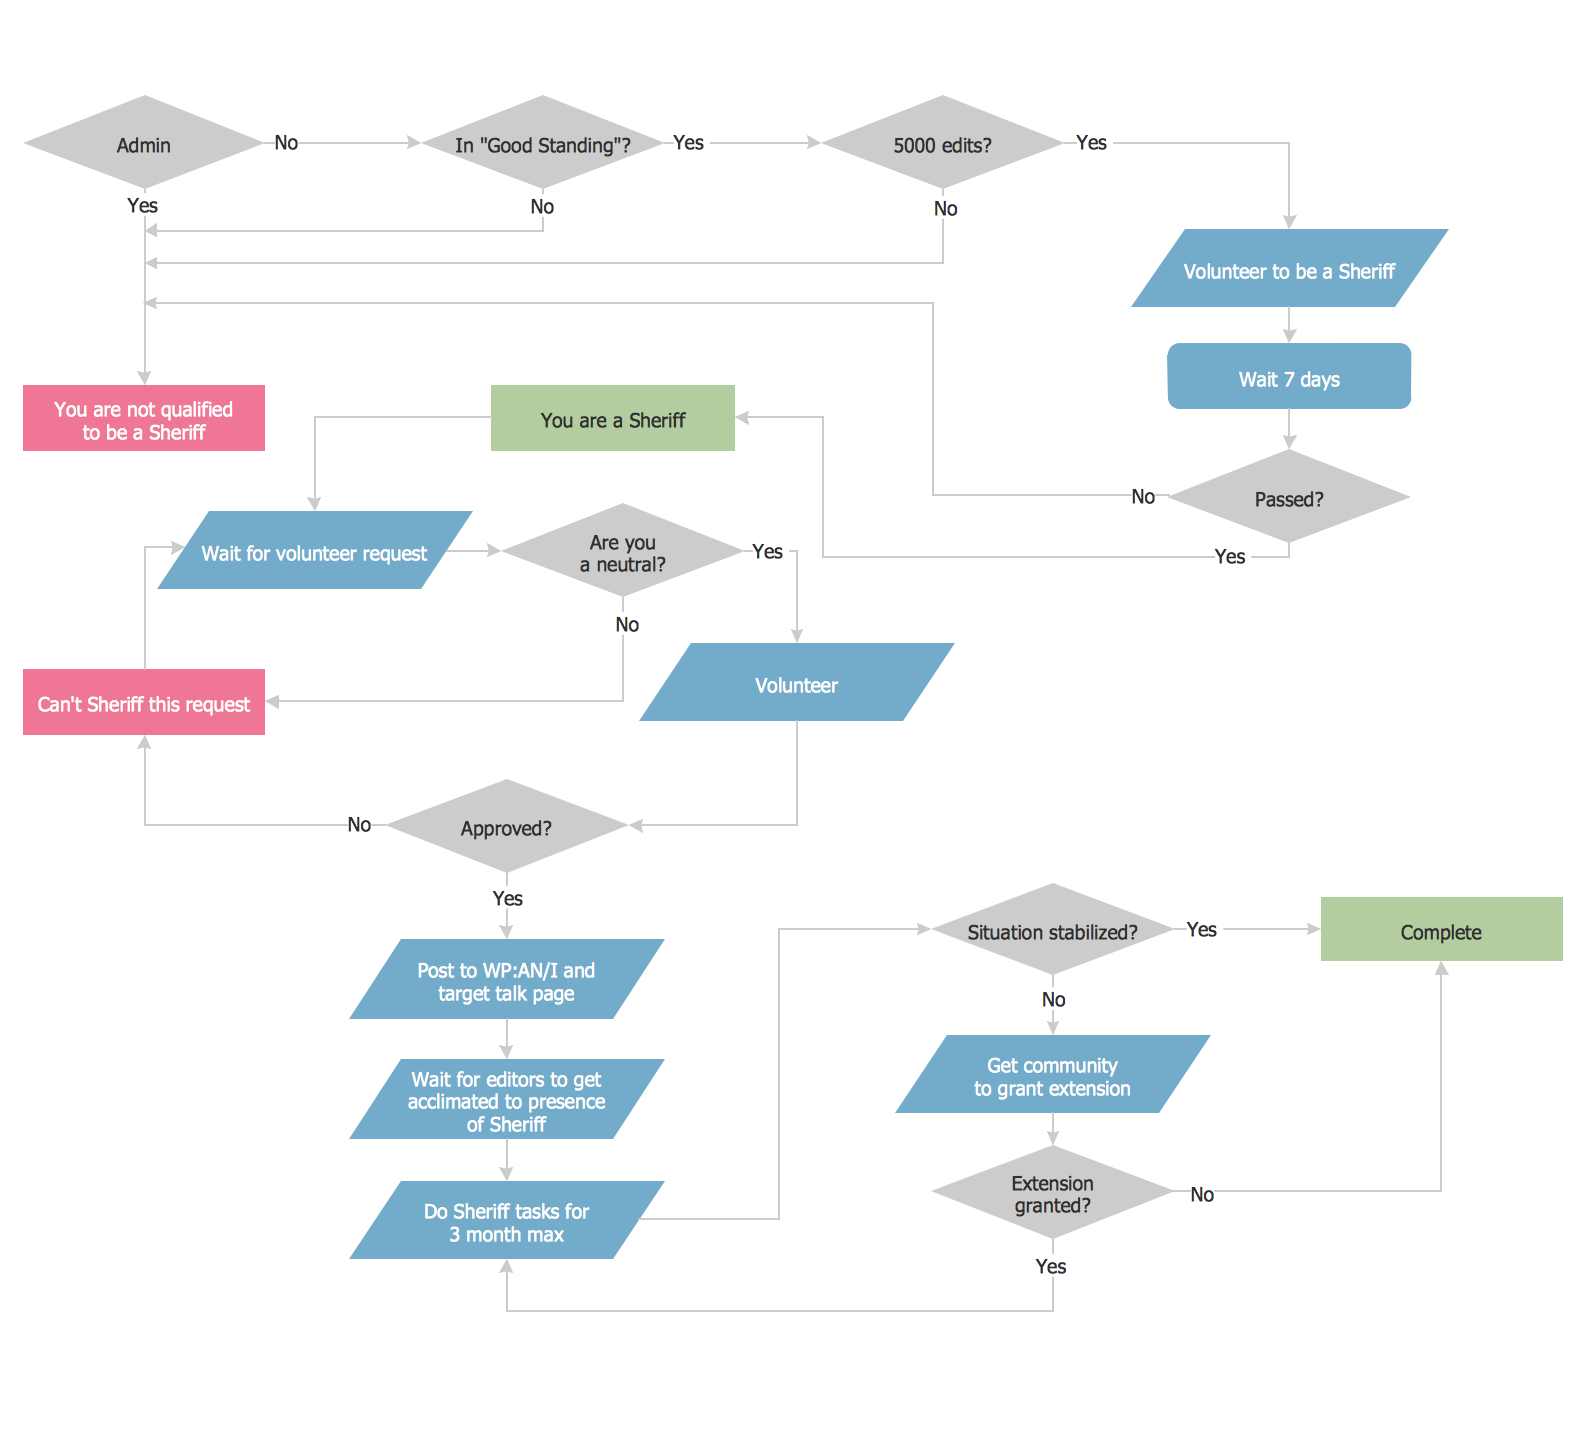
Picture: Example Process Flow Chart
Related Solution:
Learn the most common process flowchart symbols used in business process diagrams and workflow charts. Includes symbol meanings, examples, and a practical reference table.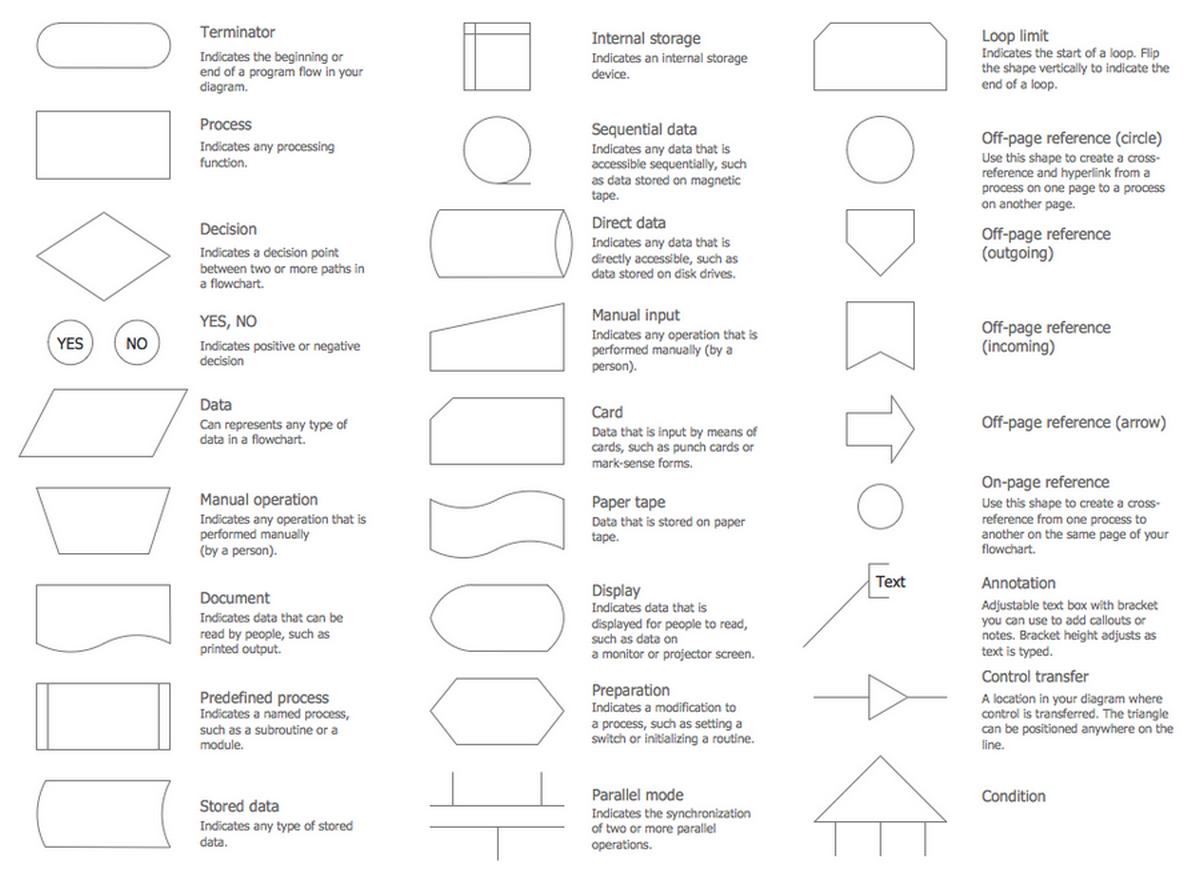
Picture: Process Flowchart Symbols: Meaning, Types and Examples
Related Solution:
The ConceptDraw Flowchart component includes a set of samples and templates. This geathered as flowchart maker toolbox which focused on drawing flowcharts of any industry standards.
Picture: Flowchart Components
Related Solution:
Tips on how to make an accounting flowchart. Describing methods and symbols that are used to represent the accounting system.
Picture: How to Make an Accounting Process Flowchart
Related Solution:
Sales process engineering is a complex and labour-intensive process which requires a lot of time, efforts, and powerful software. We recommend to use the ConceptDraw DIAGRAM software enhanced with Sales Flowcharts solution from the Marketing area of ConceptDraw Solution Park. It gives the possibility to easy illustrate all sales process steps and their results.
Picture: Sales Process Steps
Related Solution:
The HR Management Software is an incredibly powerful tool for those who need to analyze or present human resource process flows in a visually effective manner.
Picture: HR Management Software
Related Solution:
The Total Quality Management Diagram solution helps you and your organization visualize business and industrial processes. Create Total Quality Management diagrams for business process with ConceptDraw software.
Picture: TQM Diagram — Professional Total Quality Management
Related Solution:
Venn Diagrams visualize all possible logical intersections between several sets and are widely used in mathematics, logic, statistics, marketing, sociology, philosophy, etc.
Using the ConceptDraw DIAGRAM you can create your own professional looking Venn Diagrams quick and easy.
Picture: Venn Diagram Template for Word
Related Solution:
ConceptDraw
DIAGRAM 18